• Aucun résultat trouvé

Exploiting Value Prediction With Quasi-Unlimited Resources

N/A
N/A
Protected

Academic year: 2021

Partager "Exploiting Value Prediction With Quasi-Unlimited Resources"

Copied!
49
0
0

Texte intégral

(1)

HAL Id: dumas-00725221

https://dumas.ccsd.cnrs.fr/dumas-00725221

Submitted on 24 Aug 2012

HAL is a multi-disciplinary open access

archive for the deposit and dissemination of

sci-entific research documents, whether they are

pub-lished or not. The documents may come from

teaching and research institutions in France or

abroad, or from public or private research centers.

L’archive ouverte pluridisciplinaire HAL, est

destinée au dépôt et à la diffusion de documents

scientifiques de niveau recherche, publiés ou non,

émanant des établissements d’enseignement et de

recherche français ou étrangers, des laboratoires

publics ou privés.

Exploiting Value Prediction With Quasi-Unlimited

Resources

Arthur Perais

To cite this version:

Arthur Perais. Exploiting Value Prediction With Quasi-Unlimited Resources. Hardware Architecture

[cs.AR]. 2012. �dumas-00725221�

(2)

Exploiting Value Prediction With

Quasi-Unlimited Resources

Internship Report

ISTIC - Research Master in Computer Science (MRI)

Author :

Arthur Perais (arthur.perais@etudiant.univ-rennes1.fr)

Supervisor :

André Seznec (seznec@irisa.fr)

(3)

Contents

1 State-of-the art 6

1.1 Superscalar Processors and Value Prediction . . . 6

1.2 Value Predictors . . . 7

1.2.1 Computational Predictors . . . 8

1.2.2 Finite Context Method (FCM) Predictors . . . 9

1.2.3 Hybrid Predictors . . . 11

1.3 Geometric Length Branch Predictors . . . 13

1.3.1 TAGE and ITTAGE . . . 13

2 Validating the Choice of Geometric Length Value Predictors 16 2.1 Experimental Framework . . . 16

2.2 Experimental Results . . . 16

2.2.1 Global Branch History . . . 16

2.2.2 Path History . . . 17

2.3 Conclusion . . . 17

3 The Value TAgged GEometric Predictor 19 3.1 From ITTAGE to VTAGE . . . 19

3.1.1 Predictor Structure . . . 19

3.1.2 Confidence Estimation . . . 19

3.2 Building a VTAGE-Based Hybrid Value Predictor . . . 20

3.2.1 Computational Component . . . 20

3.2.2 Predictor Configurations . . . 21

3.2.3 Arbitrating Between the Two Components . . . 21

4 Performance Evaluation of the FS-VTAGE Predictor 23 4.1 Objectives . . . 23

4.2 Performance Evaluation on Integer Workloads . . . 23

4.2.1 Experimental Framework . . . 23

4.2.2 Complementarity . . . 24

4.2.3 Accuracy and Coverage . . . 24

4.3 Performance Evaluation on Floating-Point and Vector Workloads . . . 29

4.3.1 Experimental framework . . . 29

4.3.2 Complementarity . . . 31

4.3.3 Accuracy and Coverage . . . 31

4.4 Improving the FS-VTAGE Performance . . . 34

4.4.1 Augmenting The VTAGE Component with Per-Instruction Confidence . . . . 34

4.4.2 Using Confidence Estimation instead of Filtering in Stride . . . . 37

(4)

5 Future Work 41

5.1 Predicting Memory Instruction Addresses and Store Values . . . . 41

5.2 Criticality . . . 41

5.3 Microarchitectural Considerations . . . 42

5.3.1 Misprediction Recovery . . . 42

5.3.2 Prediction Resolution . . . 42

5.3.3 Perspectives Regarding Branch Prediction . . . 43

(5)

Introduction

Recent trends regarding general purpose microprocessors have focused on Thread-Level Parallelism (TLP), and in general, on parallel architectures such as multicores. Specifically, architects have been forced to turn themselves towards parallel architectures since adding transistors to enhance sequential performance does not yield as tremendous improvements as it used to.

However, due to Amdahl’s law, the gain to be had from the parallelization of a program is limited since there will always be an incompressible sequential part in the program. The execution time of this part only depends on the sequential performance of the processor the program is executed on. Combined to the fact that a fair amount of software has not been written with parallelism in mind (and will probably never be rewritten or recompiled), there is still demand for improvement of modern microprocessors sequential performance.

One way to improve it is to leverage Instruction Level Parallelism (ILP), that is the presence in the code of independent instructions which can be executed in parallel. Superscalar processors were proposed to take advantage of ILP as they are able to execute several instructions per cycle. However, ILP has its limits and no processor with a superscalar width greater than six was ever released - Namely, the Intel Itanium - because empirically, there are seldom cases where more than a few instructions from the same control flow can be executed in parallel [9]. This observation can partly be explained by both control and data dependencies between instructions close in the code. Finding a way to break these dependencies would lead to direct sequential performance gains.

Control dependencies are handled via Branch Prediction, which consists in predicting the outcome of a branch before it is actually resolved. That way, the processor can continue fetching instructions instead of waiting for the branch resolution, hopefully on the correct path. True data dependencies (producer/consumer relations between two instructions), on the contrary, are always enforced.

Value Prediction proposes to speculate on the result of instructions in order to break true data depen-dencies. This effectively creates more ILP [16, 7] and allows for early speculative execution of dependent instructions. Value Prediction is based on Value Locality, that is the observation that instructions tend to produce results that were already produced by a previous instance of the instruction [13]. However, previous work in this field has provided us with moderately accurate predictors [14, 18, 26] when accuracy is critical due to misprediction penalties [27]. In this report, we aim to demonstrate that it is possible to design a very accurate hybrid predictor which does not trade accuracy for coverage. That is, a predictor which is able to accurately predict a reasonable amount of instructions. We also expect that many predictions will relate to instructions on the internal critical-path of the processor, where the potential gain of Value Prediction is the highest.

In the first chapter, we will focus on state-of-the-art by introducing superscalar processors and quickly reviewing existing value predictors. In the meantime, we will also describe the TAGE branch predictor and more specifically its sibling the ITTAGE indirect branch target predictor [21, 22, 24]. In the second chapter, we will validate the intuition that using a modified ITTAGE predictor for Value Prediction is worthwhile. Chapter 3 is dedicated to the description of a new hybrid value predictor composed of a Value TAGE predictor and a Stride-based value predictor. Chapter 4 focuses on the performance of this hybrid predictor on integer workloads and compares them to those of existing predictors. It also covers the perspective of

(6)

using Value Prediction in the presence of floating-point [1] arithmetic as well as vector (Single Instruction Multiple Data) instructions. Finally, chapter 5 gives directions for future work.

(7)

Chapter 1

State-of-the art

1.1

Superscalar Processors and Value Prediction

Superscalar processors differ from non-superscalar processors in the way that they can issue and execute several instructions per cycle, therefore having a potential Instruction Per Clock (IPC) greater than 1. For instance, consider the 2-wide superscalar pipeline in Fig. 1.1. In essence, it can be seen as two scalar pipelines placed side by side to allow the execution of two instructions per clock. Naturally, to execute two instructions per cycle, functional units are duplicated. That is, in a superscalar processor, the execution units are redundant to some extent.

Instructions can be executed in-order (static scheduling) or out-of-order (dynamic scheduling). In-order execution means that an instruction cannot begin (resp. finish) execution before an instruction that was located before it in the original code begins (resp. finishes) execution. Fig. 1.1 typically describes such a microprocessor pipeline.

Figure 1.1: 2-wide superscalar 5-stage pipeline (Fetch, Decode, Execute, Memory, Write-back). The major hurdle of static scheduling is that a long-latency instruction will forbid all subsequent instruc-tions to proceed even if these subsequent instrucinstruc-tions do not depend on the said instruction. To address this issue, Out-of-order execution was proposed. With this feature, any instruction whose operands are ready can begin execution, regardless of its original position in the code. Informally, the rough idea is that in superscalar processors, once decoded (in order), instructions are stored in a finite queue (instruction queue). Every cycle, n instructions whose operands are ready and for which an execution unit is available are selected

(8)

in the queue. In the case of in-order execution, the n instructions starting from the head of the queue can be selected, at best. In the case of out-of-order execution, any combination of n instructions can be selected in the queue, as long as they meet the requirements of having their operands ready and an execution unit available. That way, independent instructions can bypass an instruction which is blocked in the pipeline for some reason (structural hazard, data dependency, cache miss and so on). Note that to enforce the program semantics and guarantee precise interruptions, the instructions must be committed in order.

Because of execution units redundancy, several instructions can execute at the same time, but potential performance is lost when some execution units are idle. Even though out-of-order execution usually improves performance, an instruction will never issue if its operands are not available, and a single long-latency instruction can forbid all subsequent instructions to proceed if it is on the critical path. This limitation is referred as the dataflow limit by Lipasti and Shen in [12]. It stems from the simple fact that some instructions depend on the results produced by others (producer/consumer relation) and cannot execute before them because of the program semantics. A similar limit - the control-flow limit - applies to branches: theoretically, an instruction following a branch instruction cannot execute until the branch is resolved because it may or may not have to execute at all depending on the outcome.

However, the processor can speculatively execute instructions as long as it is able to rollback incorrect changes speculatively made to the architectural state. That is, as long as the sequential semantics of the program are enforced. The main example of speculation is Branch Prediction which makes use of small tables to store the speculative outcome of future branches. Predictions are usually generated by observing the behavior of past branches. This mitigates the control-flow limit. To mitigate the dataflow limit, Value

Prediction aims to predict the result of an instruction before it is executed, artificially increasing ILP. With

this predicted result, dependent instructions can execute earlier and the total execution time can be de-creased. Value Prediction works because for a given static instruction, many instances of that instruction will either produce the same result, a result that was previously seen or a result that is a simple function of the previous result. This phenomenon is referred to as Value Locality [12].

As stated in the introduction, the width of available superscalar processors is rather low and increasing it would not be worthwhile due to the limited ILP on most code. Yet, Value Prediction is able to create -even if speculatively - ILP. That is, as well as its potential for increasing sequential performance on modern microprocessors, Value Prediction might also reopen the door to very wide superscalar processors because of the increased potential ILP. Therefore, instead of keeping on adding cores and following the Thread-Level

Parallelism paradigm, one can imagine dedicating more silicon area to fewer very wide superscalar cores to

improve sequential performance and let the intrinsically parallel workloads be run on dedicated hardware (such as GPUs). This would be another step towards heterogeneous architectures.

1.2

Value Predictors

As demonstrated by Tullsen and Seng in [25], using predictors is not the only way to implement Value Prediction. However, it has advantages such as using structures similar to the well known branch predictors, not requiring any work from the compiler or software in general, and finally, being more accurate than what can be seen in [25]. Therefore, we focus only on value predictors in this report.

Sazeides and Smith define two types of value predictors in [18]. Computational predictors generate a prediction by applying a function to the value produced by the previous instance of the instruction.

Context-Based predictors rely on patterns in the value history of a given static instruction to generate the predicted

result of the current instance. The main representatives of both types of value predictors are described in this section. Finally, several hybrid predictors - featuring a computational component along a context-based component - are detailed.

In all cases, the evaluation of the predictors discussed in this section were made on different benchmark suites with different experimental frameworks. As a consequence, we reimplemented most of them and evaluated them using our own experimental framework. We will provide a detailed description of the setup in 4.2.1 for integer workloads and in 4.3.1 for floating-point and vectorized workloads. Results (accuracy

(9)

(a) Last Value predictor. (b) Baseline Stride Predictor.

Figure 1.2: Baseline computational value predictors. From [26]

and coverage) will be given later in 4.2.3 (integer) and 4.3.3 (FP and vectorized code).

1.2.1

Computational Predictors

Last Value Predictor

The simplest computational predictor is the Last-Value predictor. As its name suggests, for a given dynamic instruction, it tries to predict the result produced by the last instance of the same static instruction. It is usually implemented as a simple table (potentially set-associative). An entry of the table contains a tag corresponding to the highest bits of the PC as well as the last value seen by the corresponding instruction. The table is accessed by the lowest bits of the PC, much like in a cache. While this scheme may appear very simplistic, it yields a small speedup. Specifically, Lipasti and Shen showed in [12] that a realistic Last-Value predictor (the predictor only stores the most recently seen value, as opposed to choosing from several previously seen values) yields a 4.5% speedup on programs taken from SPECINT92/95 as well as other UNIX utilities. A Last Value Predictor is shown in Fig. 1.2(a).

Stride and Variations

Stride predictors were proposed mostly to take advantage of loop induction variables. The result of instruc-tions located in the body of a loop often directly depend on the value of the loop induction variable. For instance, when an array is read sequentially by a loop, the effective address of the load instruction is usually of the form : Base + size_of_element * loop_index. In this case, adding the corresponding stride to the last predicted value yields better results than simply returning the last value. The Stride predictor is essentially a Last-Value predictor in which the entries have been augmented with a stride field. In theory, the width of this field should be the width of a register value. However, for 32-bit registers, 8 bits appeared to be sufficient [12]. A similar behavior can be expected when register width is 64 bits. The baseline Stride Value Predictor is shown in Fig.1.2(b).

A possible improvement over this scheme - the two-delta stride predictor - is presented by Eickemeyer and Vassiliadis in [4] and uses two strides to add hysteresis: The stride used to compute the prediction is updated only when the second stride has been observed at least two consecutive times. The second stride is updated every time a prediction is made. In our implementation, this predictor behaves as a Last Value Predictor when a new entry is allocated (the stride used to make the prediction is 0 until it is updated).

(10)

Figure 1.3: Theoretical FCM predictor. From [18]

Other variations include saturating confidence counters to only predict when the entry is confident enough (confidence is incremented by a certain amount when the prediction is correct and decremented by another amount otherwise).

Gabbay and Mendelson proposed a stride-based predictor [5] specifically tailored for predicting floating-point results [1]. The SEF predictor is more accurate than a Last Value or a Stride predictor because it tries to predict each component of a floating-point value separately. That is, a stride is kept for both the mantissa and the exponent. However, we chose not to use it because first, it cannot predict both single and double precision floating-point results out of the box, and second, in the event of a program without FP instructions, all this predictor storage would be wasted, rendering it highly inefficient. Nevertheless, it is surely possible to mix a “regular” Stride predictor with the SEF predictor to improve accuracy and coverage for FP workloads.

1.2.2

Finite Context Method (FCM) Predictors

Ideal FCM Predictor

A FCM predictor of order n uses the last n values in the value history of a given static instruction as its input to generate the speculative result of the current instance. For each possible pattern, the predictor stores saturating counters associated with each relevant value. A high value for a counter means that the associated prediction is very likely to be correct, and reciprocally. For instance, consider Fig. 1.3. The chosen prediction is the value associated with the highest counter matching the current context (history). The base FCM predictor is rather idealistic since for 64-bit registers, the potential number of counters the predictor has to store is 264

, per pattern. Hence, realistic FCM predictors limit the number of counters stored per pattern (that is, the number of actual values that can be chosen by the predictor as the prediction for a given pattern) as well as the value history depth which is often limited to one digit [17, 18].

2-level Predictor

This predictor is a somewhat realistic FCM predictor. It was introduced by Wang and Franklin in [26] and is described in Fig. 1.4. It features two tables. The first one is the Value History Table (VHT) which can store up to four values per entry as well as a Value History Pattern (VHP) consisting of p two-bit fields. Each value stored in the VHT is assigned to the binary encoding {00,01,10,11} so that the VHP effectively records the order in which the last p results of the corresponding static instruction were seen during execution.

The second table is the Pattern History Table (PHT). It stores four counters per entry. The PHT is indexed by p-length bit-vectors from the VHP. When a PHT entry is selected, its four counters are compared

(11)

Figure 1.4: 2-level FCM predictor. From [26]

against each other and the one with the greatest value is selected. If its value is greater or equal to a given threshold, the value in the VHT whose position corresponds to the one of the counter in the PHT is selected as the prediction. In essence, this is a pth order FCM with a history only composed of four different values

(but still p long).

In further experiments presented in chapter 4, we will use this “order 6” (4 different values are tracked) 2-level predictor as well as an “order 8” version featuring a 24-bit history (recording the last 8 values seen because one outcome is now encoded on three bits) and thus a 224

-entry PHT with 8 4-bit counters per entry. We will refer to it as the 2-level+ predictor. This version will only serve to study ideal performance since the PHT only is roughly 537 Mbits in size.

Note that using local value histories makes this predictor very hard to implement if we place ourselves in the context of a very wide and aggressively speculative processor. Indeed, keeping local histories up to date when the processor is speculating on both the branches and the values would be very difficult.

Per-path Stride predictor (PS)

In [14], Nakra, Gupta, and Soffa propose to use the branch history to better establish the current context in which a given dynamic instance is executed, in order to help predict its result. Even though the branch history is used (as opposed to the value history), it still classifies as a FCM predictor. In essence, they pro-pose to modify a 2-delta Stride predictor by hashing the branch history and the PC to access the predictor instead of just using the PC. Actually, the predictor either selects both the stride and the value to which the stride should be added by hashing the PC with the branch history (Fig. 1.5(a)) or selects the stride with the result of the hash and the value with the PC (Fig. 1.5(b)).

The interest of only associating the stride to the context is that the last result of the instruction is stored only once for all the strides, at the cost of the additional tag in the table containing strides. However, associating both the stride and the value to the context should not impede accuracy as it will only consume more space. Therefore, we will only consider the second predictor (1.5) because storage is less of an issue in

(12)

(a) Branch history is used to access both the value and the stride.

(b) Branch history is only used to access the stride.

Figure 1.5: Per-path Stride Predictors. From [14].

the context of our work. One should note that the width of the global branch history considered in [14] is 2, meaning that predictions are only correlated with the two most recent branches. The hash function used by the PS predictor is the following: for i the address of the instruction and b the value of the Branch History Register (BHR), f (i, b) = ((Addr(i) << Size(BHR)) + b) mod Size(V P HT ).

1.2.3

Hybrid Predictors

As stated in [18], context-based predictors are able to capture results that computational predictors cannot, but the opposite is also true. Therefore, constructing hybrid predictors consisting of a computational and a based predictor seems to be a natural way of achieving high accuracy. Furthermore, since context-based predictors tend to require larger table to exceed the accuracy of computational predictors, building a hybrid may allow the size of the context-based predictor to be reduced because both sets of predictable instructions overlap [17].

2-level + Stride

This hybrid is described in [26]. It consists of a 2-level predictor combined with a Stride predictor and it is shown to achieve higher accuracy than each predictor alone. The Stride predictor is a variation of the base Stride predictor in the sense that it uses 2 State bits which allow it to not predict. The automaton of this predictor is shown in Fig. 1.6(a).

The prediction is selected as follow: if the 2-level predictor is confident enough (confidence is greater or equal to a given threshold), then use its prediction, if not and if Stride is in the Steady state, then use the prediction of the Stride predictor, otherwise or in case of a tag mismatch, do not predict. The 2-level + Stride predictor is shown in Fig. 1.6(b). It is also used by Calder, Reinman and Tullsen in [2] as well as Rychlik, Faistl, Krug and Shen in [15]. In the experiments reported in chapters 4, we used a threshold of 6 as it is the threshold used in [26]. Lastly, note that this hybrid suffers from the same implementation-related issues than the 2-level predictor (specifically, keeping local histories up to date).

Per-Path Stride Previous-Instruction (PS-PI)

[14] proposes to use the value produced by the last dynamic instruction executed in the program to help predict the result of the current instruction, and to combine a predictor using this method with the PS

(13)

(a) Filtered Stride predictor automaton.

(b) 2-level + Stride hybrid.

Figure 1.6: 2-level + Stride hybrid. The State field represents the state in which the automaton of the Stride component is in. From [26].

predictor. The resulting predictor is a hybrid consisting of a Per-Path Stride (PS) predictor and a

Previous-Instruction (PI) predictor. Even though the PS predictor classifies as a FCM predictor, its core is still a

Stride predictor, so in essence, the PS-PI predictor is a hybrid of a computational predictor (PS) and an order 1 “global” FCM (PI).

Selection is done by adding confidence counters in the Value Prediction History Table (VPHT) of the PS predictor so that the the prediction of PI is used when the counter in the PS predictor is low enough or simply when there is a miss in the PS predictor. Regardless of which component makes the prediction, confidence is

(14)

Figure 1.7: Per-Path Stride Previous-Instruction Hybrid Value Predictor. From [14].

incremented if PS is correct and decremented if PI is correct and PS hits. Since the Correlation History Table (CHT) of the PI predictor is not tagged, the PS-PI predictor will always make a prediction when the 2-level + Stride can not predict if it is not confident enough. This must be taken into account as the misprediction penalty might be high. The PS-PI predictor is described in Fig. 1.7. In the experiments reported in chapter 4, the threshold used to select the prediction was 3 (PS predicts if confidence is greater or equal to 3, otherwise PI predicts) and the hash function to access the PI is as follow: index = P C xor last_P C xor last_value.

1.3

Geometric Length Branch Predictors

1.3.1

TAGE and ITTAGE

Exploiting branch correlation - i.e. the correlation between the current branch and previous branches to guess the outcome of the current branch - has proven to be very efficient in the field of branch prediction. This is usually implemented by keeping a global (or local) branch history and hashing it in some manner with the current branch instruction address to form an index and access the predictor.

What can be observed is that most of the correlations are found between close branches (in terms of dynamic branch instructions executed), and few correlations are found between distant branches. However, to achieve high accuracy and coverage, capturing correlations between distant branches is necessary. Geometric Length predictors - in the form of the GEHL and TAGE predictors - were proposed by Seznec in [19, 20, 21] to fulfill this very requirement. The TAGE (TAgged GEometric) predictor is described in Fig. 1.8(a).

The basic idea is to have several tables - components - storing predictions, each being indexed by a different number of bits of the global branch history hashed with the PC. The different lengths form a geometric series. This has the good property of dedicating most of the storage to short histories while still being able to capture correlations using very long histories (assuming the tables are similarly sized).

(15)

These tables are backed up by a base predictor which is accessed using only the PC. An entry of a tagged component consists of a partial tag, a usefulness counter u used by the replacement policy and a saturating signed counter pred giving the outcome of the prediction. An entry of the base predictor simply consists of a 2-bit saturating signed counter.

When a prediction is to be made, all components are accessed in parallel to check for a hit. The hitting component accessed with the longest history is called the provider component as it will provide the prediction. The component that would have provided the prediction if there had been a miss in the provider component is called the alternate component. In some cases, it is more interesting to have the alternate component make the prediction (e.g. when the provider entry was allocated recently). Such cases are monitored by a global counter so that if the entry in the provider is a new entry and the global counter is above 0, the alternate prediction is used. This global counter is decremented when pred is equal to altpred, and incremented otherwise. If no components hit, the base predictor provides the prediction.

Once the prediction is made, only the provider is updated. On both a correct or an incorrect prediction,

pred1 and u2 are updated. On a misprediction only, a new entry is allocated in a component using a longer

history than the provider. First, all “upper” components are accessed to see whether one of them has an entry which is not useful (u is 0) or not. If not, the u counter of all matching entries are reset to 0 but no entry is allocated. Otherwise, a new entry is allocated in one of the components whose corresponding entry is not useful. The component is chosen randomly.

TAGE is well suited for branch prediction but also for indirect branch target prediction. The ITTAGE (Indirect Target TAGE) is a variation of the TAGE predictor which stores a full branch target targ as well as a hysteresis counter c in place of the counter used in TAGE to give the branch direction (pred ). The entries are still partially tagged and the usefulness mechanism (deciding which entry to replace via the u field) is kept. It was introduced by Seznec and Michaud in [24] and further described in [22]. Fig. 1.8(b) shows an example of a 5-component ITTAGE predictor.

ITTAGE is essentially a “global” FCM branch predictor since it uses global information to select a prediction. This is a first similarity with context-based value predictors. The second similarity is the fact that ITTAGE is efficient to predict full addresses, that is, 32 or 64-bit values. Therefore, it is only natural to make the following hypothesis: If ITTAGE were to be adapted to predict values, it might be efficient and able to capture part of the predictions that a computational value predictor (such as Stride) cannot capture, as [18] states that both types of value predictors are - to some extent - complementary. Therefore, given a suitable selection mechanism, high accuracy could be obtained by combining a modified ITTAGE with a simple computational value predictor, providing us with an efficient and realistic way of predicting results.

1

pred = pred + 1 if taken or pred − 1 if not taken

2

(16)

(a) 5-component TAGE branch predictor. From [21].

(b) 5-component ITTAGE branch predictor. From [24].

(17)

Chapter 2

Validating the Choice of Geometric

Length Value Predictors

Our first intuition is that ITTAGE can be modified to predict values and perform well, if not better than state-of-the-art. However, we need to assess that using a long branch history to correlate instruction results is efficient. To that extent, this chapter aims to study the similarities between the branch and path histories of two instances of the same static instruction producing the same result. If on average the histories show many similarities, modifying ITTAGE will be worthwhile.

2.1

Experimental Framework

What was studied is the context similarities between two instances of a single static instruction which produce the same result. That is, the similarities between the two global branch histories and the two path histories (consisting of the least significant bit of each jump target the control flow encountered).

We define the number of similar bits in two histories as the number of bits located at the same position in the two histories and having the same value. For instance, 10101010 and 10000110 have four similar bits (bits 0, 1, 6 and 7). We define the common subvector of two histories as the word or arbitrary length for which any bit i is equal to the ithbit in the first history and the ith bit in the second history. i goes from

0 (least significant bit) to j where j is the first bit in history_1 verifying history_1[j] != history_2[j]. For instance, the common subvector of 10101010 and 10000110 is 10 and its length is 2. For each benchmark, we give the average number of similar bits and the average length of the common subvector.

The benchmarks are fast forwarded until the 3Bthdynamic instruction is reached, then, the next million

of register-producing instructions are studied. Even though one million dynamic instructions is a small number, the instrumented code is expected to be executed after the initialization phase of the benchmark and therefore to be representative of the computational part of the program. All SPECINT06 benchmarks [3] are used except perlbench and fed their respective reference workloads. Compilation is done with gcc -O3

-m64 (Pointer width is 64 bits and dynamic linking is enabled). Instrumentation is done with PIN (x86_64

ISA) [10] on an Intel Nehalem.

2.2

Experimental Results

2.2.1

Global Branch History

Because of the accuracy results of the PS predictor [14], it comes as no surprise to see that the global branch histories are showing a common sub-vector in the hundred bits range, on average. In the same manner, the number of overall similar bits is quite high, as shown in Fig. 2.2.1.

(18)

0 50 100 150 200 250 300 350 400 450 500

bzip2_isource bzip2_chicken bzip2_liberty bzip2_iprogram bzip2_text bzip2_icombined gcc_166gcc_200gcc_c_typeckgcc_cp_declgcc_exprgcc_expr2gcc_g23gcc_s04gcc_scilabmcf gobmk_13x13 gobmk_nngs gobmk_score2 gobmk_trevorc gobmk_trevord hmmer_nph3 hmmer_retro sjeng libquantum h264_ref_baseline h264_ref_main h264_sss_main omnetpp astar_2148 astar_rivers xalan avg

Number of History Bits

Benchmark

Similarities Between Branch Histories (512-bit History)

Number of similar bits Length of the common subvector

Figure 2.1: Similarities in the respective two 512-bit global branch histories of two instances of the same static instruction producing the same result.

2.2.2

Path History

Fig. 2.2.2 shows that path histories are also very similar: on average, with a 16-bit path history, three quarters of the two histories are similar and the length of the common sub-vector is two-third of the history length.

2.3

Conclusion

The main difference between path and global branch history is that for the former, the bars look the same for every benchmark whereas they are very different for the latter. This can be explained by the fact that only one bit per address is inserted in the path history, that is, all addresses whose LSB is 1 (resp. 0) are considered equal, leading to heavy aliasing.

The fact that global branch histories show a relatively good amount of similarities between instances producing the same result has one main consequence: if we limit ourselves to a global history length in the range of 100 to 150 bits, we can keep the indexing scheme of ITTAGE as is. The same can be said for the path history.

As a conclusion, we can say that the information used by the TAGE branch predictor (long branch history and a short path history) appear to be appropriate to correlate instructions results, even though a very large branch history will probably not be as efficient for Value Prediction as it is for Branch Prediction. Consequently, the maximum length of the branch history used in further experiments was limited to 128 bits (a value close to the average length of the common subvector observed for the studied benchmarks).

(19)

0 5 10 15 20

bzip2_isource bzip2_chicken bzip2_liberty bzip2_iprogram bzip2_text bzip2_icombined gcc_166gcc_200gcc_c_typeckgcc_cp_declgcc_exprgcc_expr2gcc_g23gcc_s04gcc_scilabmcf gobmk_13x13 gobmk_nngs gobmk_score2 gobmk_trevorc gobmk_trevord hmmer_nph3 hmmer_retro sjeng libquantum h264_ref_baseline h264_ref_main h264_sss_main omnetpp astar_2148 astar_rivers xalan avg

Number of History Bits

Benchmark

Similarities Between Path Histories (16-bit History)

Number of similar bits Length of the common subvector

Figure 2.2: Similarities in the respective two 16-bit path histories of two instances of the same static instruc-tion producing the same result.

(20)

Chapter 3

The Value TAgged GEometric

Predictor

The previous chapter showed that the information used by the TAGE indexing scheme for Branch Prediction is also relevant for Value Prediction. This scheme is also used by the ITTAGE predictor whose role is to predict indirect jump addresses, which are not that different from register values. Therefore, the next step is to adapt the ITTAGE indirect branch target predictor to Value Prediction.

3.1

From ITTAGE to VTAGE

3.1.1

Predictor Structure

In fact, not much has to be changed to have ITTAGE predict values since the indexing mechanism can be kept as is. The target field has to be replaced by a value field which will contain a full (64 bits) register value instead of a branch target. The remaining variables are the number of tables, the partial tag width, the hysteresis counter width and the history update scheme. However, in the first version of our value predictor, all those variables were kept as in ITTAGE [22]. As a result, all configurations feature a single useful bit per entry in the tagged components and a 2-bit hysteresis counter ctr per entry in every component. The tag of tagged components is 7-bit long. Table 3.1 summarizes the different configurations we used. We refer to this predictor as the Value TAGE (VTAGE) predictor.

Configuration #Components H0 Hmax #Entries/component Size

Small 1+7 1 64 210

≃ 598 Kbits Quasi-Unlimited 1+7 1 64 2pointer_size (Base) | 220

(Tagged) -.

Table 3.1: VTAGE Configurations Summary.

Because of physical memory limitations, we chose to limit the size of tagged components in the

Quasi-Unlimited configuration to 220

bits. Therefore, ideal performance will not be attained since two predictions may compete for an entry in a tagged component. However, the number of entries is such that we do not expect much aliasing.

3.1.2

Confidence Estimation

Prior to anything, we must determine how to decide if a prediction from VTAGE should proceed or not. In our case, we aim to maximize accuracy because mispredicting is costly [27]. As demonstrated in [23], it is possible to gauge the confidence of a prediction made by TAGE simply by observing the output, that

(21)

is, the value of the pred counter. In VTAGE, the pred counter is replaced by the value field containing the prediction. However, each VTAGE entry features a 2-bit hysteresis counter (ctr ) whose behavior will strongly resemble that of the pred counter of TAGE. Intuitively, a high value for this counter means that the prediction was correct several times, so it has a high confidence and is essentially equivalent to having the pred counter saturated. Similarly, a low value for ctr means that the prediction was recently incorrect or that the entry has been newly allocated. In both cases, the prediction is not reliable, much like in the case of having the pred counter set to weak taken/not taken. Therefore, the hysteresis counters can be used to decide if VTAGE should predict or not.

0 10 20 30 40 50 60 70 80 90 100

Small_VTAGEQUL_VTAGE Small_VTAGEQUL_VTAGE Small_VTAGEQUL_VTAGE Small_VTAGEQUL_VTAGE

Percentage of Predictions with Confidence X

Accuracy of VTAGE and F-Stride Given the Confidence of VTAGE

Correct ( = Accuracy) Incorrect Confidence 3 Confidence 2 Confidence 1 Confidence 0

Figure 3.1: Average accuracy of VTAGE on its confidence. Results were gathered using the setup described in 4.2.1

Fig. 3.1 reports the accuracy of VTAGE for all possible confidence values. Results were collected on SPEC06INT benchmarks, and a detailed setup will be given later in 4.2.1. It appears that for all confidence values but 3, accuracy is not high enough to be interesting. Therefore, VTAGE should only be allowed to predict if the confidence associated with the prediction is 3.

3.2

Building a VTAGE-Based Hybrid Value Predictor

3.2.1

Computational Component

We chose the variation of the base Stride predictor used in the 2-level + Stride hybrid (see Fig. 1.6(a) in 1.2.3) as the computational predictor for our hybrid. We refer to it as the Filtered Stride predictor or F-Stride. This choice is mostly motivated by its reasonable coverage and its high accuracy (see Fig. 4.3 in 4.2.3 for detailed results) as well as its simplicity. The main difference is that we did not use tags for the

Filtered Stride predictor as the filtering mechanism proved sufficient for our runs. We refer to the resulting

hybrid predictor as the FS-VTAGE predictor.

Other candidates were the Last Value Predictor, which is in fact included in the Stride predictor, the 2-delta Stride Predictor, which is also a good candidate but is likely to be more complicated to update and lastly, the PS Predictor, even though it also qualifies as a FCM predictor. However, it appeared to us that PS would not bring much to VTAGE, because intuitively, the FCM behavior of PS is likely to be captured

(22)

by VTAGE while the computational behavior will be captured by Stride (or 2-delta). Therefore, we chose the simplest solution.

3.2.2

Predictor Configurations

A total of three configurations were used. For the first two configurations, VTAGE was combined with a similarly sized Filtered Stride predictor. In the third configuration (ULS ), a Small TAGE predictor was combined to an “infinite” Filtered Stride predictor to check if even a small VTAGE can capture results that an “infinite” Stride predictor cannot. Table 3.2 summarizes the different characteristics of the predic-tors. Because we place ourselves in the context of future multicores featuring a lot of storage, the Small configuration is actually rather big by today’s standards.

Hybrid Entries (F-Stride + VTAGE) Tag Total Size (64-bit Stride)

Small 213

+ (1024 × 8-components) 7 bits ≃ 1, 64 Mbits Quasi-Unlimited 2pointer_size+ (2pointer_size+ 220

× 7 T-components) 7 bits -ULS 2pointer_size+ (1024 × 8-components) 7 bits

-Table 3.2: FS-VTAGE Hybrid configurations summary.

On a related note and as stated in 1.2.1, the theoretical length of a stride is similar to that of a register, but in reality, an 8-bit stride is sufficient for 32-bit registers and a similar tradeoff can undoubtedly be made for 64-bit registers. However, further experiments with hybrid predictors use 64-bit strides so that complementarity between the two predictors is assured not be biased by having the Filtered Stride predictor mispredict due to the stride length.

3.2.3

Arbitrating Between the Two Components

To finalize the hybrid, we must decide which predictor should provide the result when both of them make a prediction, that is if the confidence associated with the prediction of VTAGE is 3 and the F-Stride predictor entry is in the Steady state. Fig. 3.2 suggests that in this case, it is slightly beneficial to favor VTAGE, whether in the finite configuration or the “infinite” one. As a consequence, our implementation always selects the value from VTAGE should the two predictors propose a prediction.

(23)

0 10 20 30 40 50 60 70 80 90 100

Small_VTAGESmall_FStrideQUL_VTAGEUL_FStride Small_VTAGESmall_FStrideQUL_VTAGEUL_FStride Small_VTAGESmall_FStrideQUL_VTAGEUL_FStride Small_VTAGESmall_FStrideQUL_VTAGEUL_FStride

Percentage of Predictions with Confidence X

Accuracy of VTAGE and F-Stride Given the Confidence of VTAGE

Correct ( = Accuracy) Incorrect Confidence 3 Confidence 2 Confidence 1 Confidence 0

Figure 3.2: Average accuracy of VTAGE and F-Stride depending on VTAGE confidence when both predictors attempt to predict. Results were gathered using the setup described in 4.2.1

(24)

Chapter 4

Performance Evaluation of the

FS-VTAGE Predictor

4.1

Objectives

In the last chapter, we presented the FS-VTAGE predictor. To demonstrate the qualities of this predictor, we will focus on two main objectives. First, we aim to assess the complementarity existing between the Filtered Stride and VTAGE predictors, that is the percentage of results that each predictor is able to capture and not the other. This metric will give us insight on the interest of putting a Stride-based predictor alongside a VTAGE predictor. Second, we will gauge coverage and accuracy. These quantities naturally depends on complementarity: if complementarity is non-existent, then the number of correct predictions will be at best that of the predictor with the highest coverage. However, if complementarity is non-negligible, these metrics will allow us to gauge the selection mechanism as well as simply compare this predictor with other hybrids. We will study the behavior of FS-VTAGE on integer and floating-point workloads separately.

Finally, since Value Prediction appeals for very high accuracy, our last goal will be to propose improve-ments to the FS-VTAGE predictor, should the baseline predictor not already be efficient enough.

4.2

Performance Evaluation on Integer Workloads

4.2.1

Experimental Framework

All benchmarks from SPECINT06 [3] were used and compiled with gcc -O3 -m64, except perlbench which was compiled with gcc -O1 -m64. Pointer width is 64 bits and dynamic linking is enabled. Instrumentation begins with the first instruction (no fast-forward) and lasts until two billion dynamic instructions have been instrumented. All benchmarks are fed their respective reference workloads. Instrumentation is done with PIN (x86_64 ISA) [10] on an Intel Nehalem. Fig. 4.1 details the percentage of executed instructions eligible for Value Prediction. VP-eligible instructions are all general-purpose integer register-producing instructions as well as non-store instructions whose destination is a memory location (e.g. add mem1, mem2 ). We leave memory operation address prediction and store value prediction for future work (see chapter 5).

Also, note that in modern x86 microprocessors, each instruction is broken down into one or more internal RISC-like µ-operations. For instance, instructions such as add mem1, mem2 will in fact be broken down into two load instructions, one add instruction and one store instruction. Since we instrument at the instruction level, we will only try to predict the add instruction, and not the two load instructions. As a result, the numbers of Fig. 4.1 may be lower than what could be observed in related work using RISC ISAs. Finally, as only one thread is using the predictor, results are likely to be optimistic. In a real-world environment, context switching and Simultaneous Multithreading (SMT) may lower the numbers we obtained.

(25)

0 10 20 30 40 50 60 70 80 90 100

perlbench_splitmailperlbench_diffmailperlbench_checkspambzip2_chickenbzip2_libertybzip2_iprogrambzip2_textbzip2_icombinedbzip2_166gcc_200gcc_typeckgcc_cp_declgccgcc_exprgcc_expr2gcc_g23gcc_s04gcc_scilabmcfgobmk_13x13gobmk_nngsgobmk_score2gobmk_trevorcgobmk_trevordhmmer_nph3hmmer_retrosjenglibquantumh264_ref_baselineh264_ref_mainh264_sss_mainomnetppastar_2148astar_riversxalanspecrandavg

Percentage of Executed Instructions

Benchmark

Percentage of Executed Instructions Used for Instrumentation

Figure 4.1: Percentage of VP-eligible instructions per benchmark.

4.2.2

Complementarity

The two leftmost bars in Fig. 4.2 show that on average, 17% (resp. 22.5%) of the VP-eligible instructions are correctly predicted by Small VTAGE (resp. Quasi-Unlimited VTAGE) only, 20% (resp. 15%) of the VP-eligible instructions are correctly predicted by Small Stride (resp. Unlimited Stride) only, and another 27% (resp. 33%) of the VP-eligible instruction are correctly predicted by both. For ULS, the results are only slightly worse than for the Small configuration, further indicating that the two predictors indeed exhibit good complementarity.

These numbers demonstrate that complementarity exists and is non-negligible, even for very imbalanced predictor sizes. Therefore, assuming a reasonably good selection method, the FS-VTAGE hybrid will cor-rectly predict more results than each predictor alone.

4.2.3

Accuracy and Coverage

To describe the following experiments, we define Coverage1, which represents the total number of correctly

predicted results out of the number of instrumented instructions, and Accuracy2, which represents the

chances for a prediction to be correct. For Value Prediction, accuracy is as important (if not more) as the global number of correct predictions because of the cost of a misprediction [27]. That is, depending on the misprediction penalty, it may be more interesting to have a predictor correctly predicting 99% (accuracy) of 50% (coverage) of the instrumented instructions than a predictor correctly predicting 75% of the instrumented instructions.

Distinct Predictors

As a first step, we evaluated the different predictors presented in section 1.2.1 and 1.2.2 on the same bench-marks as the ones we used to evaluate VTAGE. Table 4.1 and Table 4.2 respectively summarize the charac-teristics of the finite and “infinite” configurations used for all non-hybrid predictors.

1

(Correct/Instrumented) × 100

2

(26)

0 10 20 30 40 50 60 70 80

Small QUL ULS

Percentage of Instrumented instruction

Predictor Configuration Complementarity by Configuration

TAGE correct only Stride correct only Both correct

Figure 4.2: Complementarity by Predictor Configuration.

Predictor #Entries Tag Size

Small F-Stride 213

None ≃ 1.05 Mbits Small F-Stride w/ TAG 213

Full (51 bits) ≃ 1.47 Mbits Small 2-delta 213

None ≃ 1.57 Mbits Small 2-delta w/ TAG 213

Full (51 bits) ≃ 1.99 Mbits Small PS_64b 210

× 4-way Full (54 bits) ≃ 1.02 Mbits Big PS_64b 211

× 4-way Full (53 bits) ≃ 2.03 Mbits Small PS_8b 210

× 4-way Full (54 bits) ≃ 538 Kbits Small 2-level 211

(VHT) + 212

(PHT) Full (53 bits) ≃ 722 Kbits Small VTAGE 210

× 8-components 7 bits (7 T-components) ≃ 532 Kbits .

Table 4.1: Finitely-sized configurations summary. Top: computational predictors, bottom: context-based predictors. If not precised, the stride length is 64 bits.

Predictor #Entries Tag

UL F-Stride 2pointer_size None

UL 2-delta 2pointer_size None

UL PS 2pointer_size Branch history depth (2 bits)

UL 2-level 2pointer_size (VHT) +212

(PHT) None

UL 2-level+ 2pointer_size (VHT) +224

(PHT) None

Quasi-UL VTAGE 2pointer_size+ 220

× 7 T-components 7 bits (7 T-components) .

Table 4.2: “Infinitely”-sized configurations summary. Top: computational predictors, bottom: context-based predictors. UL stands for UnLimited.

One could argue that the size of the respective finitely-sized predictors vary from 532Kbits to 1.99Mbits, rendering the comparison irrelevant. However, what interests us most is to compare predictors belonging to

(27)

the same category (computational and context-based). From this angle, the range of sizes is much narrower. Moreover, because the PS predictor can be viewed as either a computational or context-based predictor, we study three finite configurations. The two first (Small_64b and Big_64b) feature 64-bit strides so that they can be compared to computational predictors. The third one (Small_8b) features 8-bit strides to reduce its size in order to be compared to context-based predictors. Furthermore, by comparing results of the Small_8b and Small_64b configurations, we will be able to gauge the impact of the stride size on accuracy and coverage. Lastly, as the “infinite” configurations aim to gather optimal results, they all make use of 64-bit strides. Fig. 4.3 summarizes the number of correctly, incorrectly and not predicted instructions. Table 4.3 summarizes accuracy and coverage.

0 10 20 30 40 50 60 70 80 90 100

Small_F-StrideSmall_F-Stride_WTAGUL_F-Stride Small_2DSmall_2D_WTAGUL_2D Small_PS_8bSmall_PS_64bBig_PS_64bUL_PSSmall_2level_Thresh3UL_2level_Thresh3UL_2level+_Thresh3Small_2level_Thresh6UL_2level_Thresh6UL_2level+_Thresh6Small_VTAGEQUL_VTAGE

Percentage of Instrumented instruction

Predictor Configuration Results by Configuration

Correctly Predicted Incorrectly Predicted

Not predicted

Figure 4.3: Results for different value predictors.

Predictor Accuracy Coverage Small F-Stride 91.2% 47.1% Small F-Stride w/ TAG 91.3% 45.4% Small 2-delta 57.9% 57.6% Small 2-delta w/ TAG 60.5% 55.2%

Small PS_64b 58.6% 49.5% Big PS_64b 56.2% 51.6% Small PS_8b 56.8% 48.0% Small 2-level (Thresh 3) 71.3% 34.8% Small 2-level (Thresh 6) 79.0% 34.9% Small VTAGE 94.4% 36.8%

Predictor Accuracy Coverage UL F-Stride 91.5% 48.3% UL 2-delta 60.4% 58.7% UL PS 57% 57.1% UL 2-level (Thresh 3) 73.5% 40.8% UL 2-level (Thresh 6) 78.8% 40.7% UL 2-level+ (Thresh 3) 78.0% 46.5% UL 2-level+ (Thresh 6) 82.6% 45.2% Quasi-Unlimited VTAGE 95.7% 42.8% .

Table 4.3: Accuracy and coverage summary for distinct value predictors. Left: finite configurations, right: “infinite” configurations. Top: computational predictors, bottom: context-based predictors.

Before analyzing the results, let us focus on the stride sizes: the difference between 8-bit strides (Small PS_8b) and 64-bit strides (Small PS_64b) is a coverage of 1.8% more of the instrumented instructions in favor of Small PS_64b and an accuracy which increases from 48.0% to 49.5%. Therefore, if not optimal,

(28)

using 8-bit strides is bearable, even for 64-bit registers.

For computational predictors, we can observe that the Filtered Stride predictor is the most interesting computational predictor of our set mostly due to its very high accuracy. 2-delta is not accurate enough although it could be augmented with confidence counters and behave similarly to Filtered Stride. Higher accuracy is however not guaranteed. The “infinite” configurations exhibit similar results, hinting that most static instructions eligible for Value Prediction can fit in an 8K-entry predictor for the majority of the benchmarks. The PS predictor is much less accurate and only covers slightly more instructions, rendering it uninteresting as a computational predictor. Interestingly, PS has less coverage than 2-delta, whereas the only difference between the two predictors is the indexing function. This essentially means that either branch history is not relevant enough to correlate results, which is in contradiction with 2.2.1 or that the hashing function used in [14] is not efficient enough.

Regarding context-based predictors, the 2-level predictor has the lowest coverage and a much lower ac-curacy than VTAGE. However, the 2-level+ shows better acac-curacy and coverage, hinting that a 4096-entry PHT is suffering from aliasing. However, the cost of expanding it seems prohibitive: as said in 1.2.2, in-creasing the value history from 4-deep to 8-deep results in a PHT size of roughly 537 Mbits (vs. 65 Kbits) if only the last 8 outcomes are recorded. Furthermore, even though PS has better coverage (around 10% of the instrumented instructions more, 15% in the “infinite” case), VTAGE is more interesting because it has a much higher accuracy. One could argue that adding confidence counters to the baseline PS predictor would yield a better accuracy, and this is most likely to be true. However, in the end, the strongest argument of VTAGE is that it is not a stride-based predictor, meaning that it can be combined with a stride-based predictor because both are complementary enough, as demonstrated in 4.2.2. On the contrary, combining PS with another stride-based predictor should not yield tremendous results, to say the least.

The results indeed advocate for a combination of a VTAGE predictor and a Filtered Stride predictor to attain high accuracy and moderate coverage. Considering the number of Table 4.3 and Fig. 4.2, we can expect an accuracy greater than 90% with a coverage greater than 50%. These numbers are quite interesting since [2] claims that the full potential of Value Prediction can be obtained by - correctly - predicting only 60% of the VP-eligible instructions. Those instructions are in fact the instructions on the internal critical-path of the processor.

Hybrid Predictors

In a second step, we evaluated the hybrid predictors presented in 1.2.3 on the same benchmarks as the ones we used to evaluate FS-VTAGE. Table 4.4 and Table 4.5 respectively summarize the characteristics of the finite and “infinite” configurations used for all hybrid predictors. Fig. 4.4 summarizes the number of correctly, incorrectly and not predicted instructions. Table 4.6 summarizes accuracy and coverage. Note that in this case, the Small configurations of 2-level + Stride, PS-PI and FS-VTAGE all feature the approximate same amount of storage and make use of 64-bit strides.

Hybrid #Entries Tag Size

Small 2-level + Stride 212

(VHT) + 212

(PHT) Full (52 bits) ≃ 1.68 Mbits Small PS-PI 210

× 4-way (PS) + 212(PI) Full (54 bits, PS) ≃ 1.55 Mbits Small FS-VTAGE 213

+ (210

× 8-components) 7 bits (7 T-cpts, VTAGE) ≃ 1.64 Mbits .

(29)

Hybrid #Entries Tag UL 2-level + Stride 2pointer_size (VHT) + 212

(PHT) None

UL 2-level+ + Stride 2pointer_size (VHT) + 224

(PHT) None

UL PS-PI 2pointer_size

× 2 (VHT+SHT) + 2pointer_size (PI) bhist depth (2 bits, PS) QUL FS-VTAGE 2pointer_size+ (2pointer_size+ 220

× 7 T-compts) 7 bits (7 T-cpts, VTAGE) .

Table 4.5: “Infinitely”-sized hybrid configurations summary.

The coverage of the FS-VTAGE hybrid is indeed greater than 50% at 56.9% (Small ) and 61.2%

(Quasi-Unlimited ). It is actually slightly higher than that of the 2-level + Stride hybrid (55.6% and 59.8%) and

equal to that of the PS-PI for the finite case (56.9%). However, it is lower than that of the PS-PI (67.7%) and 2-level+ + Stride (63.7%) for the “infinite” case.

30 40 50 60 70 80 90 100

Small_2level_T6_StrideUL_2level_T6_StrideUL_2level+_T6_StrideSmall_PS-PI_Thresh3UL_PS-PI_Thresh3Small_FS-VTAGEQUL_FS-VTAGE

Percentage of Instrumented instruction

Predictor Configuration Results by Configuration

Correctly Predicted Incorrectly Predicted

Not predicted

Figure 4.4: Results for different hybrid value predictors.

Predictor Accuracy Coverage Small 2-level + Stride 81.9% 55.6%

Small PS-PI 56.9% 56.9% Small FS-VTAGE 91.5% 56.9%

Predictor Accuracy Coverage UL 2-level + Stride 82.0% 59.8% UL 2-level+ + Stride 85.0% 63.7% UL PS-PI 67.7% 67.7% QUL FS-VTAGE 91.2% 61.2%

.

Table 4.6: Accuracy and coverage summary for hybrid value predictors. Left: finite configurations, right: “infinite” configurations.

Accuracy is high at 91.5% (Small ) and 91.2% (Unlimited ) which is much higher than that of other predictors: The second most accurate predictor accuracy score is 9.6 points lower in the finite case (2-level + Stride) and 6.2 points lower in the “infinite” case (2-level+ + Stride).

We can also observe that the accuracy difference between the Small and Quasi-Unlimited configurations is very small (around 0.3 point in favor of the smallest). However, the difference in coverage is non-negligible (around 4% of the instrumented instructions in favor of the biggest). Therefore, even though FS-VTAGE is

(30)

very accurate whatever its size, its coverage will benefit from increasing the components size.

To conclude, we indeed obtain an accuracy higher than 90%, which is better than that of any other hybrid considered, and a coverage higher than 50%, which is reasonable even though the PS-PI predictor covers slightly more results. Consequently, we claim that the FS-VTAGE predictor is the most interesting value predictor so far.

4.3

Performance Evaluation on Floating-Point and Vector

Work-loads

Floating point (FP) [1] instructions also exhibit Value Locality [12]. However, locality is somehow less prevalent than in integer workloads. Therefore, worse results than those observed for integer benchmarks are expected [5]. We chose to make the distinction between integer and FP results for the following reason: because of the way PIN instruments the code and the way the x87 ISA works, getting the result of x87 FP operations has proven very difficult and error-prone. Therefore, we chose to use the Streaming SIMD

Extensions (SSE) ISA3 as the FPU because first, it is easier to manipulate with PIN, and second, x87 is

generally less efficient and SSE should be used when possible [11]. Interestingly, SSE features both scalar and vector instructions. Vector (Single Instruction Multiple Data or SIMD) instructions operate on several variables packed (concatenated) in a special purpose register (64-bit mm or 128-bit xmm for SSE). For instance, one 128-bit vector multiplication can multiply four single precision FP variables with four other FP variables, increasing throughput by the same amount.

Vectorized code is much more efficient than scalar code, and should always be used if possible. However, in the event of Value Prediction being only capable of predicting the value of general purpose registers, the programmer (or the compiler) will have to choose between the two features (VP or SIMD) if the code is vectorizable. Yet, Value Prediction may benefit to SIMD instructions.

In general, both SSE scalar and SSE vector instructions are present in the generated code. Therefore, we chose to use this opportunity as a way to verify the Value Locality of FP instructions as well as to assess the potential of Value Prediction for vector instructions.

4.3.1

Experimental framework

All floating-point benchmarks of the SPECFP06 suite [3] were used and compiled on an Intel Nehalem with

gcc -O3 -mfpmath=sse -msee4.1 -march=native -mno-mmx -m64 in order to force the use of SSE instead of

x87 for FP instructions. Pointer width is 64 bits and dynamic linking is enabled. The benchmarks are fed their respective reference workloads. The first 10 billion instructions are skipped and the benchmarks are then run until 10 billion instructions have been instrumented as longer runs proved necessary to obtain relevant results for FP workloads. Instrumentation is done with PIN (x86_64 ISA) [10] on an Intel Nehalem. Fig. 4.5 summarizes the percentage of executed instructions that were instrumented for all benchmarks. VP-eligible instructions are all special-purpose xmm register-producing instructions.

In addition to using scalar SSE instructions for FP arithmetic, compiling with full optimizations

(-O3 ) allows gcc to automatically vectorize code, that is factorize computations by replacing several scalar

instructions by a single vector instruction when possible. Furthermore, SSE is able to operate on both integer and floating-point variables. Therefore, we define four categories of instructions among the instrumented instructions : FP_Scalar, FP_Vect, INT_Scalar and INT_Vect. However, since no instructions belonging to the INT_Scalar category were generated when compiling the considered benchmarks, the INT_Scalar category is ignored in the following sections. Fig. 4.6 summarizes the proportion of instrumented instructions each category represents. Note that the number of instructions belonging to the INT_Vect category is negligible for all benchmarks except milc and soplex.

3

(31)

0 10 20 30 40 50 60 70 80 90 100

bwavesgamess_triagamess_h2ocu2+gamess_cytosinemilc zeusmpgromacscactusADMleslie3dnamd dealII soplex_refsoplex_pds_50povraycalculixGemsFDTDtonto lbm wrf sphinxavg

Percentage of Instrumented SSE Instructions

Benchmark

Percentage of Instrumented SSE Instructions

Figure 4.5: Percentage of VP-eligible SSE instructions per benchmark.

0 10 20 30 40 50 60 70 80 90 100

bwavesgamess_triagamess_h2ocu2+gamess_cytosinemilc zeusmpgromacscactusADMleslie3dnamd dealII soplex_refsoplex_pds_50povraycalculixGemsFDTDtonto lbm wrf sphinxavg

Percentage of Instrumented Instructions

Benchmark

Distribution of instructions by category for SPEC06FP Benchmarks

Scalar FP Vector FP Vector INT

(32)

In order to predict the results of up to 128-bit wide vector instructions, all predictors were augmented with 128-bit entries. For VTAGE and 2-level, this is straightforward since only the prediction needs to be stored. For stride-based predictors, each 128-bit entry actually contains 4 32-bit values and 4 32-bit strides. The tradeoff of using a smaller stride to save storage can still be made although several strides must be stored (one 8-bit stride per 32-bit variable of a 128-bit register for instance). To generate a prediction, each stride is added to the corresponding value independently from the others, meaning that overflowing is not propagated in any way. The four values are then concatenated to form the prediction. On an update, all strides and values are updated. In this section, we only consider hybrid predictors by lack of time.

Table 4.7 summarizes the different hybrid configurations. Due to the fact that much longer runs were needed to acquire relevant results, the “infinite” configuration of PI is less idealistic because of physical memory limitations. For predictors using PC-only indexing such as Stride, 2-level and PS (PC hashed to 2 bits), the Unlimited configuration is similar to that used for integer benchmarks. It should be noted that the Small FS-VTAGE predictor is 9,5% bigger than the Small 2-level + Stride. Even though this is not a tremendous difference, this is non-negligible and we will consider it when analyzing the results.

Hybrid Entries Tag Size

Small 2-level + Str 4096 (VHT) + 4096 (PHT) 52 bits ≃ 2, 95 Mbits UL 2-level + Str 2ptr_size (VHT) + 4096 (PHT) None

-Small PS-PI 1024 × 4-way (PS) + 8192 (PI) 54 bits (PS) ≃ 3, 12 Mbits Quasi-UL PS-PI 2ptr_size

× 2 (VHT+SHT) + 224(PI) 2 bits (PS) -Small FS-VTAGE 213

+ (1024 × 8-components) 7 bits (VTAGE) ≃ 3, 23 Mbits Quasi-UL FS-VTAGE 2ptr_size+ (2ptr_size+ 220

× 7-components) 7 bits (VTAGE) -Table 4.7: Hybrid configurations summary.

4.3.2

Complementarity

Fig. 4.7 illustrates the complementarity of the components of F-Stride + VTAGE for floating-point and vector workloads.

What can be observed is that for this particular sample, the number of VTAGE-only predictable results (scalar or vector) is around 5 times bigger than the number of Stride-only predictable results, depending on the configuration. In fact, the VTAGE component is able to capture most of what the Stride component can predict since the number of results predictable by both components is quite high: between 40% and 45% of the instrumented instructions. The difference between these numbers and those found for integer workloads is probably due to the fact that adding a stride to a floating-point value as a whole does not make much sense since a FP number is made of several fields.

4.3.3

Accuracy and Coverage

Fig. 4.8 and 4.9 respectively summarize the number of correctly, incorrectly and not predicted instructions for all instrumented instructions and per-category. Table 4.6 summarizes accuracy and coverage. If we compare the results shown in Fig. 4.8 to integer results, accuracy is either higher for 2-level + Stride (89.3-89.5% vs. 81.8-82.0%), lower for PSPI (39.5% vs. 56.9%) and roughly similar for FS-VTAGE (90.2-89.9% vs. 87.1-90.0%). However, coverage is generally much lower at 41.1-42.2%, 39.5% and 40.7-41.9% versus 55.6-59.8%, 56.9% and 60.5-67.0% for 2-level + Stride, PSPI and FS-VTAGE respectively. In essence, all three hybrids globally cover roughly the same number of instructions, but FS-VTAGE is more accurate.

Since the number of integer SSE instructions is overall negligible, these results verify that even though predictability is indeed lower than for integer benchmarks, the predictability of floating-point instructions is still quite interesting.

Fig. 4.9 deals with coverage and accuracy for the different categories introduced in the beginning of the chapter. As seen in previous figures, the size of the hybrid does not influence much coverage and accuracy.

(33)

0 10 20 30 40 50 60 Small_FS-VTAGE QUL_FS-VTAGE

Percentage of Instrumented Instructions

Configuration Complementarity

TAGE only Stride only Both

Figure 4.7: Complementarity of different FS-VTAGE configurations for SPEC06FP.

0 10 20 30 40 50 60 70 80 90 100

Small_2level_T6 UL_2level_T6 Small_PS-PI_T3 QUL_PS-PI_T3 Small_FS-VTAGE QUL_FS-VTAGE

Percentage of Instrumented Instructions

Configuration Global Results

Correctly predicted Incorrectly predicted

Not predicted

Figure 4.8: Proportion of overall correct/incorrect predictions.

An interesting fact, however, is that even if accuracy is essentially similar between scalar and vector instruc-tions (slightly higher for vector instrucinstruc-tions), coverage for scalar FP is around 40% while it is around 60% for vector FP for 2-level + Stride, around 55% for PS-PI and around 50% for FS-VTAGE. A similar behavior can be observed for integer instructions. These numbers hint that both integer and FP instructions exhibit more value locality than their scalar counterparts. However, note that the Quasi-Unlimited PS-PI predictor

(34)

0 10 20 30 40 50 60 70 80 90 100

Small_2level_T6UL_2level_T6Small_PS-PI_T3QUL_PS-PI_T3Small_FS-VTAGEQUL_FS-VTAGESmall_2level_T6UL_2level_T6Small_PSPI_T3QUL_PS-PI_T3Small_FS-VTAGEQUL_FS-VTAGESmall_2level_T6UL_2level_T6Small_PS-PI_T3QUL_PS-PI_T3Small_SVTAGEQUL_FS-VTAGE

Percentage of Instrumented Instructions

Results by Instruction Category

Correct Incorrect Not Predicted INT_Vect FP_Vect FP_Scalar

Figure 4.9: Proportion of correct/incorrect predictions depending on their category. Global FP_Scalar FP_Vect INT_Vect Predictor Acc. Cov. Acc. Cov. Acc. Cov. Acc. Cov. Small 2-level + Str 89.3% 41.1% 88.2% 38.5% 94.5% 59.0% 94.7% 66.1% Small PS-PI 39.5% 39.5% 36.9% 36.9% 57.0% 57.0% 67.5% 67.5% Small FS-VTAGE 94.7% 39.6% 94.1% 37.4% 97.2% 52.4% 95.5% 51.1% UL 2-level + Str 89.5% 42.2% 88.4% 39.6% 94.7% 59.7% 94.6% 67.0% Quasi-UL PS-PI 39.4% 39.4% 38.2% 38.2% 46.3% 46.3% 34.5% 34.5% Quasi-UL FS-VTAGE 94.7% 40.9% 94.2% 38.6% 97.2% 54.3% 97.0% 52.4% Table 4.8: Accuracy and coverage summary for hybrid value predictors. Top: finite configurations, bottom: “infinite” configurations.

performs rather poorly on vector instructions. No explanation immediately comes to mind to explain this be-havior, except maybe an error in our implementation (even though there is no issue for integer and scalar FP). As a conclusion, we can state that first, the predictability of floating-point instructions is real but it is lower than that of integer instructions, and second, vector instructions appear more predictable than their scalar equivalents, even though they often represent less instructions in total. Therefore, Value Prediction does not need to be limited to general-purpose integer workloads as it appears able to accelerate every type of computation. Also, the addition of a value predictor specialized in floating-point instructions such as the SEF predictor [5] (see 1.2.1) may yield better results, even if in our opinion, it requires some modifications to be worth the investment. As a remark, using another compiler (such as Intel icc) may generate executa-bles containing more vectorized code. Consequently, one could demonstrate if the predictability of vector instructions is general to all of them or only to a subset.

Figure

Figure 1.4: 2-level FCM predictor. From [26]
Figure 1.5: Per-path Stride Predictors. From [14].
Figure 1.7: Per-Path Stride Previous-Instruction Hybrid Value Predictor. From [14].
Figure 1.8: TAGE and ITTAGE Geometric Length predictors.
+7

Références

Documents relatifs

Results: Using simulated data, we show that PCRR and PCIG models, using chromosome-wise SVD of a core sample of individuals, are appropriate for genomic prediction in a

In addition, based on the observation that the full range of floating point accuracy may not be always needed, we propose and implement an initial design of the tolerance value

Analyse formelle de concepts et règles d’association pour la gestion de contexte dans des

We present an historical review on radio observations of comets, focusing on the results from our group, and including recent observations with the Nançay radio telescope, the

[1] addresses two main issues: the links between belowground and aboveground plant traits and the links between plant strategies (as defined by these traits) and the

When equality is predicted with high confidence, if no other occurrence is present in the window of in-flight instructions, then the last committed value read on LCVT is used;

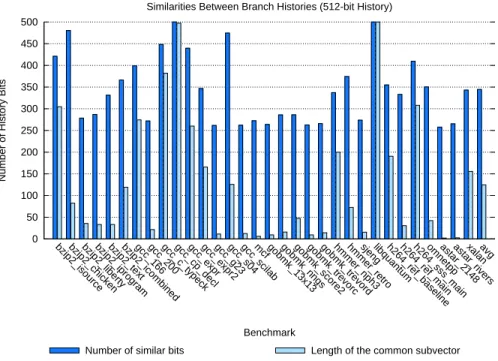
In this study we explore the performance limits of value prediction for small value predictors (8KB and 32KB) in the context of a processor assuming a large instruction win-

s evadent de la realite quotidienne. Au debut du XVIIeme siecle, s'impose egalement le gout pour le roman historique mauresque, tres marque par le realisme