The vacuum UV photoabsorption spectroscopy of the geminal ethylene
difluoride (1,1-C2H2F2). The vibrational structure and its analysis
R. Lochta, H.W. Jochimsb, B. Leyha
a Molecular Dynamics Laboratory, Department of Chemistry, Building B6c, University of Liège, Sart-Tilman, B-4000 Liège 1, Belgium b Institut für Physikalische und Theoretische Chemie, Freie Universität Berlin, Takustraβe 3, D-14195 Berlin, Germany
ABSTRACT
The vacuum UV photoabsorption spectrum of 1,1-C2H2F2 has been examined in detail between 6 eV and 25 eV photon energy by using synchrotron radiation. The broad band observed at 7.52 eV includes the π → π* and the 2b1 → 3s Rydberg transitions. An analysis is proposed and applied to the fine structure belonging to these transitions. For the π(2b1) → π* transition, one long vibrational progression is observed with ω2 = 1475 ± 80cm 1 combined with one quantum of vibration of ω4 = 976 ± 24cm 1 and its adiabatic excitation energy is determined at 6.742 eV. The 2b1 → 3s Rydberg transition is characterized by a single progression with ω2 = 1532 ± 80cm 1 starting at 6.957 eV. These vibrations are ascribed to the C=C and C-F stretching motions respectively. The abundant structure observed between 8.2 eV and 11.2 eV has been analyzed in terms of vibronic transitions to ns (δ = 0.98) and two different np (δ = 0.50 and 0.31) and nd (δ = 0.13 and 0.044) Rydberg series all converging to the 1,1-C2H2F2+(X;2B1) ionic ground state. An analysis of the associated vibrational structure of the individual Rydberg states has been attempted providing average values of the wavenumbers ω2 = 1549 ± 16 cm 1, ω4 = 839 ± 40 cm 1 and ω5 = 589 ± 16 cm 1. Eight other Rydberg states were also analyzed. The vacuum UV spectrum of 1,1-C2H2F2 has been recorded for the first time above 11.2 eV and up to 25 eV. Several broad and strong bands are tentatively assigned to transitions to Rydberg states which are members of Rydberg series converging to excited ionic states of 1,1-C2H2F2. For several of these Rydberg states vibrational structures are observed and assignments are proposed.
Keywords : Vacuum UV photoabsorption spectroscopy ; Synchrotron radiation ; 1,1-C2H2F2 ; Valence
transitions ; Rydberg transitions ; Vibrational structure
1. Introduction
The energetic and structural characterization of the neutral as well as the ionic ground and excited states of ethylene and its halogenated derivatives are of considerable interest for understanding the photochemistry of this extremely important class of compounds involved in many fields of pure and applied chemistry. Furthermore, another and more fundamental motivation of such a work is the systematic investigation of the influence of the position and nature of the substituent on the ionization and dissociation dynamics of the molecular ions. The systematic study of ethylene and of several of its halogen substituted derivatives has been initiated or is in progress using vacuum UV photoabsorption and photoelectron spectroscopies [1-3].
The vacuum UV photoabsorption spectroscopic data reported on 1,1-C2H2F2 are very scarce in the literature. To the best of our knowledge, the earliest vacuum UV photoabsorption work on the 1,1-C2H2F2 molecule has been reported by Bélanger and Sandorfy [4] together with five other fluorine substituted ethylenes. This study was restricted to the 50,000-87,100 cm-1 (6.2-10.8 eV) spectral region. A classification of the transitions and a vibrational analysis has been proposed.
Dauber and Brith [5] investigated the electronic spectrum of halogen derivatives of ethylene in the vacuum UV region of 150-250 nm (8.26-4.96 eV) in the gas, solid phase and Kr matrix. The existence of π → π*, π → σ* and Rydberg transitions were discussed. However, these authors put the emphasis of their discussion on the chlorine derivatives.
Reinke et al. [6] measured the low resolution photoabsorption spectrum and the dissociative photoionization of 1,1-C2H2F2 in the vacuum UV range of 10-21 eV using synchrotron radiation. The authors
made a comparison between photoabsorption and the ionization efficiencies of the molecular ion and of the fragment ions, and the photoelectron spectrum is highlighted, too.
The latest detailed photoabsorption work devoted to this molecule has been reported by Limao-Vieira et al. [7]. These authors measured the vacuum UV photoabsorption spectrum of difluorochloromethane (CHClF2) and of geminal difluoroethylene (1,1-C2H2F2) in the same photon energy range (10.8-6.2 eV, 115-200 nm) using synchrotron radiation. Absolute cross-sections were measured. The observed features were classified and assigned to valence → valence (π → π*) and to valence → Rydberg (ns-, np- and nd-) transitions. A vibrational analysis and assignments of these transitions were presented.
The valence-shell electron energy spectroscopy (VSEES) technique is closely related to vacuum UV photoabsorption spectroscopy. The only work using this technique has been reported by Coggiola et al. [8]. The electron energy spectra of seven fluoroethylene derivatives were reported in the 4.5-16.0 eV electron energy range. At low energy singlet-singlet (N → V) as well as singlet-triplet (N → T) transitions have been observed.
Recently, ab initio quantum mechanical calculations have been carried out on 1,1-C2H2F2 to investigate the neutral excited-state energy surfaces. Excitation energies were calculated at the SACCI (symmetry-adapted cluster configuration interaction) level [9] and compared with the experiment. Several low-lying triplet excited states were also studied. CASSCF (complete active space self-consistent field) calculations corrected with second order perturbation theory (CASPT2) have been used to characterize the valence and 3s and 3p Rydberg states [10]. Furthermore, the existence of several conical intersections has been demonstrated for different geometries.
The ionization and dissociative photoionization dynamics of 1,1-C2H2F2 have already been investigated in this laboratory by photoelectron spectroscopies (PES) [3], threshold photoelectron-photoion coincidence spectroscopy (TPEPICO) [11] and photoionization mass spectrometric ion translational energy analysis by the maximum entropy method (MEM) [12].
To complete the work on this molecular system, the aim of this paper is to report the vacuum UV photoabsorption spectrum of 1,1-C2H2F2 (i) for the first time in the 10.5-25 eV photon energy range at medium resolution and (ii) in the 6.0-11.2 eV spectral region at higher resolution. The vibrational structure observed in both regions will be analyzed in detail.
2. Experimental 2.1. Experimental setup
The experimental setup used in this work has already been described in detail elsewhere [13]. Only the most salient features will be reported here.
Synchrotron radiation available from the BESSY I facility (Berlin, Germany) was dispersed with a modified vacuum UV normal incidence 225 McPherson monochromator with a focal length of 1.5 m, instead of 1 m in the commercial version (1m-NIM-2 beam line). A laminar Zeiss grating is used for the efficient reduction of the 2nd spectral order. It is gold coated with 1200 lines mm-1 and its transmission breaks down above 26 eV (210,000 cm-1 or 48 nm). The width of the entrance and exit slits of 100 µm ensures a 0.1 nm wavelength resolution corresponding to a resolving power of about 1200 at 10 eV. This monochromator has been used for the recording of low-resolution absolute photoabsorption spectra in the 5-25 eV photon energy range. Its grating is most well suited for recording spectra above the 16 eV photon energy range.
The 3m-NIM-2 beam line at the BESSY II facility (Berlin, Germany) has been described by Reichardt et al. [14]. This 3m-NIM monochromator is positioned at a bending magnet frontend. It is equipped with two spherical gratings, i.e., an Al/MgF2-grating of 600 lines mm-1 and a Pt-grating of 2400 lines mm-1. The entrance and exit slits were adjusted between 10 µm and 40 µm leading to a resolving power of about 25,000 to 13,000 at 10 eV (124 nm) photon energy. This monochromator was used for recording high resolution spectra in the low photon energy range between 6 eV and 16 eV. Most of the spectra discussed in the present work were measured with 40 µm entrance and 10 µm exit slits and using the 600 l/mm Al/MgF2-grating.
In all above described setups, the light has to pass through a 1 mm thick stainless steel microchannel plate at the exit slit of the monochromator in order to maintain a differential pressure of 1:1000 before entering a 30 cm long stainless steel absorption cell. The vapor pressure in the cell is measured by a Balzers capacitor
manometer. The light is detected by a sodium salicylate sensitized photomultiplier located at the end of the absorption cell in front of the absorption cell entrance slit. Output pulses are recorded by a 100 MHz counter. The recording of an absorption spectrum requires one scan with gas in the absorption cell and one with the evacuated cell. The stability of the synchrotron radiation and of the pressure in the cell ensured reliable absorption data. If necessary, the spectra presented in the following sections are corrected for any pressure drift.
We recently reported on the threshold photoelectron spectroscopy of 1,1-C2H2F2 [3] using a second 3m-NIM monochromator equipped with a Pt grating of 2400 lines mm-1. The threshold photoelectron current had to be normalized to the monochromator transmission function. For this purpose the photoelectron current generated by a gold diode located in front of the exit slit is measured. This latter signal can be normalized to the diode current measured with the evacuated ionization chamber. As a result, a log10[I0/I]-curve as a function of the photon energy, that is, a non-calibrated photoabsorption spectrum recorded with a non-calibrated detector is obtained. These kinds of experiments have been described earlier [2] and will be referred to in Section 3. In this curve, below 12 eV, the diode signal has to be assigned to the photoionization of Au. The photoelectron spectrum of gas phase Au shows, above the threshold at 9.22 eV, doublets at 11.1-11.4 eV and at 12.6-12.9 eV corresponding to the 3D and 1D states of Au+ [15]. In the solid state, the latter is likely hidden in the broad band at 12.14 eV corresponding to an absorption band of C2H2F2 and the former gives a broadened band near 11.19 eV. No signal due to Au has been reported above 13 eV.
The sample pressure has been maintained at 35-38 µbar to avoid saturation. The commercially available 1,1-C2H2F2, purchased from Fluochem Ltd. and of 99.5% purity, was used without further purification.
2.2. Data handling and error estimation
As will be mentioned in the next sections, weak sharp peaks and diffuse structures are often superimposed on a strong continuum. To make the characterization of these features easier, a continuum subtraction procedure has been applied. This method has already been used successfully in previous spectral analyses [16]. For this purpose, the experimental curve is strongly smoothed to simulate the underlying continuum which is then subtracted from the original photoabsorption spectrum. The smoothing procedure consists in filtering the experimental curve by fast Fourier transform (FFT). The weak features emerge from a remaining strongly attenuated background. The resulting diagram will be called ∆-plot in the forthcoming sections. To verify that no weak structure has been removed by this operation, the same procedure is applied to the subtracted continuum. The result is a signal oscillating about zero with amplitudes of about two orders of magnitude or even lower than the signal resulting from the first operation. This has been demonstrated by Marmet [17] and Carbonneau [18].
The wavelength calibration of the 1.5m-NIM monochromator has been performed by using the Ar absorption spectrum between the 2P3/2 and the 2P1/2 ionic states. The accuracy of this calibration is better than 2 meV. In the measurements between 10 eV and 25 eV photon energy, the photoabsorption spectrum has been recorded with an energy interval of about 4 meV. The error on the energy position of a feature is estimated to be 6 meV. In the photoabsorption spectra between 5 eV and 11 eV, an energy increment of 1 meV has been adopted. The error on the energy position of a feature is estimated to be of the order of 3 meV. This evaluation is confirmed by the reproducibility of energy positions measured in different spectra recorded over several years.
3. Experimental results
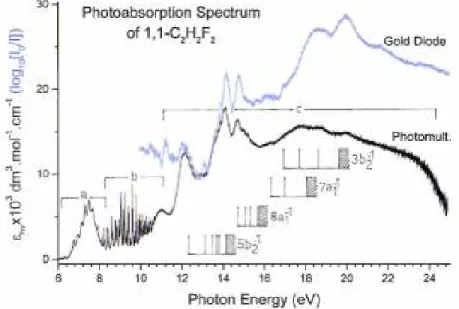
The vacuum UV photoabsorption spectrum (PAS) of 1,1-C2H2F2 as measured between 5 eV and 25 eV photon energy is shown in Fig. 1. The good control of the experimental parameters allows us to display the spectrum in terms of the molecular extinction coefficient εhv as a function of the photon energy (eV). For
comparison above 10 eV, the gold diode signal (see discussion in Section 2.1) as normalized to the 13 eV extinction coefficient and measured with the 3 m-NIM monochromator at the BESSY I facility is also displayed. As clearly observed in this figure the transmission of the gold plated grating rapidly decreases above 22 eV giving rise to a rapid degradation of the signal-to-noise ratio. For clarity in the following discussion and as represented in Fig. 1 the PAS will be divided into three parts.
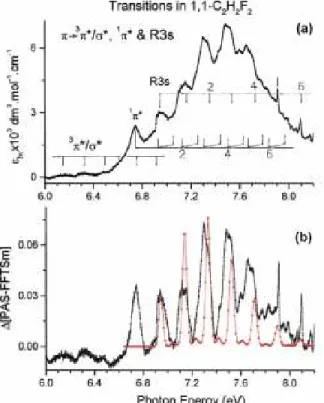
(a) The low-energy part extending between 6 eV and 8.2 eV corresponds to a single broad structured peak and it is reproduced in Fig. 2(a). The energy increment is of 1 meV. Vertical bars locate the structures and their energy positions are gathered in Table 1. Fig. 2(b) shows the result of the treatment of the peak by the subtraction method (see Section 2.2). For discussion purposes, the shifted HeI photoelectron spectrum (PES) of the first photoelectron band of 1,1-C2H2F2 [3] is superimposed on this ∆-plot.
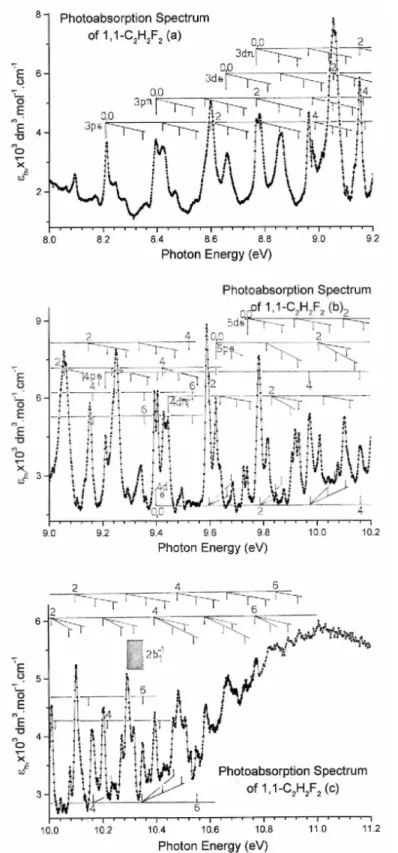
(b) The crowded PAS region between 8.2 eV and 11.2 eV consists of numerous sharp and strong to very weak peaks. This part of the PAS is represented in Fig. 3(a)-(c) on an expanded photon energy scale and the energy increment is 1 meV. The photoabsorption spectrum in this energy range is represented in terms of the extinction coefficient: owing to the intensity and sharpness of the features, the subtraction procedure was not really necessary here and has therefore not been applied. Vertical bars indicate the energy position of the observed features and these are gathered into different groups corresponding to vibrational progressions as listed in Table 2. The Rydberg series analysis of this energy region is shown in Table 3. To avoid overcrowding the Rydberg series have not been represented in Fig. 3.
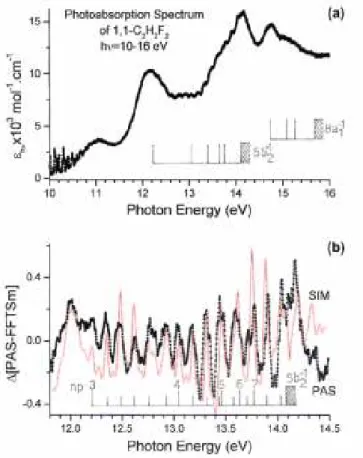
(c) A wide photon energy region extending between 11 eV and 25 eV consists mainly of several broad and structureless bands and a few vibrational structures. A part of this area, recorded with 2 meV increments, is reproduced in Fig. 4 (a). In Table 4 we list the energy position of the structures observed in this energy range.
Fig. 4(b) shows the ∆-plot resulting from the subtraction method applied to this region of the PAS. A tentative simulated spectrum has been superimposed to this plot. Owing to the weakness and the diffuseness of the structures observed in the photon energy range of 12-14 eV, this spectral region has been recorded several times over several years under various experimental conditions. The energy positions and the relative intensities are very reproducible. Obviously, the energy position of these structures is easier to measure in such a diagram.
Fig. 1. VUV photoabsorption spectrum (black) of 1,1-C2H2F2 between 6 eV and 25 eV photon energy. Horizontal bars (a), (b) and (c) indicate the three energy ranges analyzed in this work. The high energy part of the photoabsorption spectrum (blue) as measured using a gold diode as a light detector is included. This latter signal has been normalized to the extinction at 13 eV photon energy. Vertical bars and shaded areas locate Rydberg states and their convergence limit (or ionization continua). (For interpretation of the references to color in this figure legend, the reader is referred to the web version of this article.)
4. Discussion of the experimental data
The molecular orbital configuration of 1,1-C2H2F2 in the C2v symmetry group is described by
F(1b22 1a12) - C(2a12 3a12) 4a12 2b22 5a12 6a12 3b22 1b12 7a12 1a22 4b
22 8a12 5b22 2b12: X;1 A1
where the 4a1 and 2b2 are the inner-valence shell orbitals on F, the other orbitals being outer-valence shell orbitals. The 2b1 MO has a predominant π character.
We measured the high resolution Hel-PES and threshold photoelectron spectra (TPES) of 1,1-C2H2F2 and the results have been reported recently [3]. The first adiabatic ionization energy IEad(1,1-C2H2F2+,X;2B1) is equal to (10.298 ± 0.001) eV. The corresponding vertical value IEvert(1,1-C2H2F2+,X;2B1) is equal to (10.688 ± 0.001) eV. These values are in very good agreement with earlier determinations as discussed in a recent report [3].
At higher energies four bands are observed by Hel-PES and were characterized by their vertical ionization energies at 14.810 eV, 15.716 eV, 18.157 eV and 19.820 eV [3]. In the TPES measured between 10 eV and 30 eV two maxima are observed at energies above the 21.22 eV limit [3], i.e. at 21.398 eV and 24.05 eV successively.
4.1. The valence and 3s Rydberg transitions (see Figs. 2 and 5)
This photon energy range is represented in Fig. 1 by range (a).
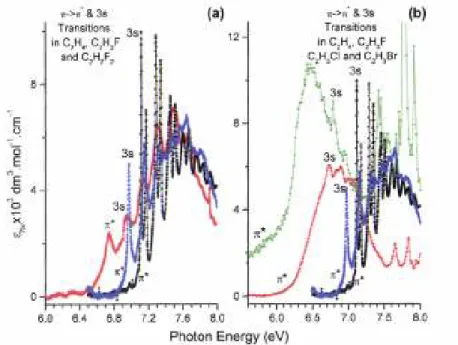
The typical ethylenic broad band is observed in 1,1-C2H2F2 with a maximum at 7.52 eV. Contrary to the observations made in the PAS of C2H4 and C2H3F [1], the vibrational structure consists essentially of broad but structured peaks. Only the first broad peak at 6.742 eV seems to be structureless and on the high energy side of the major band two weak but sharp features appear, having the characteristic aspect of Rydberg transitions. The comparison of the same band in three different related compounds, i.e. C2H4, C2H3F [1] and 1,1-C2H2F2, as investigated in the present work, is very informative as shown in Fig. 5(a) where the different contributions of valence and Rydberg transitions have been included.
Fig. 2. VUV photoabsorption spectrum of 1,1-C2H2F2 between 6 eV and 8.2 eV photon energy: (a) molecular extinction coefficient εhv; vertical bars show the valence (V) π(2b1) → ν(1π*, 3π*) and the transitions to the 3s Rydberg series. Only the even quanta v are indicated, (b) ∆-plot as a function of the photon energy (eV); the first band of the HeI-PES of 1,1-C2H2F2 is inserted.
Comparing the three compounds, the measurement of the peak maximum is not very significant because of the important changes of the fine structure in each band. More valuable is the measured or estimated adiabatic excitation energy. As shown in Fig. 5(b) the π → 3s Rydberg transition shows a red shift when the substituting halogen atom becomes heavier, i.e. in the order H > F > Cl > Br as resulting from our previous investigations
Fig. 3. VUV photoabsorption spectrum of 1,1-C2H2F2 on an expanded photon energy scale between 8.0 eV and 11.2 eV: (a) from 8.0 eV to 9.2 eV, (b) from 9.0 eV to 10.2 eV and (c) 10.0 eV to 11.2 eV. Long vertical bars indicate the vibrationless (0,0) transitions of the indicated Rydberg transitions. For each transition, the vibrational progression(s) are drawn using short vertical bars and only the even quanta v are marked. The shaded area corresponds to the convergence limit at the first adiabatic ionization energy of 1,1-C2H2F2 at 10.298 eV [3].
Fig. 4. VUV photoabsorption spectrum of 1,1-C2H2F2 on an expanded photon energy scale between 10.0 eV and 16.0 eV (a) showing the weak vibrational structures, (b) corresponding ∆-plot (PAS) between 11.8 eV and 14.5 eV showing the detail of the vibrational structure. The simulated (SIM) spectrum is also displayed and the vibrational analysis is indicated by vertical bars.
[1,13,20]. As shown in the same figure the π → π*(V) transition exhibits a much larger red shift. Owing to the resulting smaller overlap of the π*(V) and the 3sR states, the Valence-to-Rydberg interaction invoked for the interpretation of the 7.6 eV peak in C2H4 is expected to decrease following the same sequence.
With these observations and considering the first peak at 6.742 eV in the 7.52 eV band in 1,1-C2H2F2, we assigned it to the adiabatic excitation energy of the π(2b1) → π*(V) transition. This assignment fits in the trend of the red shift of the adiabatic excitation energy of the π → π*(V) transition by increasing the number of identical substituting atoms C2H4 > C2H3F > 1,1-C2H2F2 (see Fig. 5(a)). Table 1 and Fig. 2 show the vibrational analysis of the excited π*(V) state. Essentially one vibrational progression is detected with hcω1 = 183 ± 10
meV (1475 ± 80 cm-1). This vibration is combined with one quantum of a vibrational mode with hcω2 = 121 ± 3 meV (976 ± 24 cm-1).
In order to assign these two energies to clearly identified vibrational modes of the excited molecule, we have to compare them with those observed for the ground states of the neutral [21] and the cation [3]. As a result, three wavenumbers have to be considered: 1730 cm-1, 1354 cm-1 and 916 cm-1 in the case of the neutral molecule and 1573 cm-1, 1438 cm-1 and 895 cm-1 in the cation and corresponding for both species to v2(C=C stretching), v3(H-C-H bending) and v4(C-F and C=C stretching). Considering the MO involved in the excitation, the wavenumber of 1475 ± 80 cm-1 is assigned to v2 whereas 976 ± 24 cm-1 could unambiguously be assigned to v4 on the basis of the same argument. The assignments are listed in Table 1.
The two weak but sharp structures at 7.909 eV and 8.095 eV located at the end of the vibrational progression of the (2b1)1(π*)1 state appear as typical Rydberg transitions. Their assignment to the 2b1 → 3p transition [4,7] is discarded. This type of transition is usually much stronger if not one of the strongest transitions in the vacuum UV-PAS. As already suggested earlier [2], it can reasonably be assumed that the geometry of states belonging to a given Rydberg series is close to that of the cationic state to which it converges. This implies that its vibrational structure is expected to be close to that of the cation. This similarity could be helpful to
disentangle the vibrational fine structure belonging to the π(2b1)→3s transition. To make the comparison easier the ∆-plot of the appropriate PAS energy range will be compared to the HeI-PES of the 1,1-C2H2F2+(X;2B1) state as measured in our laboratory [3]. The result is shown in Fig. 2(b) which not only enhances the weak structures but also the structures in each separate peak. Obviously the first peak is structureless.
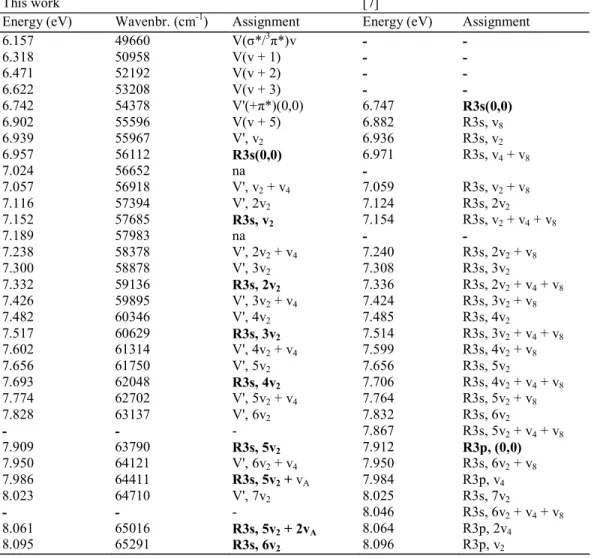
Table 1 Energy position (eV), wavenumber (cm-1) and assignments proposed for the vibrational structure
observed in the vacuum UV photoabsorption spectrum of 1,1-C2H2F2 between 6.0 eV and 8.2 eV. Comparison is made with the results and assignments of [7] (1 eV = 8 065.545 cm-1 [19]).
This work [7]
Energy (eV) Wavenbr. (cm-1) Assignment Energy (eV) Assignment
6.157 49660 V(σ*/3π*)v - - 6.318 50958 V(v + 1) - - 6.471 52192 V(v + 2) - - 6.622 53208 V(v + 3) - - 6.742 54378 V'(+π*)(0,0) 6.747 R3s(0,0) 6.902 55596 V(v + 5) 6.882 R3s, v8 6.939 55967 V', v2 6.936 R3s, v2 6.957 56112 R3s(0,0) 6.971 R3s, v4 + v8 7.024 56652 na - 7.057 56918 V', v2 + v4 7.059 R3s, v2 + v8 7.116 57394 V', 2v2 7.124 R3s, 2v2 7.152 57685 R3s, v2 7.154 R3s, v2 + v4 + v8 7.189 57983 na - - 7.238 58378 V', 2v2 + v4 7.240 R3s, 2v2 + v8 7.300 58878 V', 3v2 7.308 R3s, 3v2 7.332 59136 R3s, 2v2 7.336 R3s, 2v2 + v4 + v8 7.426 59895 V', 3v2 + v4 7.424 R3s, 3v2 + v8 7.482 60346 V', 4v2 7.485 R3s, 4v2 7.517 60629 R3s, 3v2 7.514 R3s, 3v2 + v4 + v8 7.602 61314 V', 4v2 + v4 7.599 R3s, 4v2 + v8 7.656 61750 V', 5v2 7.656 R3s, 5v2 7.693 62048 R3s, 4v2 7.706 R3s, 4v2 + v4 + v8 7.774 62702 V', 5v2 + v4 7.764 R3s, 5v2 + v8 7.828 63137 V', 6v2 7.832 R3s, 6v2 - - - 7.867 R3s, 5v2 + v4 + v8 7.909 63790 R3s, 5v2 7.912 R3p, (0,0) 7.950 64121 V', 6v2 + v4 7.950 R3s, 6v2 + v8 7.986 64411 R3s, 5v2 + vA 7.984 R3p, v4 8.023 64710 V', 7v2 8.025 R3s, 7v2 - - - 8.046 R3s, 6v2 + v4 + v8 8.061 65016 R3s, 5v2 + 2vA 8.064 R3p, 2v4 8.095 65291 R3s, 6v2 8.096 R3p, v2
Beside the π → π* transition and its vibrational excitation, obviously another vibrational progression is present in the 7.52 eV band. Fitting the Hel-PES on the last narrow peaks, the result of this comparison is displayed in Fig. 2(b). The position in energy of the structures is drawn in Fig. 2(a) and the values are listed in Table 1. From this procedure an adiabatic excitation energy EEad = 6.957 eV is deduced and assigned to the 3s Rydberg transition, instead of the value 6.747 eV reported previously [4,7]. The energy onset at 6.742 eV measured in the present work is assigned to the EEad(π*) state. Furthermore, the major vibrational progression in the Rydberg transition is characterized by a wavenumber ω2 = 1532 ± 80 cm-1 (190 ± 10 meV) which is assigned to the C=C, C-F stretching vibration [3]. As shown in Fig. 2 and in Table 1 in the last part of the band a few very weak structures could be ascribed to a smaller wavenumber ωA ≈ 605 cm-1 (75 meV) which is compatible with the v5 vibration characterized by ω5 = 532 ± 56 cm-1 [3] in the cation and 544 cm-1 [21] in the neutral molecule. The increase of v2 from 1475 cm-1 in the π* state to 1532 cm-1 in the 3s-Rydberg state is related to the transition to an antibonding π* MO and to a virtual 3s MO respectively.
spectrum as reported by Limao-Vieira et al. [7], even though the signal-to-noise ratio is comparable. Different experimental conditions, in particular a lower transmission of the monochromator in this energy range, could account for this discrepancy. It should be emphasized that corresponding bands appear also with increasing intensity and blue shifted in other ethylene derivatives [22]. Furthermore, to the best of our knowledge Dauber and Brith [5] and Coggiola et al. [8] are the only previous works reporting about absorption of 1,1-C2H2F2 below 6.0 eV. Only the latter group clearly showed the existence, by electron energy loss spectroscopy, of an absorption band at 4.63 eV extending from 3.8 eV to 6.5 eV. It was assigned to a π (2b1) → 3π*(T) transition. A fine structure could be observed (see Fig. 5(a) in Ref. [8]) but has not been mentioned or discussed by the authors. Though forbidden, but owing to its very low intensity as observed in this work, such a transition could be involved between 6.157 eV and 6.902 eV. However, an alternative assignment would be a π → σ* transition as observed [23] and predicted [24] in the C2H2Cl2 isomers in about the same energy range.
As shown in Table 1, starting at 6.157 eV and up to 6.902 eV, five peaks are detected with a decreasing interval of about 161 meV to 144 meV They could very likely be assigned to the v3 H-C-H bending normal mode which has a wavenumber of 1354 cm-1 (168 meV) in the neutral molecule [21] and is not detected in the cation [3]. From the present data, this vibrational motion appears to be fairly anharmonic.
Valence (V)-Rydberg (R) mixing is expected between the π* and the 3s states. However, the two types of structures showing up in Fig. 2 differ clearly by their respective widths and intensities. This is particularly obvious for the vibrational structures at 7.909 eV and at 8.095 eV. As in the case of the corresponding transition in C2H3F at 7.6 eV [1], we suggest that V/R mixing is in this case also (or even more) limited so that a usual vibrational analysis is possible. In other words, the expansions of the mixed states on the basis of the pure V and R states are each dominated by a leading term so that it is reasonable to speak about a "Rydberg-like" and a "Valence π*-like" state.
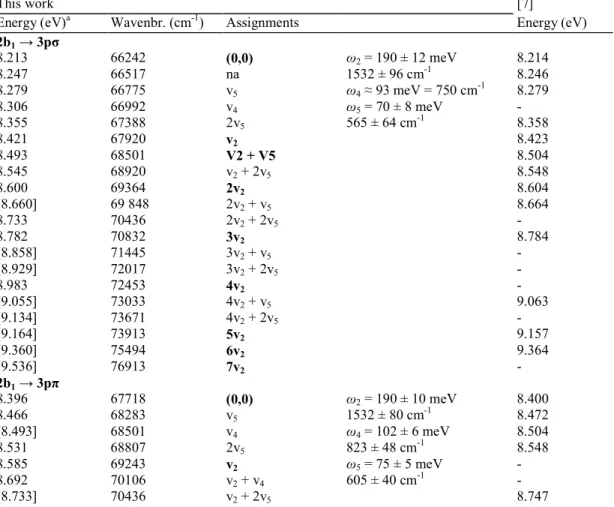
Table 2 Energy position (eV), corresponding wavenumber (cm-1) and assignments proposed in the present work for the structures detected in the vacuum UV photoabsorption spectrum of 1,1-C2H2F2. In the fourth column the averaged value of the energy and wavenumber associated with each proposed vibrational mode is indicated. Comparison is made only with the results of Ref. [7]. Conversion factor 1 eV = 8 065.545 eV [19].
This work [7]
Energy (eV)a Wavenbr. (cm-1) Assignments Energy (eV)
2b1 → 3pσ 8.213 66242 (0,0) ω2 = 190 ± 12 meV 8.214 8.247 66517 na 1532 ± 96 cm-1 8.246 8.279 66775 v5 ω4 ≈ 93 meV = 750 cm-1 8.279 8.306 66992 v4 ω5 = 70 ± 8 meV - 8.355 67388 2v5 565 ± 64 cm-1 8.358 8.421 67920 v2 8.423 8.493 68501 V2 + V5 8.504 8.545 68920 v2 + 2v5 8.548 8.600 69364 2v2 8.604 [8.660] 69 848 2v2 + v5 8.664 8.733 70436 2v2 + 2v5 - 8.782 70832 3v2 8.784 [8.858] 71445 3v2 + v5 - [8.929] 72017 3v2 + 2v5 - 8.983 72453 4v2 - [9.055] 73033 4v2 + v5 9.063 [9.134] 73671 4v2 + 2v5 - [9.164] 73913 5v2 9.157 [9.360] 75494 6v2 9.364 [9.536] 76913 7v2 - 2b1 → 3pπ 8.396 67718 (0,0) ω2 = 190 ± 10 meV 8.400 8.466 68283 v5 1532 ± 80 cm-1 8.472 [8.493] 68501 v4 ω4 = 102 ± 6 meV 8.504 8.531 68807 2v5 823 ± 48 cm-1 8.548 8.585 69243 v2 ω5 = 75 ± 5 meV - 8.692 70106 v2 + v4 605 ± 40 cm-1 - [8.733] 70436 v2 + 2v5 8.747
[8.769] 70727 2v2 - 8.865 71501 2v +v4 - [8.929] 72017 2v2 + 2v5 - 8.975 72388 3v2 8.965 [9.055] 73033 3v2 + v5 - 9.083 73299 3v +v4 - [9.134] 73671 3v2 + 2v5 - [9.164] 73913 4v2 9.157 [9.360] 75494 5v2 9.364 [9.536] 76913 6v2 9.534 2b1 → 3dσ [8.660] 69848 (0,0) ω2 = 191 ± 9 meV 8.664 [8.733] 70436 v5 1541 ±72 cm-1 8.747 8.819 71130 2v5 ω5 = 72 ± 9 meV - [8.858] 71445 v2 581 ± 72 cm -1 8.866 [8.929] 72017 v2 + v5 - 9.013 72695 v2 + 2v5 - 9.055 73034 2v2 9.063 [9.134] 73671 2v2 + v5 - 9.194 74155 2v2 + 2v5 - 9.249 74598 3v2 9.256 9.317 75147 3v2 + v5 9.329 9.393 75760 3v2 + 2v5 - 9.425 76018 4v2 - 9.494 76574 4v2 + v5 9.497 9.568 77171 4v2 + 2v5 - 9.621 77599 5v2 - 9.684 78107 5v2 + v5 9.690 2b1 → 3dπ [8.769] 70727 (0,0) ω2 = 192 ± 2 meV - [8.858] 71445 v5 1549 ±16 cm-1 8.866 [8.929] 72017 2v5 ω5 = 74 ± 8 meV - 8.963 72291 v2 597 ± 64 cm -1 8.965 9.044 72945 v2 + v5 9.030 9.104 73429 v2 + 2v5 - 9.152 73816 2v2 9.157 9.227 74421 2v2 + v5 9.215 9.292 74945 2v2 + 2v5 9.298 9.344 75364 3v2 9.347 9.416 75945 3v2 + v5 9.410 [9.494] 76574 3v2 + 2v5 - 9.536 76913 4v2 9.534 9.612 77526 4v5 + v5 - [9.684] 78107 4v2 + 2v5 9.690 2b1 → 4pσ 9.210 74284 (0,0) ω2 = 190 ± 4 meV 9.215 9.272 74784 v5 1532 ± 32 cm-1 - 9.317 75147 v4 ω4 = 102 ± 7 meV - [9.360] 75494 2v5 823 ± 56 cm-1 9.364 9.405 75856 v2 ω5 = 73 ± 9 meV 9.400 9.480 76461 v2 + v5 589 ± 72 cm-1 - [9.513] 76728 v2 + v4 - 9.554 77058 v2 + 2v5 - 9.598 77413 2v2 - 9.670 77994 2v2 + v5 9.690 9.707 78292 2v2 + v4 - 9.750 78639 2v2 + 2v5 9.743 [9.783] 78905 3v2 9.786 [9.846] 79413 3v2 + v5 9.852 [9.876] 79655 3v2 + v4 -
[9.932] 80107 3v2 + 2v5 9.939 9.972 80430 4v2 9.979 [10.041] 80986 4v2 + v5 10.047/ 10.060 10.077 81276 4v2 + v4 10.084 [10.122] 81639 4v2 + 2v5 10.129 10.159 81938 5v2 10.167 [10.235] 82551 5v2 + v5 10.242 10.302 83091 5v2 + 2v5 - 10.348 83462 6v2 10.358 10.405 83922 6v2 + v5 10.401 10.450 84285 6v2 + v4 - 2b1 → 4dσ 9.393 75760 (0,0) ω2 = 191 ± 5 meV - 9.459 76292 v5 1540 ± 40 cm-1 9.446 9.494 76575 v4 ω4 = 98 ± 3 meV - 9.536 76913 2v5 790 ± 24 cm-1 9.534 9.589 77341 v2 ω5 = 75 ±11 meV 9.596 9.649 77824 v2 + v5 605 ± 88 cm-1 9.643 [9.684] 78107 v2 + v4 - [9.739] 78550 v2 + 2v5 9.732 9.783 78905 2v2 9.786 9.846 79413 2v2 + v5 9.852 [9.876] 79655 2v2 + v4 - [9.932] 80107 2v2 + 2v5 9.939 9.978 80478 3v2 9.979 [10.041] 80986 3v2 + v5 10.047/ 10.060 [10.077] 81276 3v2 + v4 10.084 10.133 81728 3v2 + 2v5 - 10.164 81978 4v2 10.167 [10.235] 82551 4v2 + v5 10.242 10.265 82793 4v2 + v4 - 10.316 83204 4v2 + 2v5 - 10.350 83478 5v2 10.358 [10.416] 84011 5v2 + v5 10.401 [10.450] 84285 5v2 + v4 - 10.496 84656 5v2 + 2v5 10.489 2b1 → 4dπ 9.443 76163 (0,0) ω2 = 195 ± 4 meV 9.446 [9.513] 76728 v5 1611 ± 32 cm-1 9.638 77736 v2 ω4 = 102 ± 7 meV 9.643 9.707 78292 v2 + v5 843 ± 56 cm-1 - [9.783] 78905 v2 + 2v5 ω5 = 75 ± 8 meV 9.786 9.834 79317 2v2 605 ± 64 cm-1 - 9.907 79905 2v2 + v5 9.911 [9.932] 80107 2v2 + v4 9.939 10.022 80833 3v2 10.015 [10.122] 81639 3v2 + v4 10.129 10.179 82099 3v2 + 2v5 - 10.220 82430 4v2 10.209 10.293 83019 4v2 + v5 10.298 10.316 83204 4v2 + v4 10.319 10.372 83656 4v2 + 2v5 - [10.416] 84011 5v2 - 10.475 84487 5v2 + v5 10.472 10.529 84922 5v2 + v4 - 10.568 85237 5v2 + 2v5 - 2b1 → 5pσ 9.622 77607 (0,0) ω2 = 192 ± 3 meV 9.626 [9.684] 78107 v5 1549 ± 24 cm-1 -
9.817 79179 v2 ω4 = 111 ± 7 meV 9.821 9.956 80301 v2 + 2v5 895 ± 56 cm-1 - 10.010 80736 2v2 ω5 = 72 ± 9 meV 10.015 10.077 81276 2v2 + v5 581 ± 72 cm-1 10.084 [10.122] 81639 2v2 + v4 10.129 10.164 81978 2v2 + 2v5 10.167 10.200 82269 3v2 - 10.271 82841 3v2 + v5 10.276 10.302 83091 3v2 + v4 10.298 10.355 83519 3v2 + 2v5 10.358 10.394 83833 4v2 10.401 10.463 84390 4v2 + v5 10.472 10.508 84753 4v2 + v4 10.512 10.542 85027 4v2 + 2v5 10.547 10.584 85366 5v2 10.592 10.654 85930 5v2 + v5 - 10.692 86237 5v2 + v4 10.702 10.733 86567 5v2 + 2v5 - 10.772 86882 6v2 - 10.826 87318 6v2 + v5 - 10.894 87866 6v2 + v4 - 10.935 88197 (7v2) - 2b1 → 5dσ 9.724 78429 (0,0) ω2 = 188 ± 4 meV 9.732 [9.876] 79655 2v5 1516 ± 32 cm-1 - 9.918 79994 v2 ω4 = 110 ± 10 meV 9.911 10.000 80655 v2 + v5 887 ± 80 cm-1 - 10.054 81091 v2 + 2v5 ω5 = 74 ± 8 meV 10.060 10.102 81478 2v2 597 ± 64 cm -1 10.105 10.179 82099 2v2 + v5 - 10.204 82301 2v2 + v4 - 10.246 82640 2v2 + 2v5 - 10.290 82994 3v2 10.298 10.372 83656 3v2 + v5 - 10.399 83874 3v2 + v4 10.401 10.439 84196 3v2 + 2v5 10.432 10.482 84543 4v2 10.489 10.547 85067 4v2 + v5 10.547 10.607 85551 4v2 + v4 - 10.632 85753 4v2 + 2v5 - 10.669 86051 5v2 10.675 10.748 86688 5v2 + v5 10.744 10.772 86882 5v2 + v4 - 10.853 87535 6v2 - 11.006 88769 6v2 + 2v5 -
a Energy positions represented twice or more are given in square brackets.
As shown in Table 1, if the experimental results of the present work agree within the estimated error limits with those reported by Limao-Vieira et al. [7] their interpretation is quite different. These authors assigned the entire absorption band at 7.5 eV to the π(2b1) → π*(V) transition only. The vibrational structure [7] is assigned to a long v2 (C=C stretching) progression with an averaged wavenumber of 1476 ± 64 cm-1 (183 ± 8 meV) combined with either the v4 normal mode at 782 ± 48 cm-1 (97 ± 6 meV) or with a combination of v4 and
v8 with ω8 = 960 ± 64 cm-1 (119 ± 8 meV). The wavenumber of 1476 ± 64 cm-1 for v
2 [7] is in excellent agreement with the value at 1475 ± 80 cm-1 determined in the present work. Though the wavenumber of 960 ± 64 cm-1 [7] is in good agreement with 976 ± 24 cm-1 obtained in the present work, we assigned it to v4 instead of v8 [7] mainly for two convergent reasons: the
v4 mode (i) involves the C-F and C=C stretching as expected in a π(2b1) → π*(V) excitation and (ii) it is a totally symmetric (a1) mode whose excitation is allowed. Only those transitions involving even quantum numbers of the antisymmetric v8(b2) mode would be allowed. Furthermore, in the present work, no evidence is found for the
wavenumber at 782 ± 48 cm-1 but a few observations which can be related with a wavenumber of ω
A ≈ 605 cnr1 (75 meV) have been mentioned above and were assigned to v5 which has a1 symmetry.
Table 3 Rydberg series analysis of the vacuum UV photoabsorption spectrum of 1,1-C2H2F2. Energy position (eV), corresponding wavenumber (cm-1), effective quantum numbers (n*) and assignments proposed in this work. Comparison is made with the literature data [4,7]. Conversion factor 1 eV = 8065.545 eV [19].
This work [4] (cm-1) [7](eV)
eV cm-1 n* 2b1 → ns 6.957 55838 2.017 54348 6.747 8.799 70969 3.012 69930 8.784 9.455 76260 4.015 75821 9.446 9.750 78639 4.978 78585 9.786 9.932 80107 6.088 80064 9.939 - - - 80782 10.047 - - - 81334 10.105 - - - 81699 - 2b1 → npσ 8.213 66242 2.533 63776 7.912 9.210 72284 3.536 74344 9.157 9.622 77607 4.480 76670 9.626 9.846 79413 5.480 79397 9.852 9.973 80438 6.460 80483 9.979 - - - - 10.060 2b1 → npπ 8.396 67718 2.674 - - 9.295 74969 3.681 - - 9.685 78115 4.707 - - 9.877 79663 5.678 - - 9.997 80631 6.712 - - 10.068 81204 7.674 - - 2b1 → ndσ 8.660 69849 2.882 70786 8.604 9.393 75760 3.875 76249 9.400 9.724 78429 4.868 78505 9.732 9.907 79905 5.891 79981 9.911 10.009 80728 6.849 - 10.015 10.077 81276 7.829 - 10.084 - - - - - - - - - 10.167 2b1 → ndπ 8.769 70727 2.982 - 8.866 9.443 76163 3.987 - 9.497 9.739 78550 4.929 - - 9.918 79994 5.926 - -
4.2. The Rydberg transitions
As shown in Fig. 1 the high photon energy region ranging from 8.2 eV to 25.0 eV is clearly divided in two parts: (b) the low-energy range extending from 8.2 eV to 11.2 eV consisting of an abundant strong to weak very sharp fine structure (Fig. 3) and (c) the high-energy range spread from 11.2 eV to 25 eV made of fairly strong and broad bands with additional more or less regular fine structure (see Fig. 4).
The simplest model which can be tested to disentangle a complex spectrum as shown in Fig. 1, is to neglect the perturbations between Rydberg series, that is, to use the Rydberg formula (1) and fit it to the energy position ERyd of the features:
where the R is the Rydberg constant R = 13.606 eV [19], δ is the quantum defect, n* is the effective quantum number and IE is the ionization limit to which the considered Rydberg series converges.
The successive ionization energies IE to be used in this work have been defined earlier in this section and are inserted in Figs. 1, 3 and 4. The fine structure mostly observed in the low-energy part (b) of the spectrum will be assigned to vibrational excitation associated with the successive Rydberg series. Robin [25] made a critical and extensive review of the analyses of Rydberg transitions and proposed rules and guidelines for assignments.
4.2.1. Rydberg transitions between 8.2 eV and 11.2 eV (see Fig. 3(a)-(c))
This photon energy range is represented by the range (b) in Fig. 1 and could be directly compared to the spectral data of Limao-Vieira et al. [7] available on the website referred to in Ref. [20] with respect to the intensity and the spectral resolution.
4.2.1.1. Electronic transitions. The vibrationless Rydberg transitions observed for 1,1-C2H2F2 between 8.2 eV and 11.2 eV are partly shown in Fig. 3(a-c). To avoid overcrowding of this figure the higher terms of the various Rydberg series are not represented. Therefore, the Rydberg transitions observed in the present work have been listed in Table 3 together with their quantum defects. In the same table two previous data sets are included for comparison [4,7]. Their assignments have been reproduced implicitly. As mentioned earlier (see Section 2.2) the estimated error on the measurements in the present spectrum is about 2 meV or 16 cm-1. No error estimation is provided by Bélanger and Sandorfy [4] and by Limao-Vieira et al. [7]. For the assignments reported in the present work the adiabatic ionization energy value IEad(1,1-C2H2F2,XP2B1) = (10.298 ± 0.001) eV [3] has been used.
A first 2b1 → ns Rydberg series (corresponding to the nR series in [4]) is observed up to n = 7 with an average quantum defect δ = 0.98 ± 0.04. Bélanger and Sandorfy [4] reported δ = 0.90, using IEad = 10.300 eV as reported by Lake and Thompson [26], and observed the series up to n = 10. Limao-Vieira et al. [7] deduced a quantum defect δ = 0.94 ± 0.09 as based on the same value of the convergence limit. Between the previous works and present one the main difference is the assignment of the 2b1 → 3s transition and discussed in the last part of Section 4.1.
Following the long 3s Rydberg series progression, the first relatively strong transition is observed at 8.213 eV. It has been assigned to the 2b1 → 3p Rydberg transition with an effective quantum number n* = 2.533. On this basis a short series of Rydberg transitions has been observed up to n = 7 with an average quantum defect
δ = 0.50 ± 0.03 close to the characteristic "atomic" value for the p-type Rydberg orbital. This δ value can be
compared with the δ = 0.49 determined for the nR' series transitions observed by Bélanger and Sandorfy [4]. Limao-Vieira et al. [7] observed a series of Rydberg transitions assigned to 2b1 → npλ up to n = 8 with an averaged value δ = 0.58 ± 0.03. In this series only the energy position of the last three members agree within the error limits with those measured in the present work because we adopted 8.213 eV as the vibrationless 2b1 → 3p transition.
Starting at 8.396 eV a second series of Rydberg transitions has been observed which are characterized by an averaged quantum defect δ = 0.31(3) ± 0.01(6). The first member of this series has an effective quantum number n* = 2.674. These values would point at a p-character of the involved Rydberg orbital with expected δ value ranging from 0.4 to 0.6 [25,27]. As the core contains less orbitals with π symmetry than with σ symmetry, it is reasonable to expect that π Rydberg orbitals interact less with the ionic core and are therefore characterized by a smaller quantum defect. On the basis of this argument we assigned this series to 2b1 → nρπ whereas the lower energy series is ascribed to 2b1 → npσ Rydberg transitions. This series of Rydberg transitions have not been mentioned in previous studies of the vacuum UV spectrum of 1,1-C2H2F2. Such different p-type Rydberg transitions have been observed earlier in C2H3Br [13] and in the methyl monohalides CH3X (X= Cl, Br and I) [28].
At 8.660 eV a new Rydberg series starts and is characterized by n* = 2.882, i.e. by a low value of the quantum defect. This series is observed in this work up to n = 8 with an averaged quantum defect δ = 0.13 ± 0.02 which is a typical value for nd-type Rydberg transitions. This series should correspond to the nR" Rydberg
Table 4 Energy position (eV), corresponding wavenumber (cm-1) and assignments of the major features in the
vacuum UV photoabsorption spectrum of 1,1-C2H2F between 11.8 eV and 25 eV photon energy. Comparison is made with photoionization [6] and electron scattering [8] results. Conversion factor 1 eV = 8 065.545 eV [19].
This work Literature data (eV)
(eV)a (cm-1) Assignment [8] [6]
12.134- 97867- 12.2(3p)- 12.3-
14.178 114353 13.8(5s) 13.9
14.786/[14.75] 119257 8a1 → 4p (n* = 3.65) 14,2(6s) 14.3
15.062 121483 Vibrationally resolved structures 14.7(3s) 14.9
15.296/[15.33] 123370 8a1 → 6p (n* = 5.62) 16.31/[16.14] 131549 7a1→ 3s (n* = 2.83) 1.694/[16.97] 136630 [17.31] 17.69/[17.72] 142679 3b2 → 3p (n* = 2.61) 17.7 18.69/[18.35] 150745 3b2 → 4p (n* = 3.67) 18.4 20.25/[20.05] 163328 6a1 → 4p (n* = 3.45) 20.25 [21.7] [175022] [6a1-1] 23.7/[23.9] 191153 5a1 → 4s (n* = 3.01)
12.134-14.178 eV photon energy region
12.224 98593 5b2 → 3p: (0,0) n* = 2.69 12.274 98996 v5 12.350 99609 v3 12.456 100464 V3 + V5 12.484 100690 2v3 12.534 101093 2v3 + 2v5 12.634 101900 3v3 12.662 102126 2v3 + 3v5 12.694 102384 3v3 + v5 12.780 103078 4v3 12.826 103449 4v3 + v5 12.936 104336 5v3 12.982 104707 5v3 + v5 13.084 105530 6v3 13.048 105239 5b2 → 4p: (0,0) n* = 3.61 13.178 106288 v3 13.330 107514 2v3 13.490 108084 na 13.454 108514 5b2 → 5p: (0,0) n* = 4.64 13.606 109740 v3 13.728 110724 2v3 13.656 110143 5b2 → 6p: (0,0) n* = 5.57 (13.788)b 111208 v3 13.920 112272 2v3 (13.788)b 111208 5b 2 → 7p: (0,0) n* = 6.71 13.822 111482 na 13.844 111659 v5 13.892 112047 2v5 13.980 112756 na 14.050 113321 2v3 14.178 114353 3v3
15.07-15.70 eV photon energy region
15.07 121548 8a, → 5p (0,0) n* = 4.65
15.18 122435 v4
15.33 123645 3v4
15.58 128356 4v4
15.68 126306 5v4
na: not assigned.
a Positions in square brackets are measured in the "gold diode" photoabsorption spectrum: for explanation see text. b Value in parentheses: at
transitions in the work of Bélanger and Sandorfy [4] who reported a quantum defect δ = 0.2 and observed the series up to n = 6.
Limao-Vieira et al. [7] mention two nd-type Rydberg transitions. The ndπ series starts at 8.604 eV and is observed up to n = 10 whereas an ndδ-type Rydberg series starts at 8.866 eV and is observed up to n = 4. For the former an averaged quantum defect δ = 0.20 ± 0.05 whereas for the latter an averaged δ ≈ -0.08 are reported [7]. In the present work clearly a Rydberg series is starting at 8.769 eV. Members of this nd series are observed up to n = 6 with an averaged quantum defect δ = 0.044 ± 0.03. This series is designated by ndπ whereas the former series starting at 8.660 eV by ndσ by arguing that ndσ should have a larger quantum defect than ndπ because the number of occupied σ orbitals in the core is larger than the number of π orbitals.
Fig. 5. The VUV photoabsorption spectra of (a) C2H4, C2H3F and 1,1-C2H2F2 and (b) of C2H4, C2H3F, C2H3Cl and C2H3Br on an expanded photon energy scale between 6.0 eV and 8.0 eV. The adiabatic excitation energies of the valence (π*) and the Rydberg (3s) transitions are indicated for each molecule.
4.2.1.2. Vibrational analysis. Beside the vibrationless electronic transitions the majority of the most intense
features in the 1,1-C2H2F2 PAS between 8.2 eV and 11.2 eV are not assigned. Owing to the n-3 intensity law the rather weak electronic members of higher principal quantum number n of the successive Rydberg series become difficult to detect. The vibrational transitions associated with the low n Rydberg states are characterized by a Franck-Condon distribution and can dominate the spectrum.
To disentangle this spectrum we shall rely on the assumption [25] that the vibrational structure of states belonging to Rydberg series is similar to that of the cationic state to which it converges. This hypothesis, which neglects perturbations due to Rydberg-Rydberg interactions, has been used successfully for the interpretation of the vacuum UV spectra of the methyl halides [28] and more recently of C2H3F [1]. The vibrationless convergence limit of all the Rydberg states involved between 8.2 eV and 11.2 eV is IEad(1,1-C2H2F2+,XP2B1) = (10.298 ±0.001) eV [3]. The cationic vibrational structure results from the excitation of three normal modes [3]. However, about 95% of the available intensity is distributed over the C=C stretching mode v2+. Therefore, the HeI-PES band related to the X;2B
1 is "diatomic like" (see Fig. 2(b)). For the purpose of the decomposition of the PAS we use this HeI-PES spectrum which is translated and positioned with reference to the successive vibrationless Rydberg transitions.
The result of this procedure is represented in Fig. 3(a)-(c) and the energy positions and assignments are summarized in Table 2. In the same table the energy positions observed in the present work are compared to those reported by Limao-Vieira et al. [7]. For each Rydberg state the vibrational structure is assigned and the averaged values of the associated wavenumbers are tabulated.
Using this tool a first important confirmation is that the 2b1 → 3p Rydberg transition has to start at 8.213 eV as proposed in Section 4.2.1.1. The argument is that assuming that the transition starts at 7.912 eV as postulated in [4,7] leads to no correlation in either energy or intensity between the PAS and the Hel-PES. The same conclusion applies for the weak peak at 8.096 eV.
Except for the 2b1 → 3s Rydberg transition, for which a long v2 progression is observed, no vibrational structure for higher ns-Rydberg members could be detected.
From the data displayed in Table 2 and related to the observed npλ- (n = 3-5) and ndλ- (n = 3-5) Rydberg states, mainly three vibrational modes are excited and their respective values are fairly constant within the standard deviations. The following assignments are proposed: v2 = 1549 ± 16 cm-1 (or 191 ± 2 meV), v4 = 839 ± 40 cm-1 (or 104 ± 5 meV) and v5 = 589 ± 16 cm-1 (or 73 ± 2 meV) respectively. The indicated error limits represent the dispersion of the wavenumbers (or energies) over the nine Rydberg states. These values can be compared to those measured in the XP2B
1 state of the cation [3]: v2 = 1573 ± 8 cm-1, v4 = 895 ± 16 cm-1 and v5 = 532 ± 56 cm-1.
These values have to be compared with the vibrational analysis proposed by Limao-Vieira et al. [7], i.e.
hcω2 = 184 meV and a mode called hcω4 = 76 ± 4 meV in the 3p- and 70 ± 10 meV in 4p-Rydberg states. A v8 mode of hcωs = 120 meV in 3p and 117 meV in the 5p Rydberg state is determined. For the ndλ-Rydberg states
the hcω2 vibrational energy lies in an interval of 191-194 meV which is in very good agreement with the value determined in the present work. Albeit assigning the wavenumbers at 66-77 meV and at about 112 meV to v4 and
v8 respectively, these values correspond fairly well to hcω5 = 73 meV (589 cm-1) and hcω4 = 104 meV (839 cm
-1) as assigned in the present work.
It has also to be mentioned that several energies are listed in Table 2 in square brackets meaning that the same signal has been assigned to several (at least two) energies. In many cases the discrepancy of local intensities between the reference PES spectrum and the PAS is accounted for by the sum of two or more overlapping contributions.
The fact that the experimental data could be satisfactorily analyzed using the simple Rydberg formula and assuming the same vibrational structure as in the corresponding ionic states indicates a posteriori that perturbations arising due to Rydberg-Rydberg or Rydberg-continuum interactions are small enough so that their influence on the energy positions could not be detected at the resolution reached in our spectra.
4.2.2. Rydberg transitions between 11.2 eV and 25.0 eV (see Figs. 1 and 4)
This photon energy range is represented in Fig. 1 by range (c). It consists of several strong bands with well defined maxima, shoulders and broad and weaker bands superimposed on a continuum of increasing intensity. The energy positions, assignments and comparison with literature values obtained by photoionization mass spectrometry [6] and electron impact spectroscopy [8] are listed in Table 4 and partly included in Fig. 1.
The PAS as observed in the photon energy range of 10-16 eV is represented in Fig. 4(a) on an expanded energy scale. Obviously this spectrum shows numerous substructures. A first rough picture using the maxima of the bands allows us to assign the structures between 12.224 eV and 13.454 eV to Rydberg states converging to the A;2B2 ionic state at IEad = 14.090 ± 0.005 eV [3] whereas at energies higher than 14.786 eV the convergence limit should be the BP2A
1 ionic state at IEad = 15.40 eV [3]. The effective quantum numbers are successively n* = 2.69, 3.61 and 4.64 for the former group and 3.65 for the latter. These values clearly point to p-type Rydberg states. However, for the transition starting at 12.224 eV an effective quantum number n* = 2.007 is also determined when the convergence limit at 15.4 eV [3] is considered. This hypothesis could not be discarded. The main argument pleading for the p-type Rydberg states is the fairly good convergence between the shifted photoelectron spectrum and the ∆-plot of the PAS (see Fig. 4(b)), as explained below.
In an attempt to interpret this part of the PAS, the subtraction method is applied in a first step (see Section 2.2). The resulting ∆-plot is obtained and shown in Fig. 4(b). In a second step the appropriate HeI-PES band of the cationic state is used, to which the considered Rydberg state(s) converge(s). As already mentioned earlier, the vibrationless transition of this "stencil" spectrum is translated to make it coincide with each vibrationless transition of the successive Rydberg states. The sum of these successive contributions could simulate qualitatively the ∆-plot. The result of this operation is shown in Fig. 4(b) and directly compared with the ∆-plot of the PAS. The reasonable qualitative agreement between the simulated (SIM) and the absorption spectrum (PAS) indicates that a 2b2 → np-Rydberg series (n = 3-7) is observed and converges to the A;2B2 ionic
state of 1,1 - C2H2F2+.
As in this spectral region medium intensity or weak structures are superimposed on a relatively intense continuum, Rydberg-ionization continuum interactions might be invoked, leading to Fano-profiles [29], which would make the subtraction procedure leading to the ∆-plots problematic. The large background results, however, from the contribution of many different ionization continua opened in this energy range and associated with the different electronic and vibrational ionic states. It is expected that all Rydberg states do not interact with the same strength with these various continua. In our work on the constant-ion-state (CIS) spectra [3], we observe that the latter show a similar shape for nearly all ionic states and are nearly structureless. Only the CIS-curves for the ground ionic state show a different behavior. We concluded by stating that only resonant (emission of zero-kinetic-energy electrons) is substantial in this system, so that a given Rydberg state interacts only with a very specific ionization continuum. High q-parameter and Lorentzian profiles are then expected.
On the other hand, from a technical data handling point of view now, it is very unlikely that the data handling procedure leading to the ∆-plots erases a Fano-profile. If a Fano-profile is present, the described procedure (see Section 2.2) which consists in obtaining a "pure" background by strongly smoothing the original spectrum should get rid, in this background and only in it, of the oscillations associated with medium q Fano-profiles. When this completely smoothed background is then subtracted from the original spectrum to enhance the present discrete structures, then the oscillations should reappear even more clearly, making the detection of Fano-profiles even more straightforward. Marmet [17] and Carbonneau [18] have highlighted Fano-profiles in this way many years ago. We are confident that Fano-profiles would have been highlighted in the ∆-plots, would they have been present in the original spectra.
The above mentioned procedure allowed us to analyze in detail the vibrational structure. The energy positions and the assignments are listed in Table 4. One vibrational wavenumber could be determined, i.e. ω3 = 1 145 ±88 cm-1 (142 ± 11 meV) in 3p, 1081 cm-1 (134 meV) in 4p and 1137 ± 120 cm-1 (141 ± 15 meV) in 5p Rydberg states. These values are close but higher than 1 077 cm-1 (133 meV) determined for v3 in the A;2B2 ionic state [3] where it corresponds to the H-C-H bending vibration. With less certainty, a second wavenumber is identified with ω5 = 411 ± 40 cm-1 (51 ± 5 meV). It is comparable but lower than the value of ω5 = 532 cm-1
determined for the A;2B2 ionic state [3] and has been assigned to an F-C-F bending vibration.
Using the same procedure between 15.07 eV and 15.70 eV a very weak structure is observed and assigned to vibrational excitation as shown in Table 4. The 8a1 → 5p Rydberg transition should be involved together with the excitation of the v4 vibrational mode with a wavenumber ω4 ≈ 970 cm-1 which could be correlated with the value of 839 ± 32 cm-1 determined in the BP2A1 excited state of the cation 1,1-C2H2F2+ where it has been assigned to the C-F/C=C stretching [3].
Above 16 eV, the observed features could be assigned to Rydberg electronic transitions as shown in Table 4. The 7a1 → np and the 3b2 → np transitions dominate. This observation is in agreement with our earlier remark concerning the larger intensity of np-type with respect to ns-type transitions [1,13,28].
The features recorded in the absorbance spectrum obtained by using the gold diode detector agree fairly well with that observed using the photomultiplier. However, in the former the high energy bands are detected more efficiently, particularly above 18 eV. In this energy range Rydberg transitions from the 6a1 and 5a1 MO's may be involved.
5. Conclusions
The measurement of the VUV photoabsorption spectrum of 1,1-C2H2F2 at improved resolution by using synchrotron radiation enabled us to extend for the first time the data above the 10.5 eV photon energy limit, i.e., from 10.5 eV to 25 eV. Contrarily to the usual broad and strong bands observed in the high energy range several peaks show vibrational structures for which assignments have been proposed.
Valence-valence (2b1 → n*) as well as valence-Rydberg (2b1 → 3s) transitions are involved at the low energy part of the spectrum, i.e. between 6 eV and 8 eV. The vibrational structure has been interpreted in both states. A comparison is made with previous assignments proposed for the same transitions in C2H4, C2H3F [1], C2H3Cl [20] and C2H3Br [13].
In the 8.2-11.2 eV intermediate photon energy range, the abundant fine structure has been assigned to vibronic Rydberg transitions, i.e., 2b1 → ns (n = 3-7), npσ and npπ (n = 3-7 and 3-8) and ndσ and ndπ (n = 3-8
and 3-6) have been identified. All involved Rydberg states converge to the 1,1-C2H2F2+(XP2B1) ground ionic state. The vibrational fine structure associated with these transitions has been analyzed based on the first band of the 1,1-C2H2F2 HeI-PES results [3]. This procedure allowed us to assign the observed structure to three vibrational modes (and their harmonics and combination) ω2 = 1549 cm-1 (C=C and C-F stretching), ω4 = 839 cm-1 (C-F symmetric stretch, C=C stretching) and ω5 = 589 cm-1 (F-C-F bending).
Acknowledgments
We are indebted to the University of Liège, the Fonds de la Recherche Fondamentale Collective (FRFC) and the Freie Universität Berlin for financial support. R.L. and B.L. gratefully acknowledge the European Community for its support through its TMR (Contract EU-HPRI-1999CT-00028) and 13 (Contract R II 3 CT-2004-506008).
References
[1] R. Locht, B. Leyh, D. Dehareng, H.W. Jochims, H. Baumgärtel, Chem. Phys. 362 (2009) 97.
[2] R. Locht, B. Leyh, D. Dehareng, K. Hottmann, H. Baumgärtel, J. Phys. B 43 (2010) 015102.
[3] R. Locht, D. Dehareng, B. Leyh, J. Phys. B 45 (2012) 115101.
[4] G. Bélanger, C. Sandorfy, J. Chem. Phys. 55 (1971) 2055.
[5] P. Dauber, M. Brith, Chem. Phys. 11 (1975) 143.
[6] D. Reinke, R. Krässig, H. Baumgärtel, Z. Naturf. 28a (1973) 1021; D. Reinke, H. Baumgärtel, T. Cvitas, L. Klasinc, H. Glisten, Ber. Bunsen Gesell. Phys. Chem. 78 (1974) 1145.
[7] P. Limao-Vieira, E. Vasekova, B.N. Raja Sekhar, N.J. Mason, S.V. Hoffmann, Phys. Chem. Chem. Phys. 8 (2006) 4766.
[8] M.J. Coggiola, W.M. Flicker, O.A. Mosher, A. Kuppermann, J. Chem. Phys. 65 (1976) 2655.
[9] S. Arulmozhiraja, M. Ehara, H. Nakatsuji, J. Chem. Phys. 126 (2007) 044306.
[10] J. Gonzalez-Vazquez, L. Gonzalez, Chem. Phys. 349 (2008) 287.
[11] F. Güthe, R. Locht, B. Leyh, H. Baumgärtel, K.M. Weitzel, J. Phys. Chem. A 103 (1999) 8404.
[12] E. Gridelet, D. Dehareng, R Locht, A.J. Lorquet, J.C. Lorquet, B. Leyh, J. Phys. Chem. A 109 (2005) 8225.
[13] A. Hoxha, R. Locht, B. Leyh, D. Dehareng, K. Hottmann, H.W. Jochims, H. Baumgärtel, Chem. Phys. 260 (2000) 237.
[14] G. Reichardt, T. Noll, I. Packe, P. Rotter, J.-S. Schmidt, W. Gudat, Nucl. Instr. Methods A 467-468 (2001) 458.
[15] J.M. Dyke, N.K. Fayad, A. Morris, I.R Trickle, J. Phys. B 12 (1979) 2985.
[16] R Locht, B. Leyh, A. Hoxha, D. Dehareng, H.W. Jochims, H. Baumgârtel, Chem. Phys. 257 (2000) 283.
[17] P. Marmet, Rev. Sci. Instrum. 50 (1979) 79.
[18] R Carbonneau, E. Bolduc, P. Marmet, Can. J. Phys. 51 (1973) 505; R Carbonneau, P. Marmet, Can. J. Phys. 51 (1973) 2203; R Carbonneau, P. Marmet, Phys. Rev. A 9 (1974) 1898.
[19] P.J. Mohr, B.N. Taylor, J. Phys. Chem. Ref. Data 28 (1999) 1713; P.J. Mohr, B.N. Taylor, D.B. Newell, Rev. Mod. Phys. 80 (2008) 633.
[20] R. Locht, B. Leyh, K. Hottmann, H. Baumgärtel, Chem. Phys. 220 (1997) 207; H. Keller-Rudek, G. K. Moortgat, MPI-Mainz-UV-VIS Spectral Atlas of Gaseous Molecules, http://www.atmosphere.mpg.de/spectral-atlas-mainz.
[21] H. Jiang, D. Appadoo, E. Robertson, D. McNaughton, J. Comput. Chem. 23 (2002) 1220.
[23] M.J. Berry, J. Chem. Phys. 61 (1974) 3114.
[24] S. Arulmozhiraja, M. Ehara, H. Nakasuji, J. Chem. Phys. 129 (2008) 174506.
[25] M.B. Robin, Higher Excited States of Polyatomic Molecules, vol. I, Academic Press, New York, 1974.
[26] RF. Lake, H. Thompson, Proc. Roy. Soc. Lond. A315 (1970) 323.
[27] E. Lindholm, Arkiv Fysik 40 (1969) 97.
[28] R Locht, B. Leyh, A. Hoxha, H.W. Jochims, H. Baumgärtel, Chem. Phys. 272 (2001) 259; R Locht, B. Leyh, H.W. Jochims, H. Baumgärtel, Chem. Phys. 317 (2005) 73; R Locht, B. Leyh, H.W. Jochims, H. Baumgärtel, Chem. Phys. 365 (2009) 109.