INNOVATIVE IN-SITU SNOW PARAME TER
SENSING SYSTEM ALLOWING ACCURATE
REMOTELY SENSED DATA CALIBRATION
FOR IMPROVED FORE CASTING OF HYDRO
POWER RESOURCES.
PROGRESS REPORT III.
PROGRESS REPORT III
CONTRACT N°: NNE5/2000/251 PROJECT N°: NNE5/251/2000 ACRONYM:SNOWPOWER
TITLE: 'Innovative In-situ Snow Parameter Sensing System Allowing Accurate Calibration of Remotely Sensed Data for Improved Forecasting of Hydro Power Resources'
PROJECT CO-ORDINATOR:
• FZK - Forschungszentrum Karlsruhe GmbH, Germany (partner 1) PARTNERS (order according to contract):
• KTH - Kungliga Tekniska Hôgskolan, Sweden (partner 2)
• SLF - Swiss Fed. Inst. for Forest, Snow, and Landscape Research as Part of Swiss Federal Research Institute WSL (partner 3)
• HQ - Hydro-Québec, Canada (partner 4)
• INRS - Institute National de la Recherche Scientifique, Canada (partner 5) • SOM - Sommer GmbH & Co. KG, Austria (partner 6)
REPORTING PERIOD : FROM 2003-01-09 TO 2004-31-08 PROJECT START DATE: 2001-01-09
Date ofissue ofthis report: 2004-29-10
DURATION: 36 Months
Project funded by the European Community under the '5th Framework' Programme (1998-2002)
EU-RTO
prOjecr+-SNOWPOWER
FOf5chung5zentfum Kilrlsruhe Technlk ~lI1(1 __ IJn1-cc,,~ __ it _ _
Table of contents
"
'._'.0""",,,
• Institut national de la re<herche s<ÎEt-ntlflquL"'tm~ f Tf
Hydro
~
i~A ~~
Québec "NV
"""'..f'lC
WSl eN. "7 ~ ,
1. EXECUTIVE PUBLISHABLE SUMMARY ... 2
2. OBJECTIVES AND STRATEGIC ASPECTS ... 2
2.1. SOCIO-ECONOMIC OBJECTIVES AND STRATEGIC ASPECTS ... """ ... , .. """" 2 2.2. SCIENTIFIC/TECHNOLOGICAL OBJECTIVES ... , .. , .. , ... 3
3. SCIENTIFIC AND TECHNICAL PERFORMANCE ... 3
3.1 SUMMARY OF THE SPECIFIC PROJECT OBJECTIVES FOR THE RELEVANT PERIOD ... 3
3.2. OVERVIEW OF THE TECHNICAL PROGRESS ... 4
3.2.1 Introduction ... , ... 4
3.2.2 Work Package 4 ... , ... , ... , ... 4
3.2.3 Work Package 5 ... ' ... 9
3.2.4 Work Package 7 ... 11
3.2.5 Work Package 8 ... 23
3.3. COMPARISON OF PLANNED ACTIVITIES AND ACTUAL WORK BV THE PARTNERS ... 24
3.2.1 Work Package 4 ... 24
3.2.2 Work Package 5 ... 24
3.2.3 Work Package 7 ... 25
3.2.4 Work Package 8 ... 25
3.4. PLANNED ACTIVITIES FOR THE FuTURE ... 25
4. LIST OF DELIVERABLES ... 26
5. DISSEMINATION AND USE OF THE RESULTS ... 27
6. MANAGEMENT AND CO-ORDINATION ASPECTS ... 27
6.1. GENERAL PROJECT COORDINATION ... 27
6.2. PERSONNEL ACTNITIES ... 27
6.3. CONFERENCE AND MEETING ATTENDANCES ... 28
6.4. PuBUCA TlONS (ADVANCED NOTICE) ... 28
7. GLOSSARY ... 28
EU-RTD
prOjecr+--SNOWPOWER
1. EXECUTIVE PUBLISHABLE SUMMARY
For~chung<;zentrum Karlsruhe
TeGI~nlk und Un'!'<Nett
,
..•
- . Institut n-,
IUP,) ETf .• Uonal de...
-
la reche«ne KlendflqueImproving the energy production from renewable resources is an important global goal. Hydro power facilities fulfil this demand attractively and at the same time help to meet the Kyoto objectives of CO2
reduction. Efficient energy management of hydro power resources requires accurate forecasting of water capacity from snow melt and run-off. Yet the filling pro gnoses from snow melt for hydro power reservoirs is insufficient, because the calibration of remotely sensed data e.g. from satellite or aircraft is inaccurate up to 50 %. The objective of this project is to increase the precision of filling prognosis to at least 20% by calibrating the remotely sensed data with ground truth data determined by new snow measurement methods. As an example of potential benefits, a 10% gain in forecast precision at the 'La Grande Rivière' -catchment in Quebec (320.000 km2
) would correspond to a yield of2.2 TWh or 45 ME or 1,6 TWh respectively 32 ME
for Switzerland.
A new electromagnetic cable sensor for snow moi sture and density measurements allowing a monitoring of an area of up to 2000 m2 and evaluation software has been developed in the laboratory. The software
integrates an air gap correction algorithm and a reconstruction code that allows the determination of a moi sture and density profile of the snow pack along the cable sensors. The sensor was tested with a laboratory prototype device during two winter field periods (200112002 and 2002/2003). These field measurements were carried out both at measurement sites in Switzerland (Davos) and Canada (Quebec). Data were evaluated and compared to reference measurements in the conceming snow packs with promising results. Different sensor installation methods have been evaluated and the interactions of the sensor with snow pack characteristics have been documented. Based on these experiences an installation guide for optimal sensor placement has been established. The measurements also help to improve snow hydrologie al models. Based on the results and experiences with the laboratory-scale instrument, a bench-scale instrument has been developed and tested in the field. Due to serious disturbances of electromagnetic radiation in the field, the set-up of the bench-scale instrument had to be revised and updated during the third year. The new set-up was tested at Davos in spring 2004.
2. OBJECTIVES AND STRA TEGIC ASPECTS
2.1. SOCIO-ECONOMIC OBJECTNES AND STRA TEGIC ASPECTS
The main objective of the SNOWPOWER project is the efficiency enhancement of hydro power stations, which generate energy from snow melt water. It belongs as the central relevance to EU Key action 'Renewable energies' (5.2.5) and it will contribute to the increase of the share of renewable energy in the European and global energy balance in producing electricity at a cost far under 0,15 E/kWh. Seven countries of the EU plus Switzerland and Norway operate hydro power stations where the catchments are under snow coyer in winter. Several other countries of the world have the same situation, especially in Canada where some of the world largest hydro power stations are fed with snow melt. Electricity from water is the cleanest energy transformation among the renewable sources. So, it addresses also the Key action 6.5.4 (lmproving the efficiency of new and renewable energy sources). Hydro power generation avoids emissions, any kinds, especially green house gases. Their efficiency enhancement is the best contribution to the global CO2
reduction as required by the Kyoto agreements. The project will contribute to the consumer satisfaction and quality of life by increased electricity production without air pollution. The hydro power stations already have a high technical efficiency without severe consequences to the environment. This potential will be remarkably enhanced by the water management improvement as result of the project. It is a special possibility to improve an already good energy generation with excellent social acceptance.
The proposed solution for efficiency enhancement is suitable for new and existing plants without any restrictions. It does not need any hardware installations in the power plant itself. By this way the sustainable management and quality of water can also be improved. In this sense it contributes to the EU policy of sustainable use of water resources at catChment scale. A certain synergy effect will be expected to this policy. In case of project success Europe will have a good competition position for the industrial marketing
EU-RTD
prOjeC~
SNOWPOWER
For~chung .. zentrum Karlsruhe Technlk und Urn'l'.'ett
KTH
Hydro E':'~~
e!
w-*v
Ouébec WSl ~;,f1~
of the technology and the Canadian partners will benefit directly from use of the technology and from exploitation in North America. In addition a new market will be created for the equipment and Europe will benefit by the increased demand for skilled employment.
Society will also benefit from better flood prediction and avalanche warning as weIl as better management of drinking water resources that are fed by snow covered catchments.
2.2. SCIENTIFIC/TECHNOLOGICAL OBJECTIVES.
Water authorities often limit the by-pass water flux for the electric energy generation, in order to feed the natural environment with more water. An enhancement of the efficiency in such cases can compensate this water reduction. This situation is relevant in the alpine regions of, Austria, France, Germany, Italy and Switzerland as weIl as in the Nordic regions ofScandinavia.
The proposed method is innovative not only on the level of each single sensor but on method and system levels also. Beside the enhanced remote data calibration and better snow water equivalent (SWE) prediction, we expect an overall improvement of the satellite data driven hydrologic computation.
Advances in hydrological modelling are one of the main objectives of the project. We want to get a better understanding of the start and development of snow melting processes and a better conversion of the measured physical data into snow properties distribution. It is obvious that we will get synergetic results for the avalanche warning and flood prediction as weIl as a better prediction of drinking water resources from snow covered areas. Finally the intended field installations and instrument fabrications including a remote control network will help to make data collecting much easier.
3. SCIENTIFIC AND TECHNICAL PERFORMANCE
3.1. SUMMARY OF THE SPECIFIC PROJECT OBJECTIVES FOR THE RELEVANT PERIOD.
During project year 3, the work packages (WP) 4, 7 and 8 were planned to be carried out. Due to a significant delay ofWP 5, work was continued also on this work package.
In WP 4 the hydrological models and the corresponding forecast strategies for hydro power optimisation should be developed. This WP started in the first year and lasted until the end of the project.
The hydrological models which have been developed by the project partners will be extended to incorporate the ground truth data from the snow sensors. An interface to the snow sensor network software will be developed. The RADARS AT data will be combined with the ground data, i.e. the backscattering signaIs of the radar sensor are correlated with the snow properties at the sensor test sites resulting in an improved backscattering model. Based on these results at representative locations maps of snow properties are produced for the catchments of hydro power stations. The hydrological models will be improved to predict snow parameters and water transport at different scales. The water transport within the snow coyer the sensor sites will be predicted and compared with the actual data. The same is done for the catchment of hydro power stations in order to forecast the filling level. The results of the new model are compared with predictions by former models as weIl. The improvement in accuracy will be quantified as weIl as the corresponding economic advantage for the hydro power stations. New management strategies for an optimum exploitation of hydro power will be developed. Based on the better prediction of the filling level short and long time production of electric energy is optimised. The output of the hydrological model is a short time prognosis for melt water feeding and a long time prognosis for total available water which is correlated to snow water equivalent. Both pro gnoses will be incorporated in the water management plan of HQ and the corresponding economic advantages will be separately identified
EU-RTO
prOjecr+--SNOWPOWER
Forschungszentrum Karl~ruhe
Techmk und Um\""elt
j",Hydro
t!~~~~~
", .", Ouébec. 'NV ~,n<:::
WSl "N' "7 ~ .
The objectives of
WP
5 were the development and building of a bench-scale instrument (BSI) including a sensor network. A weather-proof bench-scale instrument with an accuracy comparable with the laboratory instruments but with much less weight and energy consumption was planned. The deveIopment of the bench-scale instrument consists of three parts: mechanical construction, electronic design and computer control. The instrumentation has to be extremely weather proof with all connections carefully sealed. The system should operate down to minus 20°C and has to be equipped with a solar power supply and additional batteries. The electronic measurement circuit exists oftwo main blocks, a low-frequency impedance analyser and a time domain reflectometer. Main aspects are a lower power consumption and less size than the laboratory instruments used before. It is based on new integrated electronic circuits. The computer to be developed has to control the impedance analyser and the time domain reflectometer. It must also switch the multiplexer. Date is stored non-volatile. The processing may be either online or offline. The instrumentation will be quipped with remote control and data transmission via radio or telephone. Several instrumentations at different locations can be grouped to a network. A software will be developed to analyse the data and present them graphically. The properties of the bench-scale instrument will be compared with the laboratory equipment in regard to measurement accuracy under different environmental conditions. The bench-scale instrument will be equipped with remote data transmission for easy integration into data acquisition networks.ln WP 7, a large-scale field campaign with a network of sensors was planned for a large catchment in Canada. Several sensors would have been installed at selected representative locations within the La Grande catchment. Data should have been transmitted by radio to a control center. The suitability of the sensor s network for operational use would have been reported. The complete data chain from individual sensor measurements to the combination of sensors in groups, data transmission and processing would have been evaluated. Methods would have been developed to determine the optimum number of sensors test sites in a given catchment area and how to integrate them in the operational work. Because of the unavailability of the BSI, as explained above, the program was modified and the measurements were performed using laboratory equipment. However the information obtained enabled integration in the operational work as planed. Nevertheless, RADARS AT data sets were acquired over the La Grande watershed and were processed to map the backscattering coefficients. Weather data have been acquired as weil. A field team have been sent twice to the test sites and perform additional snow measurements. AIso, ground and radar data have been combined into a comprehensive database for subsequent analysis in Work Package 4.
In WP 8, depending on the results (weather one or further patents will be inc1uded) the partners HQ and SOM should agree under the leadership of the co-ordinator on the distribution of rights conceming the hardware introduction into the technical instrument development. The scientific results will be pub li shed in periodicals, like remote sensing, cold regions technologies, subsurface sensing and others. Aiso the application to other hydro power firms will be offered.
3.2. OVERVIEW OF THE TECHNICAL PROGRESS
3.2.1 Introduction
During the relevant period, work was continued on WP 4 as planned until the end of the project. WP5, the development of the bench-scale instrument (BSI), which was considerably delayed, could be finished in this period in project month 31. WP 7, the large-scale field test, and WP 8, the dissemination and exploitation have been started. WP 7 was additionally extended with the field test of the bench-scale instrument, which, due to delays in the development and seasonal reasons, could not be carried out in WP6 as originally planned.
3.2.2 Work package 4
WP 4 already started in the first year and lasted until the end of the project. The existing hydrological models from the project partners, such as HYDROTEL and ALPINE3D could be considerably improved and were extended to incorporate the ground truth data from the snow sensor and an interface to the snow sensor network software could be developed.
EU-RTD
prOjec~
SNOWPOWER
a.) Canadian hydro models and algorithms
Forschungszentrum Karlsruhe
Teochnlk und I.Jrnvvelt
s~~r
/ H y d r o A;~~~~
Québec ~ ~;;tl~
The Canadian partners INRS and HQ proposed the HYDROTEL hydrological model to be used with the SNOWPOWER instrument and EQeau (RADARSAT-l) spatial distribution of snow water equivalent. In Northern Quebec, comparison would have been made with the global hydrological model presently used by HQ, as mentioned in the description of the work to be done. The HYDROTEL model is a distributed model which is able to update its spatial distribution of SWE from a network of snow survey stations. So, SWE and thickness of snow pack derived from SNOWPOWER data can immediately be used instead of the actual snow survey data, or in conjunction with them.
For the 2003-2004 winter season, a set of SNOWPOWER probes was installed at only one site of the
Beaurivage watershed south of Quebec City (see also WP 7). Bi-hourly measurements of snow depth and snow density were taken from mid-February through the beginning of April. Weekly snow profiles including temperature, density, snow grain types and diameters were also obtained to test the probes. So, for the
Beaurivage sub-watershed, forecast stream flows (a) without updating of the simulated SWEs and snow depths, (b) with updating of those values using (b 1) only data from the two snow survey stations closest to the watershed, with the more frequent SNOWPOWER (b2) data or (b3) snow sampler measurements at the SNOWPOWER site, (b4) the SNOWPOWER data added to the snow survey data and (b5) the daily simulated CROCUS data are compared. Previous studies showed that the French CROCUS model (Meteo-France) was able to simulate accurately the temporal evolution of the snow pack thickness as measured by a laser probe at three sites for three winter periods in Northern Québec (Savary, 2002). For the Beaurivage watershed, the second simulated stream flow peak and volume, without snow coyer updating, were too low. If the snow coyer is updated using the snow survey data of the Québec Department of Environment, the simulated stream flows are now quite similar to the measured ones, so that the flood volume is approximately the same. In this specific case, simulations in which the snow survey data are replaced by SNOWPOWER data, snow sampler data taken at the SNOWPOWER site or daily simulated CROCUS data, even if added to snow survey data, do not lead to more accurate stream flow simulations. It can be noticed, however, that the first increase of stream flow as simulated from CROCUS data is more similar to the measured stream flows than with the other ways of snow coyer updating. These results show the importance of snow coyer updating. In order to obtain very good results, great care should be taken for the choice of strategie measurement sites with the largest spatial representativeness. AIso, the SNOWPOWER site chosen for practical reason was not ideal for snow coyer updating, as it was located in an agricultural field.
An updating comparison was also tried for the main stream flow station of the Chaudière watershed. Daily SNOWPOWER data were then simulated using the French CROCUS (Météo-France) snow model. The CROCUS model was applied on the Chaudière watershed, using the available data at three meteorological stations in the mid-watershed sector to drive it. The CROCUS obtained values at those stations were then assumed to be SNOWPOWER probes values and used to update the state variables of the HYDROTEL model. The initial simulation, without snow· coyer updating, leads to a clear underestirnation of peak flows. Here, updating the snow coyer from snow survey data does not lead to results as good as for the Beaurivage watershed (a sub-watershed of the Chaudière River). There is an increase of the simulated flows but they are still too low when compared to the observed values. Another updating approach has been obtained by simulating daily values of SNOWPOWER probes at the actual SNOWPOWER site and at three more sites where meteorological stations exist for the center section of the Chaudière watershed. In that case, the peak flow and volume of the first flood are much better simulated and the second ones are even better, the simulated peak flow being only slightly higher than the observed peak. Another simulation was tested in which the CROCUS values were assumed to be available only on the dates of the snow surveys. The result is similar to the one using daily CROCUS values and snow survey values. One could conclude that a more frequent availability of snow coyer values of less than 15 days is not necessary, but as a matter of fact, the availability of daily data by the SNOWPOWER system is very important in case of heavy snowfalls or if intensive melting occurs after a snow survey made at intervals oftwo weeks and before a major flood event.
EU-RTD
PrOjec+--SNOWPOWER
Forschungs%entrum Karlsruhe
rechmk und Umweft
KTH
"
1.
•-'''-
ln.ltlt'ut nattonal d. 1. recherche K~nttflqu.JURS eTE
Hydro
.a
~~
~~
Québec ~~;t1~
Conceming the application of EQeau, a spatial and temporal analysis of the signal variability over the La Grande watershed has been done. The backscattering coefficients were extracted from three (3) RADARSAT-l SeN data set acquired in 2003-2004 but also in 2000-2001 and 2002-2003. It was observed that no particular variation of the backscattering coefficients were associated with a specifie land use c1ass. Temporal variation of the mean signal during the winter is generally equal or less than IdB but this could be observed for each data set. Generally, the backscattering coefficients are lower in November and increase during the winter. The normal variation of the backscattering coefficients with the angles of incidence is not completely eliminated using the temporal ratio for the angles below 23° and above 38°. Finally, the meteorological conditions at the moment of acquisition (rain, wet snow) introduce significant variation of the backscattering signal. Major improvements have been achieved in EQeau by integrating SNOWPOWER data for a distributed estimation of punctual snow density measurements. Figure 1 shows the relationship between estimated and measured snow density.
400 350
a
300~
~ 250T
l
200 150 RMSE:23 kglm3 R2:0.83 / ' /' + ++ /' 100 t/' / ' / ' 50~--~--~~--~--~~--~--~~--~--~ 50 100 150 200 250 300 350 400 450 Densité mesurée (kg/m3)Figure 1 -Relationship between estimated and measures snow density
The new algorithm developed in the project uses both multiple regressions (altitude and latitude) and spatial interpolation (inverse distance). The random mean square error cou Id be minimized to 23 kg/m3 (former RMSE 37 kg/m3
) and a regression coefficient R2 of 0.83 could be achieved. The EQeau software was then
modified to run the new approach: read the Hydro-Quebec historie density measurements, calculated the regression, read the MNA, applied the regression for each pixel, estimated the density for each pixel.
Using the new spatial interpolation approach for snow density as weil as new filtering method (Lee) and a resampling pixel size of 375 x 375 m ( instead of 50 m), it is now possible to explain 78% of the variation of theSnow Water Equivalent of the snow pack with an error of 29 mm. This value is better then the error of 39 mm of the former model. Fig. 2 shows a comparison of the estimated and measured Snow Water Equivalents with the new model.
EU-RTD
prOjecrY"--SNOWPOWER
300 250 éT
200~
+ 150 100 + 100 150Forschungszentrum Karlsruhe
Technlk und Um.velt
s
~
er
200 250
EEN mesuré
+
"
'
.
• . -Insthut n8....
-
lonal de h. ,.che,c:he KlendnqueIURS HE Hydro rNA~~
e!
'H'*V
Québec WSl ~~ >h~ + + 300 350Figure 2 - Comparison of estimated and measured Snow Water Equivalent.
It can be stated that the direct interpolation of the SWE measured in the field (method applied to densities)
allows to explain 72% of the variation of the S WE with an error of31 mm. So the add on of the radar image
allows a 6% gain of information and 2 mm in precision.
The maps of the SWE established with the modified EQeau model shown in Figure 3 show a continuous spatial distribution in contrast to the former version. They also show a spatial gradient from East to West with much higher SWE data in the Eastern sector.
50 120
janvier 2001 mars 2001
Figure 3 -SWE maps established with the modified EQeau software from winter 2001
So the following conclusion can be drawn from the 2003/2004 winter experiments based on the results from
Snowpower:
The rigorousness of the image processing chain of RADARSA T data have been improved.
The temporal variation of the radar signal during the winter is low but comparable from one data set to another.
The new approach for the spatial interpolation of the punctual snow densities measurements shown to be efficient. (R2 = 0.83)
Improvement ofSWE map accuracy of6%was achieved using ScanSAR data from RADARSAT-l;
EU-RTD
prOjecr-{j---SNOWPOWER
b) Swiss hydrological modelsForschungszentrum Karlsruhe Technlk und Umwelt
s
~
er
KTH
IIr • . -... o.Hb«
• In'lthut national de 1. recherche sdenttflque
IURS fTF
Hydro
t!
~~~
~~
Québec ~;:tJ.nr::WSl '1' .
As mentioned in earlier reports, the contribution of SLF/WSL to WP 4 has already been started in the first year, and continued also in the second and third year of the project.
Last year, a distributed hydro-meteorological model (ALPINE3D) designed for alpine and sub-alpine environment has been developed. lts purpose is to be used as a snowmelt runoff prediction tool in alpine catchments. ALPINE3D is built up by a number of sub-modules that have been developed and tested extensively in earlier work:
(a) SNOWPACK (Lehning et al., 2002) is the snow model developed at SLF, originally for avalanche risk assessment;
(b) a vegetation model, adapted from Koivusalo and Kokkonen (2002); (c) a radiation distribution model (Fierz et al., 2003);
(d) the groundwater-runoff module of PREY AH (Gurtz et al., 1999).
ALPINE3D has been tested against snow and runoff data from 2 watersheds (the Dischma-valley close to Davos, and the sub-alpine Alptal-valley south of the lake of Zurich) and the area around Weissfluhjoch/Davos where the SNOWPOWER sensor was installed. Figure 4 shows an example of simulated incoming shortwave radiation on a sunny day in January 2003 (12 p.m.) reflecting the great spatial variation due to topography realistically reproduced by the model.
2600 2500 2400 2300 2200 2100 2000 1900 193
...
.
..
: . ..
. . . . . ' . , : . .. . . ... ,,' ... ... . . . . . , .' ." ... ~" . ... : ... . " ... . . . . : . . . .. . . . : .. . ... . ... .. : ... . .i.
__
~-
-
---'"
\-
~~
:-
-';7~81
-
--""\7
8
15
191.5 779 779.5 780 780.5Figure 4 - Incorning shortwave radiation on the J 5th of January, 2003 at J 2 p.rn.
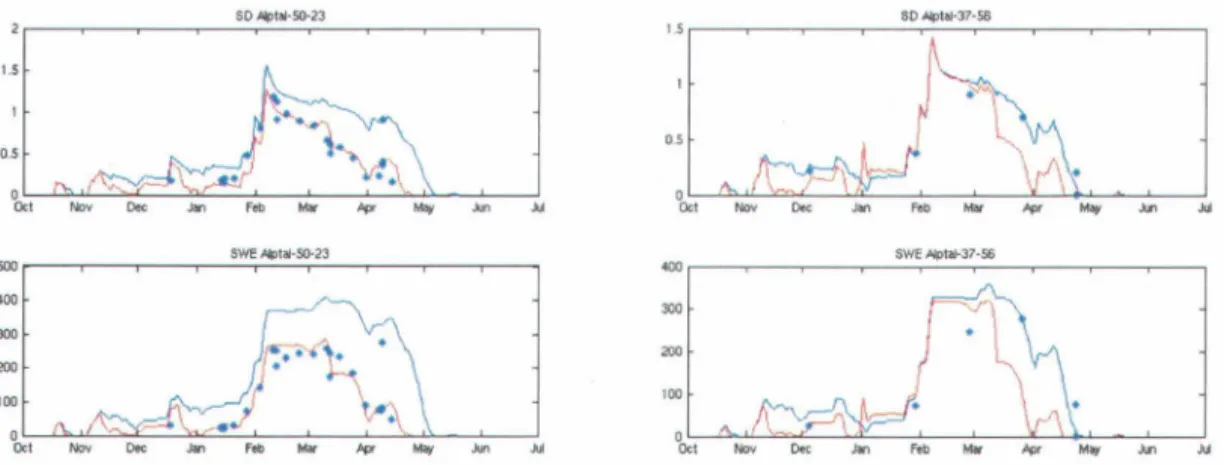
A first approach for updating the simulated snow depth, or the SWE respectively, with actual snow measurements, su ch as data from the SNOWPOWER sensor, has been introduced into the model. This updating approach was tested for one winter season in a sub-alpine watershed in central Switzerland (Alptal). The test showed that the improvement of the SWE simulation strongly depended on the frequency of available measurements, as weil on their location. With the (manual) snow measurements in the Alptal that were taken weekly at sorne places and monthly at others this updating of the SWE lead to a varying degree ofimprovement of the SWE simulation at various sites (Figure 5). Obviously, the method was quite rigid and produced an alteration of the snow coyer that was somewhat overestimated. Overall, the coefficient of determination R:J for SWE and snow depth at ail 15 locations and ail measurements was only increased from
EU-RTD
projecL\f-SNOWPOWER
Forschungszentrum Karlsruhe
Techmk und U~1t
KTH
"
r.
•_
lruthut natkmal d . . . rechfiche sdendflque.
... _
IHRSHE
Hydro
.a
r..~
~~
Québec ~ ~;:f1~
0.80 to 0.81 in this case (Figure 6). However, with the SNOWPOWER sens or providing SWE at an hourly or daily basis it can be expected that such an updating algorithm becomes more efficient.
Figure 5 -Simulated (lines) and manually measured (dots) snow depth (top) and SWE (bottom) for two selected sites in
the Alptal catchment: a site with weekly measurements (left) and a site with monthly measurements (right). The blue
line shows the simulation without snow updating, and the red line represents a simulation with the updating routine.
600..---,- - , -- -..,..-- , - - - . -- ..,.--,...--.., 500
I
400!
300 05 200 100.
,.
"..
, ' ,".
t 'fI ,$ ,.
,.,
.'..
.
.
~, ,.
,.
/
".
°0~~50~-1~0-0-1~50--20~0-~25~0-3~0-0-3~50-~400 Observed (mm) no updating 450 r---,---r--..,..--,---r--~-~---, 400 350 _ 300 E §.. 250"
!!l ~ 200 05 150 100.
t" ' 50 • , " ' . . • • t,. ... .* •• 1:' ,.
50 100 150 200 250 300 350 400 Observed (mm) wi th updatingFigure 6 -Simulated versus manually measured SWE (mm) for 15 locations in the Alptal catchment during winter
2002/03.
3.2.3 Work package 5
Based on the experiences of the laboratory-scale instrument, the bench-scale instrument (BSI) was developed, consisting of two measurement modules, one for high-frequency (Ti me Domain Reflectometry
-TDR) and one for low-frequency (Impedance Analyser - lA) measurements. Laboratory testing of BSI was successfully fmished, when preliminary field testing revealed serious interferences of the lA module with electromagnetic waves outside the laboratory. Therefore the set-up of the lA had to be revised and equipped with more sophisticated filtering components. This led to a significant delay and the work package had to be prolonged. At the end of project month30, the frrst BSI prototypes were manufactured and WP5 could be finally closed with a delay of 12 months. However despite the delay, the BSI was successfully installed and operated as described below.
EU-RTD
prOjecr-f.--SNOWPOWER
Forschungszentrum Karl~ruhe
rechnlk und U!TlYoo'e~
5
er
KTH
11'·• ..-... • In.sthut nat.. -,lonal de 1. ,.echerche sdentlflque
ItIRS ETE
Hydro ENA )l.r'
L.r-t!
S"'*1;
Ouébec WSl ~;::t'l,{f'Figure 7 - BSI at the Swiss test site in the weather-proof installation box
The core of the BSI prototype shown in Figure 7 is an embedded web module with a 16-Bit CPU 80186 with 20 MHz. It supports TCP/IP, PPP, HTTP and FTP protocols. The measurement parameters can be edited via Browser, the data are stored on Compact Flash Cards where data of several months can be archived or an automatic transfer via FTP on FTP-Server can be carried out. The BSI is additionally equipped with 8 additional analogue-outputs for snow temperature and snow depth sens ors that will be necessary for correction of the influence of snow temperature and detecting the snow-air interface when only low frequency measurements are used with a sloping sensor installation.
At the end of the field test period, the second and improved BSI prototype shown in Fig. 8 was installed at the Swiss test site. This second BSI is reduced in size and equipped with a new casing. The BSI includes the device for the low-frequency measurement and the web module for controlling the measurement. The multiplexer, which allows the networking of up to 4 sensor cables, was also moved into the BSI to reduce losses due to cable and to keep the whole system compact. The TDR module for the high frequency measurement is connected via an additional interface. The power supply of the TDR is controlled by the BSI to keep the current consumption low by only switching the TDR on during measurement. The control and the settings for the high and low frequency measurement as weIl as the multiplexer are accessible by a homepage running on the web server of the embedded web module. The data st orage is a Compact Flash Card that can be changed manuaIly. Data transfer can be established by a direct connection to a computer or via a modem. The connection of a modem is provided by the BSI, which also controls the power consumption of the modem. The whole system is designed to fuI fil the requirement for low energy consumption of a field instrument and allows the supply of the complete system by solar panels.
EU-RTD
prOjecr--0-SNOWPOWER
Forschungszentrum Karlsruhe Technrr und Umwel!
s
dv\
er
KTH , ,' • . -.... ua..-• Institut "'8110nal d. 1. rKh .... CM Kktndflqu. ItlRS Hf Hydro(t
rNA )l,.r' S"'*L-
L.r-Québec WSl ~~;,f1~Figure 8 -BSI with lA-module, Multiplexer and option for TDR module connection
3.2.4 Work package 7
Originally planned as a large-scale field test, this work package had to be modified mainly due to the significant delay that was faced in WP 5. Work on this WP 7 was started one month earlier (27) than planned (28).
a.) Contribution of the European partners
As mentioned in the previous progress report, we extended this WP 7 with the field test of the BSI which could not be carried out in WP6 due to delay and seasonal reasons. Therefore we again installed an additional sensor cable at the Swiss test site in Davos at the beginning of winter 2003/2004. At the end of project month 30, the first prototype of the BSI was available for installation at the Swiss test site. It was installed on March 31, 2004. Conceming the suspension of the sloping cable that was adopted from Hydro Quebec specifications, it can be concluded that it was a clear improvement compared with the earlier methods. However, although the cable seemed in proper shape and no superficial damage was visible (Fig. 9), we found out that one of the internai copper conductors was broken mainly due to the heavy snow load of the 2004 winter. Fortunately we cou Id repair it and measurements with the BSI could be run immediately.
EU-RTO
prOjecr!--SNOWPOWER
Forschungszentrum Karlsruhe rechmk und Umwett ~s
clv\
er
€)
KTH"I.
•-
Institut national....
~ de 1. rKherche KlenlfflqueIURS ETE
Hydro
@
:
~~
~~
Québec WSL ~"'.rtc:: '1' .
Figure 9 - Installed cable at Swiss test site and repair ofbroken conductor
Contrary to expectations, winter conditions at the Swiss test site prevailed until July 20. This allowed a complete test program of the BSI equipment and provided us with a data set over nearly 4 months. The registered snow depth at WeissfluhjochIDavos during winter 200312004 is shown in Fig. 10.
300 250 E .!:!. 200 .s:
-
Co 150 CI> "tl ~ 0 100 c: en 50 0Figure 10 - Snow depth of Swiss test site in winter 2003/2004
The first prototype of the BSI has been running from March 31 to its replacement on July 1,2004. The second BSI prototype was equipped with an internai multiplexer allowing the networking of 4 sensor cables and with a TDR module for the high frequency measurements. Also, this complete system ran failure-free until the end of the measurements on July 20, 2004. It also cou Id be demonstrated that the communication with the BSI and the data transfer via modem worked excellently.
The first results of capacity measurements (Fig. Il) showed that the measured capacities made sense and were in accordance with the experiences of the laboratory devices from the previous years.
EU-RTD
prOjecr\f--SNOWPOWER
640 , - .,... T , -r-- , .,.. Or" 1 , , , , , , l , , , , • 1 l , , , , • 1 630 _.L .~. ~._~ - : - - - ' - -- ;---'-620 610 N :li 600 ~ ï 590 ~ .; 580 (,) , , l , 1 , , 1 . , , .. __ ... __ .... __ ,_ -'---1 , , , • l , , , , , , l , , , , , r- r--,--·,---,· -, , __ . l _' . . ' ___ ' ___ ' ___ '. 570 --:--: --: -:--:- -:--1 l , , , 560 550 Forschung,zentrum Karlsruhe Technl6<. und UflToNelt5
er
KTH
MeBwerte um 8hOO
"1.
•-· ... -
Institut national d. la ~het"che sdendflqueIHRS ETE Hydro
t!
~~
~t..k
Ouébec ~;:of1F1C: WSl 1" T ~ , , r •. T" ~ 400 390 380 370 N 360 :li :g 350 ï ~ 340 .; (,) 320 310 1. 2. 3.4. 5. 6. 7. 8. 9.1011121314151617181920212223242526272829301.2.3.4. 5. 6. 7. 8. 9. 10111213 4 4 4 4 4 4 4 4 4 .4 A A A A .4 A A A A A A A .4 A .4 .4 A A .4 A 5 5 5 5 5 5 5 5 5 .5 .5 .5 .5 DatumFigure Il - Measured capacities at 20 and 60 kHz with the first BSI prototype
At the end of the winter season, the system was dismounted and the data were evaluated. Figure 12 shows a comparison of the measured capacities of the BS! with the laboratory test set-up (HP 4192).
180 160 140
u:-
120 1.e
ti---
~. Z. 1001
:
-
10
kHz BSI '(3-
~ ~ 1J
'"
80..t---'
r> L.LJ ~-
10
kHz HP a.'1
...
'"
60 (.) -40 20 0 ç' ç' ç' ç' ~~.:.. ~~.:.. ~~.:.. ~:'?' ~'?' -.;'?' ~'?' <0 ,'1: Of"
1- 'V"
Figure 12 -Comparison of measured capacities at 10kHz of BSI with laboratory set-up (HP) at the Swiss test site.
It can be seen, that the measured capacities with the BS! ( in blue) are somewhat higher than with the laboratory device, but seem more stable, showing a better signal quality and less deviations. Since no adequate calibration of the BSI prototype was possible so far, the measured capacities were corrected by this offset for calculating the dielectric constants as weIl as the densities and the liquid water content of the snow pack, so that they could be
compared to the data acquired with the laboratory test set-up.
Figure 13 shows the deterrnined dielectric constants for certain low frequencies during the test period. The 2004 data are comparable to previous measurements with the laboratory test set-up, yet at the end of the winter, the values tend to be too high. Two reasons could explain this effect, one being the provisional rough calibration, the
EU-RTD
PrOjecr-Y'---Forschungslentrum Karlsruhe
TechnJto; und UrTrMt~ . '
I • . -...
OW-• InSlltut national dei. rech.rche Klentlflque
IHRS [ l [
Hydro
.a
~~~
~~
Québec ~ ~".,~
SNOWPOWER
s
KTH
second being another preferential water flow along the cable at the end of the melting season. It also tumed out that when only low frequency measurements are used it is qui te difficult to detect the exact cable length in snow (due to installations with spring bearings). This could also contribute to the high values at the end of the season.
50 45
-
40 c::: C'O 35-
III c::: 30 0 (.) (.) 25 'C-
(.) 20 ~ 15 QI 0 10 5 0 03. Apr - 6kHz 10kHzr -______________________________ ~--~~ 20 kHz 50kHzr---~~~~ ~* #ct , . . uniJai •
13. Apr 23. Apr 03. Mai 13. Mai 23. Mai 02. Jun 12. Jun 22. Jun 02. Jul
Figure 13 -Dielectric constants at low fTequencies (6, 10,20,50 kHz) determined with BSl at the Swiss test site
Figure 14 shows a comparison of the measured densities with manual reference measurements taken every fortnight. Also the snow depth is shown. It can be seen that the measured BSI densities correlate weil with the reference measurements and also the decrease in the average density of the snow pack due to new snow fall is monitored perfectly. Only at the end, the values again tend to be too high, because of the same reasons as described in the previous paragraph.
800 260 240 700 220 '7 E 600 200 CI x. - 500 l:' 180 'iii 160 c: CIl 400 0 140 300 120 200+----,---,----,---, - - - - , - - - - , ,- - - -r ----,---+ 100 03. Apr 13. Apr 23. Apr 03. Mal 13. Mal 23. Mal 02. Jun 12. Jun 22. Jun 02. Jul
Figure 14 -Corn pari son of BSI density rneasurernents (based on 6 and 50 kHz) with rnanual reference measurements together with snow depth measurements (in cm) at the Swiss test site.
The estimated liquid water contents during the test period is shown in Fig. 15. Also, the registered accumulated outflow ofliquid water at the Iysimeter is shown. Although, there is a good correlation between the accumulated outflow and the shape of the curve of the liquid water contents, the absolute values for the water content are far too high, again as a result of the reasons described.
EU-RTO
prOjecr+-SNOWPOWER
~ 16 ~ 0 , 14 '0 ~ 12-
c:: 10 41-
c:: 0 8 Co)...
6 41-
lU ~ 4 :E :::l 2g
0 Forschungszentrum KarlsruheTechmk und UrT'l'.w~
s
cÎV\
er
"
,. __ ... do""""
• In.Jthut na,Jonal de la recherche K~ntlflqu.
IHRS HF Hydro
,a
~~
~~
Québec ~ ~ >h~ 500 450 400 0 ~ 350 ~ 300 0 U 250 Co) lU 200-
...
41 150 41 E 100 ëii 50 ~ 003. Apr 13. Apr 23. Apr 03. Mai 13. Mal 23. Mai 02. Jun 12. Jun 22. Jun 02. Jul
Figure 15 - Comparison ofliquid water content measurements ITom the BSI prototype (based on 6 and 50 kHz) with
accumulated outflow of the Iysimeter at the Swiss test site.
As a conclusion of the first field test of the BS! it can be stated, that the system worked failure-free for nearly 4 months in the harsh Alpine environment and has the potential to become an operational tool for the determination oflarge-scale snow pack density, liquid water content and snow water equivalent. Yet sorne fine-tuning of the system is still necessary to obtain adequate absolute measurement values. Therefore an adeguate calibration with materials comparable to snow is indispensable. Yet one must not underestimate the efforts for an adequate calibration, such as availability and homogeneity ofthis adequate materials.
Further detailed analysis of the SNOWPOWER-sensor measurements at Weissfluhjoch/Davos from winter 2002/03 were made. The frequency dependence of the impedance measurements (low frequencies), as weil as the temperature influence on these results were investigated. Also, a method to calculate the spatial variation of liquid water content along horizontally installed SNOWPOWER cables at a certain depth in the snow pack from the high frequency data was developed at SLF using a simplified differential algorithm, as an alternative to the more computationally demanding inversion technique. Figure 16 shows the preferential flow patterns of the melt water that was detected with this new algorithm.
Additional calculations were made at KTH concerning the electromagnetic behaviour of the cable sensors.
The series resistance R was calculated from analysis of the fields around the conductors. Typical values for the even mode are 0.5 ohm/m at 100 MHz and 1.2 ohm/m at 500 MHz. Hence, for longer cab les (> 1 0 m) the attenuation due to R should be compensated for in the reconstruction algorithm. Regarding unsolved pitfalls in the usage of the sens or cable, the problem with mode-scattering has been investigated theoretically and experimentally. With its three conductors the cable supports two fundamental modes, which propagate with different velocities. Since the reconstruction algorithms presuppose that only one fundamental mode exists along the cable it is of importance that the other mode is suppressed effectively. Enhanced scattering between the modes may occur along a portion of the cable where the surrounding media go es through rapid changes especially, when going from a symmetric to an asymmetric distribution with respect to the cable cross-section. The results show that mode-scattering degrades the resolution of the reconstruction. Mode-scattering also makes the cable more sensitive to extraneous radiation, since the unwanted odd-mode is more receptive for radiation.
EU-RTO
prOject-\f--SNOWPOWER
Forschung,zentrum Karl$ruhe Technlk und UrY'l'N8~
~
S
~
er
fi)
KTHI l'·• - -... -In.lthut na Ilona! d .... rec:hen:he K'-ntlf'lqu. 'HRS HE Hydro
,a
~~
-:At
l.t/<
Québec ~~;tl~ 10~~~~~~~~~~~~~~~~~~~~~~~~~~~ 8~6
~ 4! .. \, .... /
..
....
~_/... 'v q;,~ 2 /,.:~ ~r--~ (\ 3~~~~·~··~·_·~'~~-r~++~-r~++~-r~++~-r~++~-rr+~~ -51 Cl c: ~ 24/04 29/04 04/05 09/05...
II~
~
==~=====:====~
==
==
:=
:J
~II
...
...
vol%o
2 3 4 5 6 7 8 9 10Figure 16 -Preferential flow patterns detected with the high frequency (TDR) rneasurements of the SNOWPOWER sensor.
b.) Contribution of the Canadian partners
The second part of the modified WP 7 was the large-scale field test. Due to the delay and the unavailability of the BSI at the beginning of the Canadian win ter season, the measurements were started with the laboratory test set-up in Southem Canada, with the hope to replace the system with the BSI during the winter 2003/2004. Three flat-band cables about 15 min length (Fig. 17), were installed at an agricultural field in the Bras d'Henri sub-watershed of the Chaudière-River, at 45 km south of Quebec city, P.Q., Canada (48°28'12" N, 71"10'48"W) Fig. 2. The field has a mostly flat surface with a slope of 0-0.5%. The field site is equipped with numerous meteorological instruments. A picture of cable is shown in Figure 17.
The physical installation of the sensor was developed around three objectives: (1) to test different support types and to find the one most suitable for northem environment (low temperature et high wind speed); (2) to acquire data on a larger surface for inputs into hydrological models and comparison with remote sensing data and (3) to get a diversified datas et of vertical properties of the snow pack (snow depth, density profile, SWE) in order to better validate the measurements. We designed a "star shaped" installation using three slopping cables at an angle of28° from the ground, starting from a central point (1.2 m above the ground) (Fig 2). The electronic measurement devices of the system were placed in the shelter approximately 15 m away from the cable sensors. In the following only the evaluation of the one slopping cable is shown.
EU-RTD
PrOjeC~
SNOWPOWER
Forschungszentrum Karlsruhe
Techmk und UrTl'N8lt
s
c};<.,
er
KTH
,,
.
'
• . -In.ultut nal.
.
.
.
"
-
lonsl de 1. '.cherche s.denttf1queINRS HF
Hydro
~
~~A
~~
Québec ~ >f1~
WSL ' " •
Figure 17 - Test-site localisation and SNOWPOWER cable installation at the agricultural field
The measurements started on February 17, 2004 and ran automatically until the end of the winter season (March 26, 2004). With the exception of sorne days, where a short circuit prevented the electronic measurement devices from running, the electronic system ran more or less failure-free throughout March 26. Two times per week, six snow cores were collected to measure snow depth (cm), SWE (mm) and the mean snow density (kg m·3) around the flat-band cables. In the same time a snow profile, giving the snow
temperature, density and snow liquid water content at every 10 cm, was also done. The Denoth Meter, Snow Density Sample and Dial Stem Thermometer were used for snow water content, snow density and snow temperature measurements respectively.
The meteorological conditions during the 2004 winter in Quebec (Canada) can be seen in Fig. 18. During February 2004, no rain or melt had happened leaving the snow cover relatively dry. The air tempe rature stayed below the freezing point. The most snow accumulation had happened in this period. At the beginning March (1 and 2) the first rains occurred with an increase of the air temperatures steadily above zero. This period is followed immediately by a fall of the air temperature below O°C and the snow then refroze completely. 30,---, 30 25 Ê20 .§. s:::
:8
15 ~ ï5. ï) I!! 10 0. 5 ~Rain(mm) c::::J Snow (mm)- - fv1ean daily air temperature (oC)
Wind speed (mIs)
20 '0 <l> <l> a. 1/1 10 ~ ~
I\A
... . ...
···V···~ 0 p--10 -; :::l ~ -20 ~ E .! 0+-~~~~~~-r~~~-.~~~~~-rT-~~~~,-~~ -30~Figure 18 -Meteorological conditions in winter 2003/2004 at the Quebec experimental site.
EU-RTD
prOjecr+--SNOWPOWER
FOfschungo;zentrum Karlsruhe Technlk und Un'J'NeM:
Hydro FNA ~
L.r-~
SLF
·*v
Ouébec WSl ~;:tl~
An intensive melting cycle began at March 26 with significant rainfall events and a significant increase of the air temperature. Due to the important wind speed (because the test site is located in an open area) and the frequent rainfall events, the snow pack stayed relatively compacted (density > 300kg!m3) during the study
period.
Unfortunately, the BSI was not be available during the Canadian winter season and then the large-sc ale field test could not be carried out. But nevertheless, important field tests and evaluations of the method conceming rnainly the temperature influence and the dielectric properties of the cold seasonal snow pack in Canada could be carried out.
First, the influence of the variability of the temperature within the snow coyer on the accuracy of the density determination was tested. As explained in previous reports the snow temperature has a considerable effect on the permittivity of ice Eice and then on the snow density and on snow water content determination.
The mean value of snow temperature profile can provide a representative value in alpine conditions where the vertical variations are not significant. But, in cold seasonal and shallow snow pack as Canadian conditions these variations can be important (Table 1).
Table 1 - Snow depth, surface and air temperature, mean and standard deviation of snow temperature profiles for study dates around the flat-band cable.
Date Depth (cm) T(°C) Surface TeC) Air Mean St. Dev.
17-02-04 67,00 -10,00 -13,68 -10,22 6,61 24-02-04 82,00 -9,75 -12,00 -3,40 2,08 01-03-04 73,00 0,00 3,00 -3,07 1,29 03-03-04 70,00 0,00 1,00 0,00 0,00 05-03-04 71,50 -1,50 -1,50 -1,75 0,84 10-03-04 68,00 -1,50 -6,00 -2,88 1,89 16-03-04 68,50 -1,50 -7,00 -2,43 2,02 24-03-04 68,00 -3,00 -5,00 -2,94 0,98 26-03-04 62,00 0,00 5,00 -1,43 0,42
The temperature gradient in a snow pack depends on many factors including the temperature difference between the air and the soil, the snow density, and the thermal properties of the soiL These factors are varying spatially and temporally in northem conditions. One has to take into account that the temperature gradients generate a change in the snow structure (melting process, ice up process) which has a large influence to the snow density and to the snow liquid water content. That leads to develop news methods for temperature calculation in order to find a representative value. The following three assumptions were evaluated:
a) Cable temperature calculated at the mid-point of the cable: ( hl + h2 )
Tcable = Tsnow 2
=T (h )+(h1 +h2 -h ) Tsnow(h2)-Tsnow(h})
snow 1 2 1 h2 - hl
(hl + h2)
Tsnow 2 is the temperature at the mid-point of the cable calculated by linear interpolation between lower and upper positions of the cable in the snow, which are hl and h2
EU-RTO
prOjeC~
For!ii.chungszentfum Karlsruhe
Tech!1lk und Umvve~
SNOWPOWER
s~H\er
b) Cable temperature calculated as a weighted average of aU temperatures (linear intemolation)
The average cable temperature is calculated as a weighted average of aU available snow temperatures along the cable. It can be expressed as an integral of the snow temperature function Tsnow(x) divided by the length of the cable (integral of dx), with the limits Xl and X2 equal to the lower and upper positions of the cable in
the snow:
Tcable
In our case, Tsnowrx) is approximated by linear function of depth, we can make a summation of the middle point temperature between each thermometer positions pair multiplied with the corresponding distance, and divide the sum by the totallength.
L
(Tsnow,i +Tsnow~+l)X (xi+l -xi) i=l,n-lTcable = '
-c) Cable temperature calculated at the at the weighted average of aU temperatures (spline interpolation) The average cable temperature is calculated as a weighted average of aU available snow temperatures along the cable by using cubic spline interpolation:
L
(Spline(H snow, Tsnow , hl + (i - 1) x 5 + Spline(H snow, Tsnow , hl + (i x 5)) x 0.5 x 5i=l,n-l
Tcable = '
-Hsnow and Tsnow are vectors containing the measured vertical profile of snow depth and snow temperature respective1y.
ô is the mesh of the interpolation. ô is set to 0.01.
Figure19 shows the comparison between the three methods of calculation for the snow temperature along the cable. It can be noticed that the average snow temperature calculated with the linear interpolation and that calculated with the cubic spline interpolation gives almost similar results (less than 0.5°C). That can be explained by the finesse of the resolution of temperature data (10 cm). Nevertheless, we can see a light difference at February 17 and at March 16 when the snow temperature profiles were very variable.
At March 3, the three methods give the same results because the snow pack was completely in an isothermal state. As expected, on February 24 when the snow accumulation is at maximal accumulation (tablel), the average temperature calculated at the midpoint of cable over-estimates the temperature compared to the two others methods.
Obviously the different results between these three methods are mainly dependent to the vertical variability of the temperature in the snow pack.
EU-RTD
Projecr+-SNOWPOWER
1 0 -1 -2 -3 -4e
-5e
-6"
~ GO -7 CL -8 E GO 1- -9 -10 -11 -12 - - - ' -13 -14 :::J :::J :::J ...'"
.j>.'"
.j>. :1 0 0 0 0 0 0 0'" '"
'"
'" '" '"
'"
'" '" '"
'"
'" '" '"
0 0 0 0 0 0 0'i1 'i1 0 0 0 'i1 0
.j>. .j>. .j>. .j>. ~ ~ :::J
m
'"
01 (J) ~ Oi :,;. W N Oi Oi Q) CD CD CD 01 CD'"
Forschungs:zentrum KarlsruheTechnlk und Um~n:
s~~r
\ . _ - - - - _ /"
e!
SLf •* /.;
Hydra fNA~t..r--Québec ~ ;,f1 ~ WSl "T' .. ..----_._#---Tcable at midpoint of the cable
Tcable with linear interpolation
- - - . - Tcable with cubic spline interpolation
0 0 0 0 0 ~ ~
m
'"
'"
'"
'"
'"
01 ~ 0 0 0 0 (J) (J) (J) (J) (J) 0 0 0 0 0 0 0 0 0 0 0 0 0 0 0'" '" '" '" '"
'"
'" '" '"
i-''" '"
'" '" '"
'"
0'" '" '" '" '" '" '" '"
0 0 0 0 0 0 0 0'"
0'" '" '" '" '"
0 0 0 0 0 0 'i1 'i1 0 'i1 'i1 0 'i1 'i1 'i1 'i1 'i1 0 0 'i1.j>. .j>. .j>. .j>. .j>. :::J :: ~ ~ ~ :: 0 ... !'! ~ 0 (J) ... 01 ...
'"
oô ë Oi ~ 0m
0 Oi :,;. ~ N c:;; ë :,;. W Q) Q)'"
... Q) CD 01 01 01'"
Figure 19 -Comparison of the three methods oftemperature calcu\ation
To see their impact on snow density and snow liquid water content, the results are compared with manual observations. In the same time we evaluated the influence of the exponent mixing-rule-factor (a) which can also have an effect on the results. Three values of a are tested: 0.3 (Looyenga) and 0.3333 and 0.5 (Birchak). AlI simulations are based on measurements taken at the 30 kHz frequencies and with the TDR. The air gap phenomena around the cable were not noticed during the study period, so that only results of the small connection are shown here.
Then, Figure 20 shows the simulated snow densities using the three methods of temperature ca1culation in comparison with manual observation for 0.=0.3. It can be seen that the two interpolation (cubic spline and linear) methods give the same results because their average cable temperatures are almost similar. Maximum differences between the two interpolation methods and the temperature at the midpoint of cable occur at February 24th (about Il kg/m3) and March 10 (about 10 kg/m3). These differences are not significant
compared to the temperature differences.
We can also notice that the simulations results are not in agreement with the manual observations on February 24 , March 10 and March 26. At February 24, the snow depth was at the maximal height (82 cm), and the air temperature was steadily under
oDe.
The snow was dry and the snow -soil interface was covered by crust ice caused by water percolation. The cylindrical snow sampler can not reach the snow -soil interface. At March 10, due to the important preceding rainfall events, combined with a decrease of air temperature (Fig.4), the snow was dry and also very hard. Despite all this incoming water from preceding dates, the wet front advance was limited to the top layers because of the low temperatures in the snow pack. As mentioned by [7] when the water percolates from the surface to the underlying and below zero snow layers, the water front advance tends to create both ice fingers and horizontal ice layer. So the underlying layers stayed relatively cold and dry on March 5th at night (0:00) and March 6 in spite of the rain. On March 26, the melting period was intensive and rain event occurred. AlI snow layers shown significant liquid water (>3%).EU-RTO
prOjeC~
Forschungszentrum Karlsruhe
Tech!1lk und Umv.'e~
", :=;:':.=dela
INRS ETf noc_.clen.lflqueSNOWPOWER
s~~r
Hydro Québec,a
\~~~ ~~
~;;fl~475,---, 450 425 ",- 400
.ê
~ 375 Z. 350 ïii ~ 325 'g ~ 300 oJ5
275 250 225 ... ' r :'~ '\ / x .. 'x' .. '- - - - cubic spline interpolation linear interpolation ., midpoint of cable x obsen.ed density
200+-,,-,-,-,,-,-,,-,-,-,,-,-,,-.-,-,,-~
Figure 20 - Simulated snow densities using the three methods oftemperature calculation and in comparison with
manual observation. a=O,3,
Figure 21 presents the results of simulated snow water content in comparison with manual observation. Snow water content obtained by the Denoth-Meter is weIl in agreement with the simulations results and the three methods of temperature calculation give the same results (about 0.02% of difference). We can see clearly, the two periods when the snow was wet: 1) at March 3 where the snow pack was an isothermal state and it had rained one day before at March 2, and 2) at March 26 during the intensive melting period.
6 5 ~ ~ 4 ë QI
-
c 3 0 u "-QI 2 ni ~ 0 - ' -...j 0 N N 0 0 .:.. - ' w e:;, 0>----cubic spline interpolation Iinear interpolation ... midpoint of the cable
obsen.ed liquid water
- ' - ' - ' N N 0 0 0 0 -...j -...j -...j .:.. .:.. - ' w w W 0 0 0 0 0 0 0 0 0 N N N N N ~ W W W N N N N N N N N N 0 0 0 0 0 0 0 0 0 0 0 0 0 0 0 0 0 0 .:.. .:.. .:.. .:.. .:.. .:.. .:.. .:.. .:.. - ' - ' - ' - ' - ' - ' - ' - ' - ' .:.. 01 0> ~ -...j 0> CJ) -...j -...j
:,;. (.) N e:;, e:;, - ' ë e:;,
cs:> cs:> cs:> 01 cs:> W 0> 0> 0> 0 01 0 W N 0 0 .:.. - ' N 0 - ' - ' - ' - ' - ' - ' - ' - ' N N 01 0 0 0 0 0> 0> 0> 0> 0> 0> 0 0 0 0 0 0 0 0 0 0 0 W W W W W W W W W W w N N N N N N N N N N N 0 0 0 0 0 0 0 0 0 0 0 0 0 0 0 0 0 0 0 0 0 0 .:.. .:.. .:.. .:.. .:.. .:.. .:.. .:.. .:.. .:.. .:.. - ' - ' - ' - ' - ' - ' - ' - ' - ' - ' N ~ 0> 0> -...j .:.. 01 CJ) -...j N W ë - ' ë e:;, :,;. (.) N - ' ë (.) N N 0> -...j 0> cs:> .:.. 01 01 01 01 0>
Figure 21 - Simulated snow water content using the three methods oftemperature ca1culation and compared with
manual observations. a=O.3.
EU-RTD
Projec+-Forschungszentrum Karlsruhe
Technik und Utn'Nelt
SNOWPOWER
s~~r
Hydro Québec~
WSl . FNA~l..r--SLF
~~;.f1-f"·*v
Figures 22 and 23 show the simulations results when the Looyenga's exponent mixing-rule-factor ais at the fourth order. With the exception of the problem of the three measurements points surrounded in the preceding section, the simulations results are wellin agreement with the observed snow densities and snow liquid water content. The two methods of temperature interpolation (cubic spline and linear interpolation) giving the same results seems to be the best methods. For the snow density, the mean relative error is 3.12% and the mean absolute error is 11.50 kg/m3. If we select only the reliable field density measurements, the
relative error became 0.70% and the absolute error 2.50 kg/m3 only. For the snow liquid water content the mean relative error is 0.62% and the mean absolute error is 0.15%.
When the Birchak's exponent mixing-rule-factor was used (0.5), snow densities were underestimated and snow liquid water contents overestimated.
450,---, M 425 400
.ê
375 CI ~ 350~
c 325.g
300 ~g 275
en 250 225""""""*"""\
~L
/-~"l.
/ ___
" G ·I~
.
. , ..
, ~~",: ' " ' " ' " " " " " '- - cubic spline interpolation linear interpolation " midpoint of the cable
~ obsen-ed density
200+-~~~~~~~~~~~~~~~~~~~
Figure 22 - Simulated snow densities using the three methods oftemperature calculation and compared with manual
EU-RTD
prOjeC~
Forschungszentrum Karlsruhe
Technlk und U!1l'Nett " , ~':t=deIaNKhe«:he..-tlflque INPS ETE
Hydro
,a~~~~~
Québec ~ ~;:f1~SNOWPOWER
s~~r
5 4,5 4 ~C
3,5 'E 3 CIl-
1: 2,5 0 u 2...
.2! 1,5;
0,5 0- - cubic spline interpolation linear interpolation ... midpoint of the cable
x obser..ed liquid water
r----\
1
le \ 1 ' · . 1 ~ x 1 --r-r---r---"r*ï'--,-' I i i 1 -'--'-~--Î*-'-ï-~t---Î~-'---r ··-T--~1
j ; ! j ~~~~NNOOOOOO~~~~~~~~~N ~~~~~~~WWw~~oooommmmmm 0 0 0 0 0 0 0 0 0 0 0 0 0 0 0 0 0 0 0 0 0 0 ~~~~~~WWWWWWWWWWWWWWWW NNNNNNNNNNNNNNNNNNNNNN 0 0 0 0 0 0 0 0 0 0 0 0 0 0 0 0 0 0 0 0 0 0 ~~~~~~~~~~~~~~~~~~~~~~ ~~~~~~~~~~~~~~~~~~~~~~ w~~mw~mm~~~N~mm~~~~~~w ~~w~~~~~ë~~ë~ë~~WN~OWN ~www~WwœOOOONNm~ooW~rnrnrnrnmFigure 23 - Simulated snow liquid water content using the three methods oftemperature calculation and compared with manual observations. a=O.3333.
It can be concluded that the integration of all available snow temperature measurements along the cable is the best method to provide a representative value of the cable temperature when strong variability in the temperature profiles are observed. Results show that the 30 kHz is the best low frequency to be used jointly with the 200 kHz or the TDR capacitance measurements for the determination of the snow density when the snow pack is dry. The best accuracy for snow density based on 30 kHz and TDR (a = 0.3333) shows a
relative error of 2,75% or 10 kg/m3 compared to snow profile data collected at the entry of the cable in the snow. When the snow is wet, the combination of 30 kHz and TDR measurements gives more accurate results than the combination of two low frequencies measurements. The mean relative error on the liquid water content then was 0.54%.
Finally some tests have also been conducted by Hydro-Quebec with a perforated thick probe to see if this could improve sensibility and reduce wind induced movements. We experienced that the best mechanical compromise for rigidity conservation and easiness of fabrication process consisted in a series of round holes, located aIl along the probe on each side of the middle conductor. Unfortunately, sensibility will have to be more documented in a future measurement campaign, as no significant snow fall has been recorded after the deployment of a perforated probe near Montreal (Southem Quebec) in last January. As a matter of a fact, measurement comparison made at this point, between perforated and non perforated probes, did not allow us to conclude safely on the advantage of a perforated probe, as we don't have data over a sufficiently representative period of time.
3.2.5 Work package 8
In addition to the dissemination activities made since the beginning of the project and discussed under the management aspects in the previous progress reports, the WP 8 was begun in the current period. This involves attempts to estimate the potential market for the Snowpower-System. In addition to existing contacts with the Norwegian companies Statkraft and Sintej, additional contacts were established with the Norwegian company Sensortekknik.