2
Université de Montréal
The biasing of the 5-HT
4receptor as an antidepressant
target
ByGiacomo Trottier
Department of Pharmacology Faculty of Medicine
Thesis presented to the faculty of medicine to obtain the degree of M. Sc.
in pharmacology neuropharmacology option
April, 2017
3
Résumé: La dépression majeure peut être très dommageable pour le 8% des Nord-Américains qui en souffriront au moins une fois durant leur vie. Les traitements actuels de la dépression ont été créés grâce à la compréhension de l'hypothèse de la monoamine; où les transporteurs de la sérotonine ou les enzymes sont bloqués ou inhibés afin de maintenir le neurotransmetteur (NT) dans la fente synaptique. Sur une période de plusieurs semaines, cette augmentation de NT encourage la plasticité synaptique, ce qui augmente la sensibilité de réponse de 5-HT dans la fente synaptique. Cette forme de traitement est efficace chez 40% des patients, tandis que les 60% restants ont une réponse partielle ou nulle. Dans les modèles de dépression chez la souris des changements dans les niveaux de phosphorylation de CREB sont corrélés aux effets antidépresseurs (AD). Dans le cas RS67333, des effets AD apparaissent après 2 à 3 jours de traitement. Les effets anti-anhédoniques sont démontrés par la réponse au traitement. RS67333 est un agoniste spécifique du récepteur 5-HT4, un récepteur couplé à la protéine G (GPCR) qui est généralement situé, après synapses, dans les régions du système limbique. Il existe d'autres ligands qui sont également spécifiques au récepteur 5-HT4: 5-HT, Zacopride, Prucalopride et ML10302, mais les mêmes effets anti-anhédoniques constatés lors de RS67333 n’ont pas été observés. Comment RS67333 est-il différent des autres en termes de signalisation? Nous avons utilisé le transfert d’énergie par résonnance de bioluminescence (BRET) pour étudier les interactions 5-HT4R avec les sous-unités, α β γ de la protéine G et nous avons comparé ces associations avec d'autres agonistes connus de 5-HT4. Nous avons constaté que RS67333 est un agoniste partiel et qu’il active un changement conformationnel de la protéine Gαs, mais n’active pas un changement conformationnel de la protéine Gαo. Prucaloride, 5-HT et Zacopride induisent aussi un changement de conformation du complexe Gαs, mais pas ML10302. Pour la formation de Gαo, Prucalopride, ML10302 et 5-HT agissent comme des agonistes, mais pas zacopride ni RS67333. Nous avons utilisé un test de dosage immuno-enzymatique sur support solide (ELISA) pour mesurer l’intériorisation induite par les ligands pour étudier la régulation des récepteurs. Nous avons constaté que RS67333 et ML10302 n’induisent pas l'internalisation du récepteur, tandis que zacopride, prucalopride et 5-HT sont très efficaces. L'efficacité sous-optimale des ADs actuels met l’accent sur la nécessité de développer des médicaments avec d'autres mécanismes d'action. RS67333 a des effets persistants anti-anhédoniques après une courte période de temps, et d'autres études de ses propriétés de signalisation pourraient donner lieu à une nouvelle génération d’antidépresseurs
4 rapides de longue durée d’action.
Mots-clés: 5-HT, RS 67333, BRET, AD, antidépresseur, CREB, anhédonie, zacopride, prucalopride, ML 10302, GPCR, récepteur 5-HT4, sélectivité fonctionnelle.
5
Abstract: Major Depression can be very damaging on the 8% of North Americans that will have it at least once within their lifetime. Current treatments of depression have been
developed through the understanding of the monoamine hypothesis; whereby serotonin (5-HT) transporters or enzymes are blocked or inhibited in order to maintain the neurotransmitter in the synaptic cleft. Over a period of several weeks this increase in NT induces synaptic plasticity which increases the response sensitivity of 5-HT in the synaptic cleft. This form of treatment is effective on 40% of patients, while the remaining 60% have partial or no
response. In mouse models of depression, changes in phosphorylation levels of CREB
correlated to antidepressants (AD) effects. In the case of RS67333 AD effects appear within 2-3 days of treatment. The response can be evidenced as anti- anhedonic. RS672-32-32-3 is specific agonist for 5-HT4 receptor, a G protein coupled receptor (GPCR) that is typically located post synaptically, in limbic regions. There are other ligands that are also specific to receptor 5-HT4: 5-HT, Zacopride, prucalopride and ML10302, but have not been observed to have the same anti-anhedonia effects of RS67333. How does RS67333 differ from the others in terms of signaling? We used bioluminescence resonance energy transfer (BRET) to study the interactions of 5-HT4R with the α β γ subunits of the G protein and we compared these associations with other known 5-HT4 agonists. We found that RS67333 was a partial agonist and activated a conformational change of the Gαs protein but did not activate a conformational change of Gαo protein. Prucaloride, 5-HT and Zacopride also induced a conformational change of the Gαs complex but not ML10302. For the formation of Gαo, Prucalorpide, ML10302 and 5-HT acted as agonists, but not Zacopride. We used an ELISA assay to measure ligand induced internalization to study receptor regulation. We found that RS67333 and ML10302 did not induce receptor internalization, while Zacopride, Prucalopride and 5-HT were very effective. The suboptimal efficacy of current ADs stresses the need to develop drugs with other mechanisms of action. RS67333 has persistent anti-anhedonia effects after a short period of time and further studies of its signalling properties may open up a new generation of fast and long acting antidepressants.
Keywords: 5-HT, RS67333, BRET, AD, antidepressant, pCREB, anhedonia, Zacopride, prucalopride, ML10302, GPCR, 5-HT4 receptor, functional selectivity.
6
Table of contents
Introduction………17
1. Socio-economics of depression………17 2. Symptoms………17 2.1. Current Treatments………...………18 3. Depression hypotheses……….………19 3.1. Monoamine hypothesis……….………19 3.2. Neurotrophic hypothesis………...……20 3.3. New pathophysiology………...………203.4. 5-HTR G-protein coupled receptors……….……21
4. 5-HT4 receptors………22
4.1. Locations and agonists……….………22
4.2. 5-HT4R and depression research………..………23
5. G-proteins………25
5.1. G-proteins and GPCR………...………25
5.2. Gα subunit………27
5.3. Gβγ subunits………29
6. The cAMP pathway………30
6.1. Secondary cascade………30
6.2. Downstream targets………..30
6.2.1. CREB……….30
6.2.1.1. CREB and plasticity………...30
6.2.1.2. CREB and antidepressant treatment………..31
6.2.2. BDNF……….32
6.2.2.1. BDNF-mediated neural regulation….………32
6.2.2.2. BDNF and depression………33
7. Regulation and desensitization………33
7
7.2. Arrestins………35
8. Hypothesis of work………..36
9. Goal of project……….36
Methods and Materials……….37
1. pCREB Measurements in striatum and nucleus accumbens in OBX versus sham rats………....37
1.1. Olfactory bulb ablation……….37
1.2. Preparation of brain samples.………....37
1.3. Membrane preparation………..…38
1.4. Preparation of SDS-PAGE………...38
1.5. Western blot analysis………....38
2. BRET Comparisons between RS67333, 5-HT and other ligands………....39
2.1. Cell culture………39
2.1.1. Cell line 5-HT4b………..39
2.1.2. Transfection of HEK 293 immortal cell line….……….…39
2.2. BRET….………....40
2.2.1. DNA constructs………..…40
2.2.2. BRET analysis……….………...40
2.2.3. BRET theory………..41
3. Ligand induced internalization studies………....41
3.1. ELISA assays of cell internalization……….41
3.2. 5-HT4 receptor ligands……….….………42
4. Statistical analysis………42
Presentation and analysis of results……….44
1. Olfactory Bulbectomy and and pCREB in striatum and nucleus accumbens….…44 1.1. Sucrose intake changes in pCREB………...……44
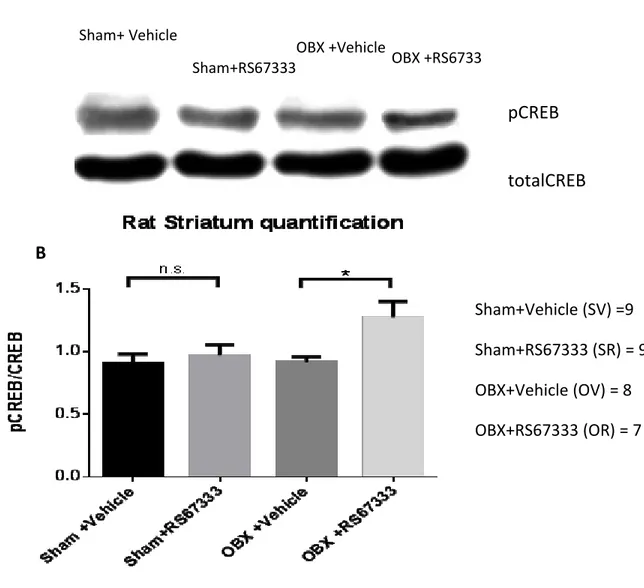
1.2. Rats treated with RS67333 had increase in pCREB……..………...……44
1.3. Rationale for Bioluminescence resonance energy transfer experiments…..…47
8
2.1. Bioluminescence resonance energy transfer (BRET) ………..………47
2.1.1. 5-HT4 receptor ligands dose response……….………..……48
2.2. Gαs………48
2.2.1. EMax and EC50 ………...……48
2.3. Gαo………51
2.3.1. EMax and EC50……….……51
3. 5-HT4R ligand induced internalization………51
4. 5-HT4R ligand profiles……….………55
Discussion……….57
Conclusion………61
9
List of tables
Table I. Emax and EC50 values obtained from dose response curves generated of 5-HT4 receptor ligands as measured by a BRET through αsRlucII/γ2GFP10 interaction………50 Table II. Emax and EC50 values obtained from dose response curves generated of 5-HT4 receptor ligands as measured by a BRET through αo/γ2 interaction………..53 Table III. Emax and EC50 values obtained fom dose response curves generated by 5-HT4 ligands
as measured by ELISA through internalization of 5-HT4B receptors……… 55 Table IV. The 5-HT4 receptor ligands profiles………..56
10
List of figures
Figure 1. The normal processes of 5-HT and noradrenaline neurotransmission…………...…19
Figure 2. Activity-dependent BDNF hypothesis of depression……….21
Figure 3. The mechanism of action of specific 5-HT re-uptake inhibitors………23
Figure 4. Distribution of 5-HT4 receptors in the brain………..24
Figure 5. G-protein-coupled receptor (GPCR)-mediated G-protein activation……….25
Figure 6. Heterotrimeric G-protein activation in the context of GPCR signaling……….26
Figure 7. cAMP stimulates CREB phosphorylation………..27
Figure 8. Diversity of G-protein-coupled receptor signalling………...28
Figure 9. Regulation of cAMP response element-binding protein by drugs of abuse………...31
Figure 10. G-protein-coupled receptor (GPCR) desensitization, internalization and down-regulation………...34
Figure 11. β-Arrestin-dependent internalization of GPCRs………..36
Figure 12. Effect of selective 5-HT4 receptor ligand RS67333 on the activation of CREB in rat striatum, assessed by measuring phospho-CREB (pCREB) immunoreactivity………45
Figure 13. Effect of selective 5-HT4 receptor ligand RS67333 on the activation of CREB in rat nucleus accumbens, assessed by measuring phosphoCREB (pCREB) immunoreactivity……46
Figure 14. Dose response of 5-HT4 receptor ligands as measured by a BRET-based conformational biosensor monitoring αs/γ2 interaction………..49
Figure 15. Dose response of 5-HT4 ligands as measured by a BRET-based conformational biosensor monitoring αo/γ2 interaction………52
11
Figure 16. Dose response of 5-HT4 receptor ligands induced internalization of 5-HT4b
12
List of abbreviations
5-HT : 5-Hydroxytryptamine (serotonin)
5-HT4a and 5-HT4b : Serotonin receptor type 4a and 4b AC : Adenylate Cyclase
AP: Action potential AP2 : Adaptor complex 2 ATP : Adenine Triphosphate
BRET : Transfert d’énergie par résonnance de bioluminescence BSA : Bovine Serum Albumin
C : Carboxyl Ca2+ : calcium ion
CaMKII : Calcium/calmodulin-dependent protein kinase II cAMP :Cyclic Adenine Monophosphate
cGMP : Cyclic Guanosine monophosphate CREB : cAMP response element-binding protein DAG : Diacylglycerol
DAMGO: [D-Ala(2),N-Me-Phe(4),Gly(5)-ol]-enképhaline DG: Dentate gyrus
DMEM : Dulbecco’s modified Eagle’s medium
DPDPE : [D-pénicillamine2, D-pénicillamine5]-enképhaline EDTA : Ethylenediaminetetraacetic acid
ELISA : enzyme-linked immunosorbent assay Emax : Maximal Effect
13 G -protein: protein activated by GTPase
GABA : gamma-Aminobutyric acid GASP : GPCR associated sorting protein GDP : Guanosine diphosphate
GFP : Green Fluorescent Protein GPCR :G Protein Coupled Receptors GRK : G protein coupled receptor kinase GTP : Guanosine triphosphate
GTPase : Enzyme hydrolyzes GTP
HEK-293 : Human Embyonic Kidney 293 HA : Human influenza hemagglutinin IM : Intramuscular
IP3 : Inositol-1,4,5-triphosphate LTP : Long term Potentiation
MAPK : Mitogen activated protein kinases Mg2+ Ion magnesium
N : Amino
Na+ : Ion sodique nm : Nanometer nM : Nanomolar
NMDA :N-Methyl-D-aspartic acid
OR = Olfactory bulbectomy operation and RS67333 treatment OV =Olfactory bulbectomy operation and vehicle treatment OBX = Olfactory Bulbectomy
14 PBS : Phosphate-Buffered Saline
PEI : Polyethylenimine PFA : Paraformaldehyde
PKA : cAMP-dependent protein kinase PRU: Prucalopride
PTX : Pertussis Toxin
RlucII: Luciferase from Renilla II
SR= Sham operation and RS673333 treatment SV= Sham operation and vehicle treatment VTA : Ventral Tegmental Area
ZAC: Zacopride
β2AR : β-2 adrenergic receptor βarr : βarrestin
15
16
Acknowledgements
First and foremost I would like to give a big thank you to Graciela Piñeyro, my thesis supervisor, and to my co-supervisor, Sandra Boye. They have been very supportive and encouraging even when I run off to join a circus in some country in South America, Europe or Asia. My lab manager Derek Robertson, for being incredibly resourceful, intuitive and an encompassing understanding of science. He was also gracious enough to go through many of the first drafts of this memoire. My lab mate Johannie Charbonneau that also suffered through several of my first drafts. My lab mates Iness Charfi, Hanieh Bagheri, Karim Nagi for being willing to help whenever needed or to end a transfection.
None of this would be possible if it weren’t for my loving parents. Who despite not having a background in science, gave me valuable input for putting this together and help connect ideas together. My brother who was a big help in giving me guidance throughout my work in the lab, course work and life.
My friends Mark and Roxanna, who were there for me without hesitation when I asked them for help in submitting my thesis
I would also like to thank Dr. René Cardinal, Dr. Pierre André Lavoie, Dr. Audrey Claing, and Dr. Guy Rousseau for taking the time out of their busy schedules to review my work.
Thank you,
17
Introduction
1. Socio-economics of depression
The World Health Organization (WHO) has estimated that Major Depressive Disorder (MDD) will be the leading cause of disability by the year 2030 (WHO 2016). If true, this will have major impacts on the delivery of heath care services, and even the economy as a whole. Already mental disorders are the greatest cause of severe functional impairment (42%) compared to chronic physical disorders (24%)(Druss, Hwang et al. 2009). Mental disorders also have lower rates of treatment success (21.4%) compared to chronic physical disorders (58.2%). A further consideration is that physical disorders affect work or home functions, whereas mental disorders are commonly most disruptive to social interactions and close relationships. A depressed individual has a greater need of social support, but tragically, instead of fostering support, mental disorders often disrupt family stability and contribute to the breakdown of relationships, including causing separation or divorce (WHO 2016).
A 5 year study of 2334 participants over 5 years with an annual family income greater than $25,000 USD found that 33% of families with a depressed individual had a family member become newly unemployed compared to 21% of non-depressed families (Whooley, Kiefe et al. 2002). After correcting for confounding factors the association remained highly significant at 17% for depressed families and 7% for non-depressed. The remaining depressed employees that manage to keep their jobs on average lose an estimated 27 days of a year or
~$4400/individual and $36.6 billion dollars US on account of absenteeism and presenteeism (Broadhead, Blazer et al. 1990; Kessler, Merikangas et al. 2008). (Absenteeism is missed work days whereas presenteeism is being present at work, but with a significant decrease in
productivity.)
2. Symptoms
MDD is a disease of mental health that’s characterized by a persistent low mood, low self-esteem. The primary symptom of MDD is anhedonia: a lack of the capacity to experience pleasure. Sufferers of depression feel sadness, emptiness, experience excessive feelings of guilt and/or have suicidal thoughts that may be acted on. It affects women more than men and
18
most often occurs in the fourth decade of life (Kessler, Merikangas et al. 2008). A major depressive episode can be triggered by a variety of factors such as chronic stress, isolation, family loss, failing a class, physical or emotional abuse, or job loss. These episodes typically average 6 months during the otherwise active years of an adult life, resulting in less effective work and more days off. Depression is a burden on the person, the family, the work, and the economy. Those that have suffered already one episode of depression have increased risk of suffering again (Burcusa and Iacono 2007).
To make matters worse, depressed individuals are twice as likely to die from other causes (1.9x for men and 2.1x for women)(Osby, Brandt et al. 2001). These include having twice the risk of coronary heart disease, increased risk of cardiovascular death and stroke (Barth,
Schumacher et al. 2004). Depressed men are 21 times more likely to commit suicide than there non-depressed counterparts, while depressed woman are 27x more likely to do so (Osby, Brandt et al. 2001). There are 120 million persons with MDD worldwide (WHO 2016) and depression has a recurrence of 85% over 15 years (ten Doesschate, Bockting et al. 2010).
2.1. Current Treatments
MDD is currently resistant to treatment, and remission is rarely accompanied by a total disappearance of all symptoms. In general, cognitive impairment and social dysfunction still persist despite treatment with anti-depressants (AD) . The lack of success through AD treatment can be attributed to a lack of progress in the identification of pharmacological targets. Today’s AD targets are similar to those of 50 years ago. Almost all AD drugs act through the serotonergic and/or noradrenergic neurotransmitter systems, and more recently, the dopaminergic system. Treatment efficacy only improves depressive symptoms on two-thirds of those diagnosed with MDD (Nelson 1999). Even if effective, current AD drugs take 3-4 weeks before clinical efficacy can be observed. Nestler and others have postulated that the lag period for their clinical effects is due to the longer time necessary for lasting neuroplastic changes in selective brain regions (Nestler, Barrot et al. 2002).
19 3. Depression hypotheses
3.1. Monoamine Hypothesis
The mechanisms of depression are not fully understood, and one prominent hypothesis is that it is caused by a monoamine deficiency in the brain. This hypothesis was developed by Schildkraut, following the work by Selikoff and Robitzek (Crane 1956) with the drug iproniazid on tuberculosis patient when they found that their patients were “dancing in the
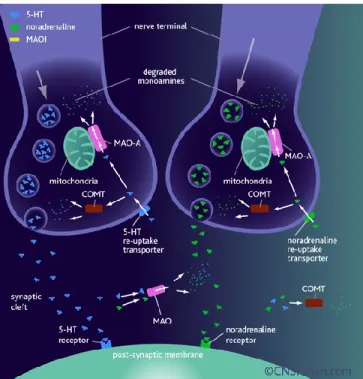
Figure 1. The normal processes of 5-HT and noradrenaline neurotransmission.
When a nerve impulse arrives at a 5-HT or noradrenaline nerve terminal the neurotransmitter is released from the synaptic vesicle into the synaptic cleft. Neurotransmitter molecules bind to their specific receptors on the post-synaptic membrane and the nerve impulse is propagated or inhibited, depending on the receptor type. 5-HT and noradrenaline molecules are then released from their receptors and taken back into the nerve terminal via either the 5-HT or noradrenaline re-uptake transporters. 5-HT and noradrenaline are degraded by monamine oxidase and catechol-O-methyl transferase, these enzymes are found in both the synaptic cleft and in the nerve terminal. (Rang HP 2001).
halls tho’ there were holes in their lungs” following several months of treatment with the drug (Schildkraut 1965; Sandler 1990; López-Muñoz, Alamo et al. 1998). The monoamine
hypothesis was put forward some 50 years ago and proposes that the underlying neuroanatomical basis for depression is the deficiency of central noradrenergic and/or
serotonergic systems (Figure 1) (Schildkraut 1965). Targeting these systems had a tendency in some cases to restore normal function to otherwise depressed patients (Lopes Rocha,
Fuzikawa et al. 2013). While an increase in monoamines is rapidly observed following an acute AD treatment, symptoms only appear to be eliminated after 2 to 4 weeks of chronic treatment (French, Krauss et al. 2013). The Monoamine hypothesis does not provide an adequate explanation for this latency nor does it explain the pathophysiology of depression. This understanding of depression implies a simple explanation for MDD despite the brain’s
20
complicated machinery, describing MDD as the result of an ‘imbalance. But there is a chasm of understanding between treatment and clinical efficacy, yet drugs have been developed only addressing this initial step. They’ve been developed to increase serotonin in the synaptic gap through methods of blocking reuptake receptors or degradation machinery. These drugs fail to reconcile the objective of increased serotonin in this gap or account for the variety of systems in the brain and how they are affected and how it alleviates symptoms of depression. Drugs developed based solely on the monoamine hypothesis do not adequately treat depression (Belmaker and Agam 2008).
3.2. Neurotrophic hypothesis
More recently, there has been mounting evidence that depression is a result of a dysregulation of neurogenesis (Massart, Mongeau et al. 2012). In a depressed patient, there is a reduction of hippocampus size and these patients show greater activity in the atrophy of neurons
(Sivakumar, Kalmady et al. 2015). Research into animal models of depression, as well as human patients treated with ADs, began to exhibit AD effects and had increased neurogenesis in specific regions of the brain (Duman and Monteggia 2006; Krishnan and Nestler 2008; Castrén and Rantamäki 2010). In the areas of the brain specific to behaviour, such as the prefrontal cortex, and the hippocampus (Duman, Heninger et al. 1997). AD treatment has been shown to promote neurogenesis and synaptogenesis in these systems (Czeh and Di Benedetto 2013). Serotonin level is positively correlated with hippocampal neurogenesis (Brezun and Daszuta 2000; Banasr, Hery et al. 2004) and the stimulation of several serotonergic receptors (Radley and Jacobs 2002; Lucas, Rymar et al. 2007). These increases are crucial for the proliferation, differentiation and survival of new hippocampal neurons (Brezun and Daszuta 2000; Kulkarni, Jha et al. 2002; Santarelli, Saxe et al. 2003; Banasr, Hery et al. 2004; Banasr, Soumier et al. 2006; Lucas, Rymar et al. 2007).
3.3. New Pathophysiology
Research efforts have tried to identify molecules and pathways that might be relevant to synaptic plasticity. Several secondary, tertiary, and quaternary messenger cascades have been postulated to occur in response to AD therapy. Neurotrophic factors such as Brain Derived Neutrophic Factor (BDNF) have been found to be essential in these cascades (Figure 2).
21
Antidepressant treatment increases the expression of BDNF in the Hippocampus and Prefrontal cortex (Drevets, Price et al. 2008; MacQueen, Yucel et al. 2008). Exposure to repeated stress causes atrophy of neurons in the hippocampus and prefrontal cortex as well as a loss of glia, necessary for the maintenance and supply of nutrients and oxygen to the neurons (Ogundele, Omoaghe et al. 2014). BDNF is primarily under the control of cyclic Adenine monophosphate (cAMP) Response Element (CRE), suggesting a putative role for the transcription factor CREB as the source of BDNF’s activity-dependent effects. Serotonin receptors (5-HTR) are G protein coupled receptors (GPCR) and some of which act directly on cAMP production in the hippocampus and prefrontal cortex. Thus, targeting 5-HTRs that have specific pathway in certain regions of the brain may be a more effective in the treatment of MDD.
3.4. 5-HTR G-protein coupled receptors
There are 14 receptors specific for serotonin (Palacios 2015). They are labeled 5-HT1 to 5-HT7 and have as many as five isoforms. Receptor 5-HT1 has five isoforms that vary in abundance
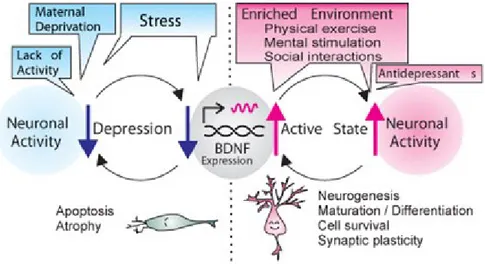
Figure 2. Activity-dependent BDNF hypothesis of depression.
Increased neuronal activity, induced by an enriched environment (e.g., physical exercise, mental stimulation with learning exercise and sensory input, and social interactions) and/or medication up-regulates BDNF expression in the hippocampus and cortex. This, in turn, increases neuronal activity and this positive feedback loop can maintain an active mind state. In contrast, any disruption in BDNF expression, caused by epigenetic regulation processes, stress, and/or reduced neuronal activity, would lead to decreases in neuronal activity and activity-driven BDNF expression. This vicious cycle of decreased neuronal activity and reduced BDNF expression may cause depression (Sakata 2014)
22
and activity all over the body. The receptor 5-HT1A is an isoform that has been implicated in
the modulation of mood and anxiety related behaviours. 5-HT1a knock out mice are insensitive
to the behavioural effects of chronic fluoxetine suggesting that activation of 5-HT1a receptors
is also acritical component in the mechanism of Selective Serotonin Reuptake Inhibitors (SSRI) (Figure 3) (Santarelli, Saxe et al. 2003). The 5-HT1B receptor’s function varies in
function depending on its location. In the frontal cortex it will act as a postsynaptic receptor, inhibiting the release of dopamine. But in the striatum and basal ganglia, it functions as an autoreceptor inhibiting the release of serotonin (Breuer, Groenink et al. 2007). 5-HT1D
receptors act as autoreceptors in the dorsal raphe nuclei, but are also found in the heart where they modulate the release of serotonin (van der Stelt, Breuer et al. 2005). In the Central Nervous System (CNS), 5-HT1D receptors are involved in locomotion and anxiety (Breuer,
Groenink et al. 2007). The function of the 5-HT1E receptors is unknown due to lack of
selective pharmacological tools and permissive animal models. It is hypothesized that the 5-HT1E is involved in the regulation of memory due to its high abundance in the frontal cortex
and hippocampus as well as its high degree of conservative genetic sequence (Chambliss, Van Hoomissen et al. 2004; Breuer, Groenink et al. 2007). 5-HT1F receptor distribution in the
brain appears to be limited but detected in the uterus and in coronary arteries suggesting a possible role in vascular contraction (Pierce and Lefkowitz 2001) and has been targeted in the treatment of migraines (Neitzel 2010). With the exception of 5-HT3 receptor that
homopenteramizes to form a ligand gated ion channel (Niesler 2011), all 5-HTRs are GPCR that activate intracellular secondary messengers which cascade to produce an excitatory or inhibitory response (Qi, Xia et al. 2014).
4. 5-HT4 receptors
4.1. Location and agonists
5-HT 4 receptors are located in the heart, alimentary tract, adrenal and in the central nervous
system structures such as the putamen, caudate nucleus, nucleus accumbens and substantia nigra (Figure 4). They are post synaptic receptors with growing evidence that activation of 5-HT4 receptors is necessary for the treatment of depression (Mendez-David, David et al. 2014).
23
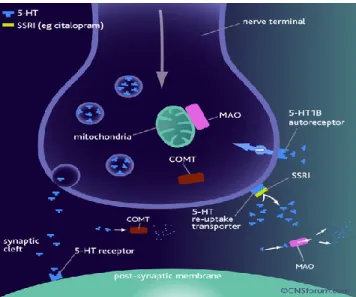
Figure 3. The mechanism of action of specific 5-HT re-uptake inhibitors.
The selective 5-HT re-uptake inhibitors (SSRIs) are thought to restore the levels of 5-HT in the synaptic cleft by binding at the 5-HT re-uptake transporter preventing the re-uptake and subsequent degradation of 5-HT. This re-uptake blockade leads to the accumulation of 5-HT in the synaptic cleft and the concentration of 5-HT returns to within the normal range. This action of SSRIs is thought to contribute to the alleviation of the symptoms of depression. In the presence of the SSRI, small amounts of 5-HT continue to be degraded in the synaptic cleft by monoamine oxidase and other machinery.(Rang HP 2001)
and others currently under study (ML10302 and RS67333) (Lefebvre, Contesse et al. 1993; Briejer, Bosmans et al. 2001; Godínez-Chaparro, Barragán-Iglesias et al. 2011). Zacopride is primarily an anxiolytic but has antiemetic and pro-respiratory effects. Prucalopride is used for the treatment of impaired gastric motility. ML10302 is a partial agonist for receptor 5-HT4 that
may have pro-nociceptive effects (Godínez-Chaparro, Barragán-Iglesias et al. 2011). RS67333 is a partial agonist for receptor 5-HT4 and has been shown to have AD effects in mouse
models of induced depression (Lucas, Rymar et al. 2007). These AD effects are observable after 2-3 days of treatment compared to the typical 3-4 week treatments needed of traditional ADs (Lucas, Rymar et al. 2007).
4.2. 5-HT4R and depression research
A recent study by Mendez et al. (2014) highlighted the importance of the 5-HT4 receptor in
AD treatment (Mendez-David, David et al. 2014). Using a mouse model of depression induced through low doses of corticosteroids over the course of 4 weeks, a known means of inducing a
24 Figure 4. Distribution of 5-HT4 receptors in the brain.
The 5-HT4 receptor subtype is coupled to a G-protein that stimulates the intracellular messenger adenylate cyclase that, in turn, regulates neurotransmission. In the human brain, a high density of 5-HT4 receptors has been identified in the striato-nigral system, notably in the caudate nucleus, lenticular nucleus (putamen and globus pallidus) and the substantia nigra. Lower levels of expression of the 5-HT4 receptor have been shown in the hippocampus and the frontal cortex.(Waeber, Sebben et al. 1993; Domenech, Beleta et al. 1994; Reynolds, Mason et al. 1995)
depressive/anxious state. The mice were then treated with fluoxetine and RS67333 as well as the 5-HT4 antagonist GR125487. The anxiolytic-like effect of fluoxetine and RS67333 was
completely abolished by treatment with the antagonist GR125487. Without the 5-HT4
antagonist GR125487, the anxiety phenotype that was induced was reversed by fluoxetine and RS67333. This emphasizes the importance of the 5-HT4 receptor for the treatment of
depression. The 5-HT4 receptor is important because its activation facilitates the maturation of
newborn neurons in the adult hippocampus (Mendez-David, David et al. 2014). Chronic fluoxetine exposure resulted in an increase in the number of dividing neural precursors in the subgranular zone of the dentate gyrus (DG) (David, Samuels et al. 2009; Rainer, Xia et al. 2012). RS67333 also increased the number of neural precursors in the subgranular zone, but to a lesser extent, 50% vs 170%. The antagonist GR125487 partially blocked this effect during fluoxetine exposure and completely blocked this effect with RS67333 exposure. A 7-day treatment of RS67333 produced anxiolytic and AD effects in many behavioural tests. The results suggest that the anxiolytic effect of RS67333 has a faster onset than fluoxetine and
25
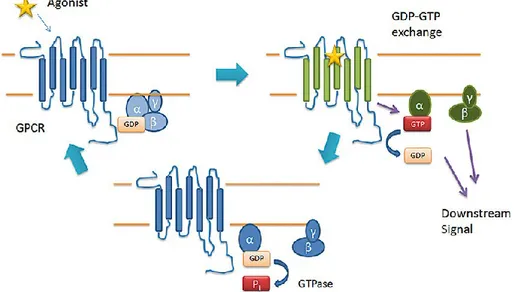
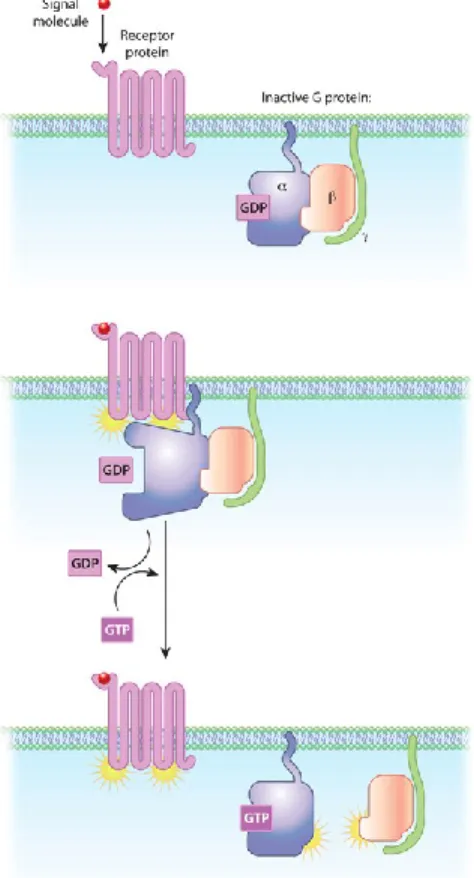
Figure 5. G-protein-coupled receptor (GPCR)-mediated G-protein activation.
In the inactive state, G-proteins exist in the form of an αβγ heterotrimer, with the Gα subunit bound to GDP. Upon receptor activation, either by the binding of agonist or constitutively, the receptor changes to an active conformation (green), thereby activating G-proteins by promoting the exchange of GDP for GTP. The Gα-GTP and Gβγ dimer functionally dissociate from one another and the receptor and are free to modulate downstream effectors. The cycle concludes when the GTPase activity of the Gα subunit hydrolyses GTP to GDP, allowing the Gα subunit to return to its resting confirmation and reassociate with Gβγ.(Smith, Sim‐ Selley et al. 2010)
does not require hippocampal neurogenesis. Zacopride, Prucalopride, RS67333, and ML10302 are all specific for the 5-HT4 receptor, but only RS67333 is functionally selective towards producing AD effects. How does the functional selectivity of RS67333 relate to the activation of the G proteins α, β and γ.
5. G-Proteins
5.1. G-proteins and GPCR
G-proteins are specialized proteins with the ability to bind the nucleotide guanosine
diphosphate (GDP) and guanosine triphosphate (GTP). They consist of three subunits α, β, and γ. The α and γ subunits are attached to the plasma membrane by lipid anchors. The G protein α subunit will bind either GTP if active or GDP if inactive (Figure 5). In the absence of a signal, GDP is attached to the α subunit and the G-protein-GDP complex binds to a nearby GPCR. Upon ligand activation, a change in the conformation of the GPCR activates the G protein and GTP physically replaces GDP bound to the α subunit. Binding of GTP to the α subunit dissociates the G protein into two parts: α bound to GTP and β-γ complex. These complexes are no longer bound to the GPCR, but remain bound to the lipid anchor. They are
26
Figure 6. Heterotrimeric G-protein activation in the context of GPCR signaling.
Whenever a G protein is active, both its GTP-bound α subunit and its β-γ dimer can relay messages in the cell by interacting with other membrane proteins involved in signal transduction. Specific targets for activated G proteins include various enzymes that produce second messengers, as well as certain ion channels that allow ions to act as second messengers. Some G proteins stimulate the activity of these targets, whereas others are inhibitory. Vertebrate genomes contain multiple genes that encode the α, β, and γ subunits of G proteins. The many different subunits encoded by these genes combine in multiple ways to produce a diverse family of G proteins. In this diagram of G-protein-coupled receptor activation, the α, β, and γ subunits are shown with distinct relationships to the plasma membrane. After exchange of GDP with GTP on the α subunit, both the α subunit and the β-γ complex may interact with other molecules to promote signaling cascades. Note that both the α subunit and the β-γ complex remain tethered to the plasma membrane while they are activated. These activated subunits can act on ion channels in the cell membrane, as well as cellular enzymes and second messenger molecules that travel around the cell (Neitzel 2010).
able to diffuse laterally to interact with other membrane proteins. The GTP bound α subunit remains active as long as GTP is bound. When GTP is hydrolyzed back to GDP, the subunits reform to the inactive heterotrimer and associate again with an inactive GPCR (Figure 6).
Both complexes in the activated G protein can relay messages in the cell by interacting with other membrane proteins involved in signal transduction. Targets for activated G proteins
27 Figure 7. | cAMP stimulates CREB phosphorylation.
The binding of ligand to GPCRs that are linked to the stimulatory G proteins, which are comprised of α-, β- and γ-subunits, leads to the activation of AC, which catalyzes the synthesis of cyclic AMP. Increases in cellular cAMP stimulate protein kinase A (PKA) signalling. cAMP binds to the regulatory (R) subunits of PKA, thereby promoting their dissociation from the catalytic subunits. The liberated catalytic subunits enter the nucleus by passive diffusion and phosphorylate the cAMP-responsive element (CRE)-binding protein (CREB) at Ser133. Phosphorylated CREB promotes target gene expression at promoters containing CREs. (Altarejos and Montminy 2011)
include various enzymes to produce secondary messengers, as well as specific ion channels that allow ions to act as second messengers. Some G proteins have stimulatory effects and others have inhibitory effects (Tuteja 2009). When 5-HT4 receptor is ligand stimulated, the activated GTP bound α subunit diffuses laterally until it interacts with and activates Adenylate Cyclase (AC). AC is a membrane bound enzyme that dephosphorylates ATP to cyclic AMP (Figure 7). cAMP regulation is directly associated with BDNF levels. There are several ligands for 5-HT4R, and one called RS67333 is able to produce AD effects in a short timeframe.
5.2. Gα subunit
The α subunit has four main families, αs, αi/o αq/11, and α12/13 (Figure 8) (Brandt and Ross 1985). To date there are 21 different α subtypes of α (Strathmann and Simon 1991; Baltoumas, Theodoropoulou et al. 2013). In terms of cAMP signaling, the α subunit can be stimulatory (αs) and cause an increase in cellular levels of cAMP (Lania, Mantovani et al. 2012) or can also inhibit (αi/o) and decrease cellular levels of cAMP (Roberts and Waelbroeck 2004). The
28
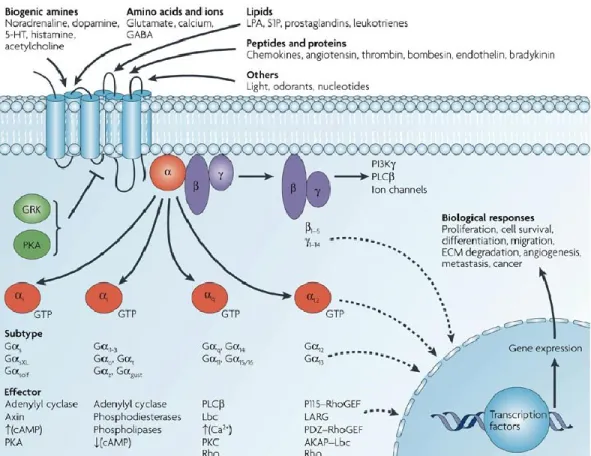
Figure 8. Diversity of G-protein-coupled receptor signalling
Various ligands use GPCRs to stimulate membrane, cytoplasmic and nuclear targets. GPCRs interact with heterotrimeric G proteins composed of α, β and γ subunits that are GDP bound in the resting state. Agonist binding triggers a conformational change in the receptor, which catalyses the dissociation of GDP from the α subunit followed by GTP-binding to Gα and the dissociation of Gα from Gβγ subunits 1. The α subunits of G proteins are divided into four subfamilies: Gαs, Gαi, Gαq and Gα12, and a single GPCR can couple to either one or more families of Gα proteins. Each G protein activates several downstream effectors 2. Typically Gαs stimulates adenylyl cyclase and increases levels of cyclic AMP (cAMP), whereas Gαi inhibits adenylyl cyclase and lowers cAMP levels, and members of the Gαq family bind to and activate phospholipase C (PLC), which cleaves phosphatidylinositol bisphosphate (PIP2) into diacylglycerol and inositol triphosphate (IP3). The Gβ subunits and Gγ subunits function as a dimer to activate many signalling molecules, including phospholipases, ion channels and lipid kinases. Besides the regulation of these classical second-messenger generating systems, Gβγ subunits and Gα subunits such as Gα12 and Gαq can also control the activity of key intracellular signal-transducing molecules, including small GTP-binding proteins of the Ras and Rho families and members of the mitogen-activated protein kinase (MAPK) family of serine-threonine kinases. Ultimately, the integration of the functional activity of the G-protein-regulated signalling networks control many cellular functions. (Dorsam and Gutkind 2007)
G αq/11 family increases cellular levels of inositol triphosphate (IP3) and diacylglycerol (DAG). The G α12/13 are involved in the Rho family GTPases signaling involving the control of cell cytoskeleton remodeling and cell migration. Each GPCR complexes with unique Gα subunits from one of the four major classes of α subunits, and each class consists of multiple subtypes.
29
For the 5-HT receptors the αs is specific in its interaction with 5-HT4, 5-HT6, and 5-HT7 receptors. The αi/o interacts with receptors 5-HT1 and 5-HT5. The 5-HT2 receptor mainly interacts with subunit G αq/11 . The G α12/13 has not been observed interacting with any 5-HT receptor. The general structure of these α subunit consists of two domains: a GTP binding domain and a helical insertion domain subunit. The α subunit is activated by GTP binding and dissociates from the G protein complex. When GTP is hydrolyzed back to GDP, the subunits reform to the inactive α-β-γ-GDP heterotrimer and associate again with the GPCR.
5.3. Gβγ subunits
Gβγ has a wide range of actions having a ‘hot spot’ motif that is key for protein-protein reactions. When Gβγ is in complex with Gα it acts as a negative regulator by increasing Gα’s affinity for GDP. When the G protein is in complex with GDP it is in its inactive state
(Wettschureck and Offermanns 2005). There are five different subtypes of β and twelve
subtypes of γ discovered so far and they pair for a variety of βx γy (Akgoz, Kalyanaraman et al. 2004) . It is also noteworthy that certain β subunits will prefer certain γ subunits. Gβγ is
required for nuclear exchange (Fung 1983; Florio and Sternweis 1989). Gβγ might also be necessary for α to engage plasma membrane (Sternweis 1986). As well as placing the α subunit into the right orientation and conformation to interact with the receptor, the α subunit is in a distinct orientation when unbounded (Lambright, Noel et al. 1994; Mixon, Lee et al. 1995; Lambright, Sondek et al. 1996). The general structure of the β subunit is 4 stranded β sheets forming each of the 7 blades of a propeller. The β propeller interacts with the α helix of the N terminal on Gα, inducing a conformational change upon the binding and interacting of GTP with the β propeller (Gaudet, Bohm et al. 1996; Sondek, Bohm et al. 1996; Lodowski, Pitcher et al. 2003). Gβγ does not cause significant conformation change upon G-protein activation with regards to downstream effects (Lucas, Rymar et al. 2007). Gβγ has an
important role in desensitization and internalization of receptors. In the case of the muscarinic-3 GPCR, a disruption on the muscarinic-3rd intracellular loop containing a binding site for Gβγ, did not affect downstream signaling, but it did inhibit receptor desensitization. This suggest that Gβγ binding to this loop facilitates the recruitment of G protein coupled receptor kinases (GRK) to the active form of the receptor (Wu, Bogatkevich et al. 2000). It is not yet known where on the receptor or which GRKs interact with the 5-HT4 receptor to be desensitized (Nedi, White et al.
30
2011). But a continual activation will result in increased concentration of intracellular cAMP by adenylate cyclase (AC).
6. The cAMP pathway 6.1. Secondary cascade
cAMP is produced when the G protein subunit Gαs is activated by the receptor and binds to and activates the integral membrane protein AC. AC catalyzes the cyclization of ATP, losing 2 phosphate groups in the process. cAMP production will activate Protein Kinase A (PKA), cyclic nucleotide-gated ion channels (Kaupp and Seifert 2002), domain-containing proteins, as well as exchange proteins activated by cAMP. PKA is a dimer that is made up of a regulatory unit and a catalytic unit. cAMP binds to the regulatory unit of PKA, releasing the catalytic unit and allowing it to pass through the nuclear membrane (Figure 7). When in the nucleus, one of the PKAs roles is to recruit other transcription factors coactivators to bind the cAMP Response Element Binding (CREB) promoter region and activate transcription dependent (Kriisa,
Sinijärv et al. 2015). CREB transcription directly affects the levels of expression of neurotrophin BDNF, which has a significant role in neurogenesis (Tao, Finkbeiner et al. 1998).
6.2. Downstream targets 6.2.1. CREB
CREB is a cellular transcription factor that sequences of DNA in the nucleus, modulating the transcription of downstream genes (Montminy and Bilezikjian 1987). CREB regulates genes such as c-fos (Sassone-Corsi 1988), BDNF (Nibuya, Nestler et al. 1996), tyrosine hydroxylase (McMahon and Sabban 1992), and various neuropeptides (Andrisani and Dixon 1990;
Hawley, Scheibe et al. 1992; Barthel and Loeffler 1993). Many of the genes it regulates are involved in long-term memory formation, long-term potentiation and reward.
6.2.1.1. CREB and plasticity
CREB is necessary for neuronal plasticity and long-term potentiation but is not limited to neurons and is found in many different organs (Carlezon, Duman et al. 2005). CREB has an important role in drug/reward addiction and has been mechanistically linked to behavioural
31
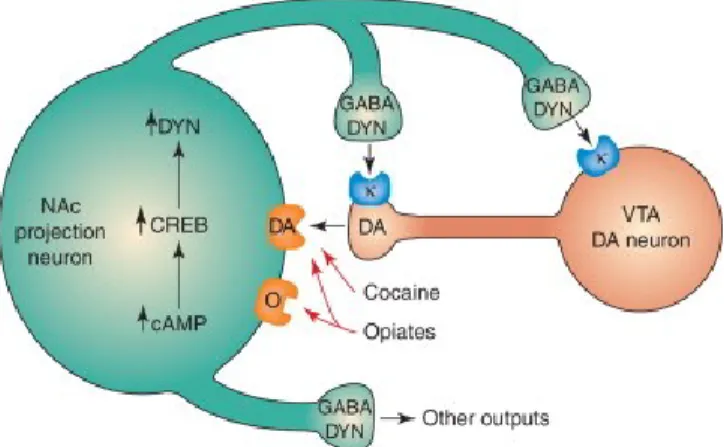
Figure 9. Regulation of cAMP response element-binding protein by drugs of abuse.
The figure shows a dopamine (DA)-containing neuron from the ventral tegmental area (VTA) that innervates a class of GABA-containing projection neurons in the nucleus accumbens (NAc) that express dynorphin (DYN). DYN acts as a negative feedback mechanism in this circuit. DYN released from the terminals of neurons from the NAc acts on kappa opioid peptide (κ) receptors on nerve terminals and cell bodies of DA-containing neurons and inhibits their activity. Chronic exposure to either cocaine or opiates and, possibly, other drugs of abuse upregulates this negative feedback loop by upregulating the cAMP pathway, which activates CREB and induces the formation of DYN.(Nestler 2004)
changes in drug addiction (Figure 9) (DiRocco, Scheiner et al. 2009; Nazarian, Sun et al. 2009; Wang, Ghezzi et al. 2009). Many drugs of abuse lead to changes in expression of endogenous BDNF (Barker, Taylor et al. 2014) and c-fos (Wright, Hollis et al. 2015). Evidence is growing that low levels of CREB in parts of the brain are associated with depression, and increases of CREB have been associated with AD treatment (Gass and Riva 2007). CREB is modulated by serotonin and noradrenalin binding to GPCRs activating the cAMP pathway (Gaven, Pellissier et al. 2013), and dysfunction in these receptors has been implicated in MDD (Krishnan and Nestler 2008).
6.2.1.2. CREB and antidepressant treatment
CREB is thought to play an important role in AD treatment because of its role in learning-related synaptic plasticity, neuronal plasticity, long-term memory formation and
neuroprotective properties (Nair and Vaidya 2006; Tardito, Perez et al. 2006; Gass and Riva 2007) . The expression and activity of CREB are increased in chronic but not acute treatment with AD rodent models and in the human postmortem brain (Nibuya, Nestler et al. 1996; Dowlatshahi, MacQueen et al. 1998; Malberg, Eisch et al. 2000; Thome, Sakai et al. 2000). Some researchers have reported no change or even a decrease in CREB protein following AD
32
treatment (Blom, Tascedda et al. 2002; Laifenfeld, Karry et al. 2005). This supports the idea that ADs affect CREB differently and in different regions of the brain. Targeted treatment would enable memory formation in regions of the brain that form happy memories, and reduce memory formation in regions of the brain for fear (Frechilla, Otano et al. 1998; Manier,
Shelton et al. 2002; Laifenfeld, Karry et al. 2005; Berton and Nestler 2006; Yu and Chen 2011). Expression manipulation studies have associated increased PKA and CREB activity in the amygdala with anxiogenic and depressive-like behaviours (Wallace, Stellitano et al. 2004; Keil, Briassoulis et al. 2012). In a study by Carlezon et al (2006), CREB appeared to affect behaviour differentlydepending on where it wasexpressed (Nestler and Carlezon 2006). In viral expression of a dominant negative form of CREB, mCREB had a pro-depressant effect when localized in the hippocampus, and an AD effect when localized in the amygdala or nucleus accumbens (Chen, Shirayama et al. 2001; Pliakas, Carlson et al. 2001; Wallace, Stellitano et al. 2004). CREB regulates BDNF which plays a significant role in neurogenesis, synaptogenesis and depression.
6.2.2. BDNF
6.2.2.1. BDNF-mediated Neural regulation
BDNF regulates neuronal structure and function (Schinder and Poo 2000; Tyler, Alonso et al. 2002). It is critical for synaptic plasticity and memory processing (Alonso, Vianna et al. 2002; Tyler, Alonso et al. 2002; Yamada and Nabeshima 2003; Bekinschtein, Cammarota et al. 2007). BDNF induces and is sufficient for long-term potentiation in the hippocampus (Kang, Welcher et al. 1997; Patterson, Pittenger et al. 2001; Pang, Teng et al. 2004; Pastalkova, Serrano et al. 2006). Physical and social stresses lead to decreased levels of BDNF in the hippocampus and prefrontal cortex (Duman and Monteggia 2006; Krishnan and Nestler 2008; Castrén and Rantamäki 2010). AD Treatment increases the expression of BDNF in the
hippocampus and prefrontal cortex. This upregulation is only observed in chronic and not acute administration of different ADs (Duman and Monteggia 2006; Sen, Duman et al. 2008; Bocchio-Chiavetto, Bagnardi et al. 2010). Depression results in neuronal atrophy and
decreased neurogenesis (Taylor, McQuoid et al. 2014). Treating with ADs blocks and can reverse this neurotrophic deficit, reversing the atrophy and cell loss (Duman, Heninger et al. 1997; Duman and Monteggia 2006). Certain regions of the brain vary in respect to BDNF
33
levels. An increase in BDNF in the hippocampus has AD effects, while in the nucleus accumbens or amygdala BDNF effects may be pro-depressive (Duman and Monteggia 2006; Krishnan and Nestler 2008).
6.2.2.2. BDNF and depression
Though BDNF depletion may not be sufficient to cause depressive behavior, an absence of it in specific regions of the brain may increase susceptibility to becoming depressed under stressful conditions. A study by Ibarguen-Vargas et al (2009) made use of a mouse model that had heterozygous deletions of BDNF and expressing approximately half the normal levels of BDNF. Under baseline conditions these mice were non symptomatic, but upon exposure to stress, they more readily exhibited depressive symptoms (Duman, Russell et al. 2007;
Ibarguen-Vargas, Surget et al. 2009). Different types of acute and chronic physical and social stress also decrease neurogenesis while chronic AD treatment increases neurogenesis. As described in figure 2, the expression of BDNF has a positive feedback loop both for positive effects and negative effects. Exercise and social interactions both short term and long term lead to an increase in BDNF (Szuhany, Bugatti et al. 2015). Expression of BDNF has been linked to increased happiness (Castren 2014), neuronal activity, neurogenesis (Jeong, Kim et al. 2014) and synaptic plasticity. These in turn are linked to increased social interaction (Hsiao, Hung et al. 2014). On the other hand, a lack of physical exercise, or increases in stress may lead to a decrease in neuronal activity. A decrease in neuronal activity may lead to atrophy and apoptosis, decreasing BDNF expression, potential increasing stress levels (Ieraci, Mallei et al. 2015) and continuing the cycle.
An effective AD would increase the expression of pCREB and BDNF in specific regions of the brain related to reward and motivation. This effect would be rapid, sustainable and would not overstimulate the receptors enough to cause desensitization.
7. Regulation and desensitization 7.1. GRK
GRKs are a family of protein kinases that regulate GPCRs .There are seven mammalian GRKs grouped into three subfamilies: GRK1 comprising of GRK1 (rhodopsin kinase) and GRK7
34
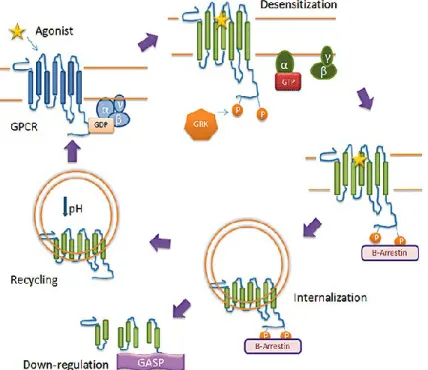
Figure 10. G-protein-coupled receptor (GPCR) desensitization, internalization and down-regulation.
Upon activation of the GPCR, GPCR kinase (GRK) phosphorylates the receptor, generally on C-terminal Ser/Thr residues. Once phosphorylated, β-arrestin can bind to the GPCR, desensitizing the receptor and causing the receptor to internalize via clathrin-coated pits. Once internalized, GPCRs may be recycled back to the cell surface following dephosphorylation in acidified endosomal compartments. Alternatively, GPCRs can be trafficked to lysosomes and degraded (down-regulation), a process that is facilitated by GPCR-associated sorting protein (GASP)(Smith, Sim‐Selley et al. 2010).
(cone kinase), GRK2 comprising of GRK2 and 3, and GRK4 comprising of GRK4,5 and 6 (Premont, Macrae et al. 1999). The first 20 amino acids of GRKs are highly conserved and are critical for GPCR and phospholipid-stimulated autophosphorylation. They have a
multidomain structure comprised of three functional domains, a central catalytic domain, an amino-terminal regulator of G protein signalling homology, and a carboxyl-terminal
membrane targeting domain (Pronin and Benovic 1997; Lodowski, Pitcher et al. 2003; Tesmer, Kawano et al. 2005). GRKs will phosphorylate serine and/or threonine residues on the third intracellular loop and carboxyl-terminal tail domains of agonist activated receptors. Phosphorylation is a necessary step for the termination of an active signal from GPCR, but it on its own is insufficient to mediate the desensitization of many GPCRs (figure 10). The phosphorylation converts it into a target of high affinity binding of arrestin proteins and
35
phosphorylated GPCRs facilitates the uncoupling of the receptor from the heterotrimeric G proteins.
7.2. Arrestins
There are four different subtypes of arrestin proteins in mammals, named Arrestin 1, βarrestin, βarrestin2, and Arrestin4. They primarily participate in agonist mediated desensitization of GPCR, causing specific dampening of cellular response to stimuli such as hormones, sensory signals and in our case neurotransmitters. GRK mediated phosphorylation promotes the binding of βarrestins 1 and 2 which function as endocytic adaptor proteins that facilitate the targeting of receptors for clathrin mediated endocytosis (Figure 11) (Ferguson, Zhang et al. 1996; Goodman Jr, Krupnick et al. 1996). βarrestin and βarrestin2 were named for their ability to sterically hinder the G protein coupling of agonist-activated GPCR, resulting in receptor desensitization. They also function to activate signaling cascades independent of G protein activation. Serving as multiprotein scaffolds, they bring elements of specific signaling pathways into close proximity of the GPCR and of the cell membrane, where many of the secondary messengers of G proteins are generated. βarrestins bring components of the clathrin-coated pit machinery, thus stabilizing the association with clathrin-coated pits (Laporte, Oakley et al. 2000). The pits invaginate and are released into the cytosol as free clathrin coated vesicles. This step requires the activity of dynamin to pinch off the clathrin-coated vesicle from the plasma membrane (Laporte, Oakley et al. 2000). Following vesicle scission, all components must be disassembled so that the clathrin-coated vesicle can fuse with an early endosome. This early endosome controls the activity and the destinations of proteins in the compartment. These endosomes are a key point for sorting receptors which can be directed to late endosome or lysosomes for degradation or recycling back to the cell surface (Mellman 1996).
36
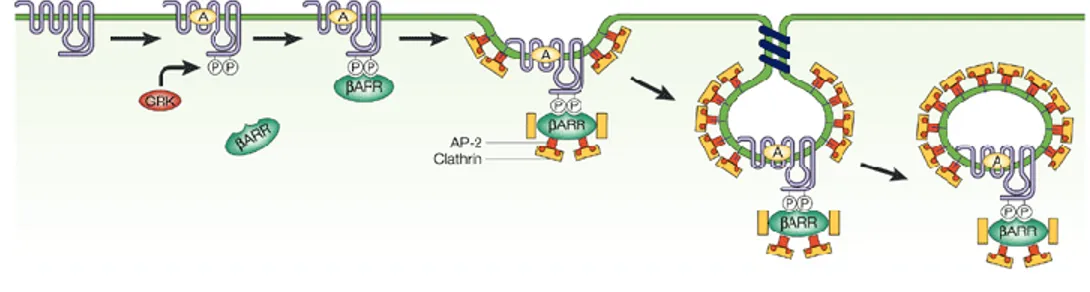
Figure 11. β-Arrestin-dependent internalization of GPCRs.
After agonist (A) binding to G-protein-coupled receptors (GPCRs), GPCR kinases (GRK) phosphorylate residues in the third intracellular loop and carboxyl tail of GPCRs, leading to the recruitment of beta-arrestins (betaARR). The beta-arrestins recruit clathrin and the AP-2 complex, which target GPCRs for clathrin-mediated endocytosis (Pierce and Lefkowitz 2001).
8. Hypothesis of work
Ligands that activate receptor 5HT4 induce conformational changes that differ in the recruitment of G protein αs and αo. This functional selectivity may account for RS67333’s antidepressant implications.
9. Goal of project
Different agonists that activate the same GPCR are in some cases capable of producing
different response profiles through activation of different types of G proteins (Urban, Clarke et al. 2007). Functional selectivity is thought to be due to the stabilization of different
conformations of GPCR by agonists leading to activation of different sets of responses (Perez and Karnik 2005; Urban, Clarke et al. 2007). To this end different agonists could also lead to different mechanisms of desensitization, as each agonist-induced GPCR conformation could possess different affinities for regulatory proteins such as GRKs and arrestins. RS67333 is a 5-HT4 agonist that has lasting AD effects in a short time (Mnie-Filali, Amraei et al. 2010; Vilaró and Piñeyro 2010). Our objective is to profile five 5-HT4 agonists: Zacopride,
Prucalopride, ML10302, RS67333 and Serotonin. We will be profiling them with respect to the cAMP pathway, measuring conformational changes in Gαs and Gαo, with the BRET technique, measuring desensitization with ELISA, and measuring changes in pCREB in the nucleus accumbens and striatum when treated with RS67333.
37
Materials and Methods
1. pCREB Measurements in striatum and nucleus accumbens in OBX versus sham rats 1.1. Olfactory bulb ablation
Rats were anesthetized with a mixture of isoflurane (3– 3.5%) and oxygen (Breuer, Groenink et al. 2007) and mounted onto a stereotaxic apparatus. An incision was made on the scalp and a rectangular hole was drilled on the portion of the skull overlying the olfactory bulbs. The caudal end of the bulbs was then severed from the rostral pole of prefrontal cortex with a microknife; physical transection of the junction between these two structures precluded distortion to the prefrontal cortex during removal of the olfactory bulbs by suction (van der Stelt, Breuer et al. 2005). The resultant cavity was then filled with sterile hemostatic sponge and the wound was closed with sterile suture (van der Stelt, Breuer et al. 2005; Breuer, Groenink et al. 2007). Sham-operated (SHAM) rats were treated similarly, with the exception that their brain remained intact. Following surgery, all rats were housed singly and allowed a minimum of 10 days to recover prior to the start of behavioral testing. Each brain was
inspected at the time of sacrifice; bulbectomies were considered successful only if less than 30% of the bulbs remained intact (van Riezen, Schnieden et al. 1977; Chambliss, Van Hoomissen et al. 2004).
1.2. Preparation of brain samples
Following the removal of residual bulb in the rats, striata and nucleus accumbens were dissected on ice. Dissection and determination of CREB activity was performed using the methods described by Lucas et al. (Lucas, Rymar et al. 2007). Isolated striata, including the ventral striatum (1-2 mg wet tissue/100 μl) were homogenized in buffer containing 5 mM Tris-HCl, pH 7.4, 2 mM EDTA, and protease inhibitors (5 g/ml leupeptin, 5 g/ml soybean trypsin inhibitor, and 10 g/ml benzamidine (Lucas, Rymar et al. 2007). After homogenization, Triton X-100 was added at a final concentration of 1% (v/v) and the mixture was agitated (4° C, 1.5 h) followed by centrifugation (4°C, 15,000xg, 25 min). The resulting pellet was suspended in sample buffer at a final concentration of 10 μg protein/μl.
38 1.3. Membrane Preparation
Membranes were prepared as described previously (Rousseau, Nantel et al. 1996). Briefly, washed tissues were then lysed on ice with a Branson sonifier 250 VWR scientific (ten 1-second bursts at maximum speed). Lysates were then heat shocked for 5 min at 95 °C, cooled on ice, followed by centrifugation at 500g for 5 min at 4°C, and the resulting supernatant was centrifuged at 45,000g for 20 min at 4°C. The resulting pellet was resuspended in binding buffer (75 mM Tris-HCl, pH 7.4, 12.5 mM MgCl2, 2 mM EDTA, and protease inhibitors as indicated above) and immediately used in binding assays or for gel electrophoresis. Protein concentration was determined using the Bio-Rad DC Protein Assay Kit (Richmond, CA) and 300 μg of protein was used. For SDS-polyacrylamide gel electrophoresis, membrane protein samples were denatured in sample buffer (62.5 mM Tris-HCl, 5% SDS, 50 mM dithiothreitol (DTT), 10% glycerol, 0.05% bromophenol blue) and separated on a 10% Sodium Dodecyl Sulfate-polyacrylamide gel (SDS-PAGE) using a GE healthcare RainbowTM Molecular weight marker as the ladder .
1.4. Preparation of SDS-PAGE
There are two types of gel: running gel and stacking gel. The running gel is made 3.97 ml of H2O, 3.33 ml of Acryl-bisacryl, 2.5 ml of Tris 1.5M pH 8.8, 100 μL of 10% Sodium dodecyl sulfate (SDS), 100 μL of ammonium persulfate and lastly 5 μL of
Tetramethylethylenediamine (TEMED). The stacking gel has a slightly different blend, still using all the same ingredients except with a change to Tris 0.5 M pH 6.8. Stacking gel uses 2.38 ml H2O, 500 μl of acryl-bisacryl, 500 μl of Tris 0.5M pH6.8, 38 μl of 10% SDS, 38 μl of 10% APS, and 4 μl of TEMED.
1.5. Western blot analysis
The samples were sonicated and immediately boiled for 5 min before being inserted into gels (SDS-PAGE). A running buffer of 30 mM Tris base, 50 mM glycine, and 3 mM SDS was used. The gels were run at 170V for 2 hours. The proteins resolved in SDS-PAGE were
transferred from gels onto nitrocellulose in a transfer buffer solution of 0.025M Tris base, 0.19 M glycine, 10% methanol, via a current (50 mA, overnight, Bio-Rad). The phosphorylated
39
form of CREB (pCREB) was detected by probing membranes with an mouse anti-pCREB monoclonal antibody (1: 100; sigma) followed by secondary antimouse (1:5000; Sigma). Total CREB content was determined after stripping by using a 1:5000 dilution of anti-CREB
polyclonal antibody (Cell Signaling Technology) followed secondary anti-rabbit horseradish peroxidase (HRP)-conjugated IgG antibodies (1:10000; Amersham). Protein content was revealed by chemiluminescence detection reagents (Amersham ECL select).The density of each band was quantified using the ImageJ software (National Institutes of Health, USA). The results were expressed as the pCREB/total-CREB ratio. The activation of CREB in striatum and Nucleus Accumbens tissue was assessed by measuring phospho-CREB (pCREB)
immunoreactivity. CREB phosphorylation was normalized according to the amount of protein present in each sampled by expressing the data as a ratio of pCREB over total CREB
immunocreactivity.
2. BRET Comparisons between RS67333, 5-HT and other ligands 2.1. Cell Culture
2.1.1. Cell line 5-HT4b
Stable cell lines were produced using lipofectamine (Invitrogen) to transfect 4 μg of DNA/100 mm petridish followed by selection with Geneticin (500 μg/ml). Cells containing the 5-HT4B receptor would have resistance to the antibiotic G418. The 5-HT4B stable cells were used for internalization experiments and kept stable with typical DMEM media with 10% FBS, penicillin, streptomycin and G418.
2.1.2. Transfection of HEK 293 immortal cell line
HEK293 cells were cultured in DMEM (Dulbecco's Modified Eagle Medium) supplemented with 10% FBS, and penicillin 1000 Units/ml and 1mg/ml Streptomycin (Wisent. Inc.) at 37°C, in 5% CO2 and 100% humidity. Aliquots of 3.5 x 10⁶ cells were seeded into 10-cm dishes to optimize transfections conditions. Aliquots of 3.5 x 10⁶ cells were incubated overnight. Transient transfection were performed the following day with polyethylenimine (PEI) in DMEM media (Pei: Polysciences) at a DNA/PEI ration of 1:2. The DNA to study the conformational changes in αs and γ2 were 0.4 μg of αs67RlucII, 4 μg of γ2GFP10, 4 μg of β1 and 8 μg of HA-5-HT4B. The DNA to study the conformational changes in αo and γ2 were 0.35
40
μg of αo90RlucII, 3 μg of γ2GFP10, 3 μg of β1 and 10 μg of HA-5-HT4B.. They were incubated for 3 hours and the transfection was stopped by removing media and replacing with the same growth media used previously. They were then incubated for 2 nights and were then ready for experiments using Bioluminescence resonance energy transfer (BRET).
2.2. BRET
2.2.1. DNA constructs
The plasmids encoding the Green Fluorescent Protein (GFP10) fused at the N terminus of the human Gγ2 were obtained by subcloning the human Gγ2 coding sequences into GFP vectors (Gales, Van Durm et al. 2006). Recombinant plasmids encoding for αsRlucII were prepared as previously described (Audet, Gales et al. 2008), to insert the coding sequence of humanized Renilla luciferase (Rluc; PerkinElmer Life Science) into the coding sequence of human Gαs at Ser67. They were donated to us as a gift from the Michel Bouvier’s laboratory. The vector encoding human influenza hemagglutinin (HA) fused in frame at the N terminus of human 5-HT4B have been previously described (Breit, Gagnidze et al. 2006).
2.2.2. BRET Analysis
Gα and Gγ2 were tagged with Rluciferase II at the 67th amino acid and with GFP10 at the N terminus. Forty eight hours after transfection, cells were washed twice and mechanically detached with phosphate buffered saline (PBS) and centrifuged 5 min at 300g, followed by resuspension in PBS. Treatments and BRET protocols were based on a previously established protocol that was optimized for assessing in vivo ligand effects on receptor interaction with heterotrimeric G proteins (Gales, Van Durm et al. 2006; Rebois, Robitaille et al. 2006). Cells were briefly kept on ice until immediately prior to reading. They were then distributed into a 96-well microplate (white optiplate; PerkinElmer Life Sciences) at a concentration of 1.5 μg protein/well, which allowed us to achieve luminescence levels suitable for BRET readings using different constructs. The Rluc coelenterazine substrate DeepBlueC (PerkinElmer Life Sciences) was added for a final concentration of 5 μM. Readings were taken 10 min after coelanterazine addition, using the Mithras LB 940 multimode microplate reader that allows the sequential integration of the signals detected in the 400 nm and 515 nm windows using filters with the appropriate band pass (chroma). The BRET2 signal was determined by
41
calculating the ratio of the light emitted by GFP10 (515nm) over the light emitted by the RlucII (400nm) at the detection wavelength of the filters. BRET2 values were corrected by subtracting the BRET background signal measured from the Rluc-tagged construct alone, from the BRET signal detected in cells co-expressing both Rluc and GFP (net BRET).
2.2.3. BRET theory
BRET makes use of the naturally occurring phenomenon luciferase to excite the fluorescently bound proteins and measure the non-radiative transfer of energy between a luminescent donor and a fluorescent acceptor (Angers, Salahpour et al. 2000). In BRET2 assays, Rluc catalyses the oxidation of cell permeable coelenterazine (Deepblue C) resulting in luminescent
emissions within the excitation wavelength of GFP (Bertrand, Parent et al. 2002). Because the efficacy of the energy transfer varies inversely with the sixth power of distance, fluorescence emission by GFP will only take place if donor excitation occurs in close proximity of the acceptor (100 Angstroms). This property may be exploited to monitor interactions between different types of cellular proteins (Milligan and Bouvier 2005; Marullo and Bouvier 2007) provided that the proteins of interest are tagged with donor/acceptor pairs. Changes in the BRET ratio implies movement of the donor and acceptor protein in relation to each other, and can only be observed if proteins are within 20Å of each other (Altenbach, Oh et al. 2001).
3. Ligand Induced internalization studies 3.1. ELISA assays of cell internalization
For quantification of receptor internalization, enzyme linked immunosorbent assays (ELISA) were performed. Cells stably expressing the 5-HT4B receptor were plated out at 200,000 cells per well of a 24 well tissue culture dish previously coated with 0.1 mg/ml poly-l-lysine and incubated in DMEM 10%FBS with G418. After 24 hours the cells were serum-deprived and incubated at 37°C overnight. The cells were then incubated for 90 min at 37°C under the conditions of agonist stimulation (serotonin, RS67333, Zacopride, Prucalopride and ML10302) at various concentrations. Stimulation was stopped by removing the media and fixing the cells with 3% paraformyladehyde/PBS for 15 min on ice. The cells were then washed two times with PBS-CM (1 mM MgCl2, 1 mM M CaCl2) on ice. Non-specific binding was blocked with PBS-CM/BSA (1%) for 30 min at room temperature. The primary antibody
42
(monoclonal mouse anti-HA) was added at a dilution of 1/3000 in PBS/BSA for 1 hour at room temperature/ two washes of PBS followed. Incubation with HRP linked anti-Mouse IgG diluted to 1/5000 for 30 min. The cells were then washed twice with PBS-CM and 200μl of HRP o-phenylelediamine dihydroschloride (sigma FASTTM OPD) colorimetric alkaline phosphatase substrate was added. When the adequate color change was reached, coloration was stopped by adding 50μl HCl 3N and 200μl samples were taken for colorimetric readings. The optical density was measured at 492 nm in a 96-well microplate (Victor3 Plate reader; Perkin Elmer) The optical density (OD) corresponds to the signal generated by receptors bound on the cell surface. The quantity of receptors internalized immediately after the
exposition to the drugs was calculated by using the OD in the presence and absence of drugs. The results express the percentage of receptor present at the surface in a ratio
:ODbasalOD−ODbasalstimulated∗ 100% , where ODbasal and ODstimulated were the optical densities of the receptors in absence or in presence of respective agonist at different concentrations. The value obtained correspond to the results of internalization in percentage of the receptors on the surface with treatment. The results of different treatments are compared to the normalization of internalization induced by 5-HT.
3.2. 5-HT4 receptor ligands
We used 5-HT, a ubiquitous endogenous neurotransmitter ligand important in learning, mood, and sleep (Portas, Bjorvatn et al. 2000; Harvey 2003; Ruhé, Mason et al. 2007). Zacopride is an exogenous ligand that is an antagonist of the 5HT3 receptor (Smith, Sancilio et al. 1988) and an agonist for the 5-HT4 receptor (Lefebvre, Contesse et al. 1993). Prucalopride, an exogenous ligand, is an agonist for the 5-HT4 receptor (Briejer, Bosmans et al. 2001). ML10302, an exogenous ligand, may be a partial agonist for the 5-HT4 receptor. Finally, RS67333 is an exogenous ligand that acts on the 5-HT4 receptor as an agonist (Lamirault and Simon 2001).
4. Statistical analysis
All statistical analyses were performed using Graphpad 6 (Prism) software package. Means of two experimental conditions run in parallel were analyzed by means of paired,
43
two-tailed Student’s t tests. Multiple comparisons were done by means of ANOVA-two way analysis. After establishing significance for different factors and interactions, posthoc tests were carried out to further establish the source of differences. When all conditions were compared among each other the test used was Tukey’s; when selected conditions were compared the test used was Sidak’s. The effects of drug concentrations were
established using Dunnet’s test to compare responses obtained in the presence of ligand to responses obtained in its absence.