Bouakez : HEC Montréal and CIRPÉE
Correspondence : HEC Montréal, 3000 Côte-Sainte-Catherine, Montréal, QC Canada H3T 2A7; tel. : 1-514 340-7003; Fax : 1-514 340-6469
hafedh.bouakez@hec.ca
Chihi : HEC Montréal and CIRPÉE
Normandin : HEC Montréal, CIRPÉE and DEFI
We thank Craig Burnside, Larry Christiano, Mick Devereux, Sylvain Leduc, Harald Uhlig and seminar participants at the University of Guelph, the University of Ottawa, the University of Toulouse and the Bank of Canada for helpful comments and discussions.
Cahier de recherche/Working Paper 10-16
Measuring the Effects of Fiscal Policy
Hafedh Bouakez
Foued Chihi
Michel Normandin
Abstract:
Measuring the effects of discretionary fiscal policy is both difficult and controversial, as
some explicit or implicit identifying assumptions need to be made to isolate exogenous
and unanticipated changes in taxes and government spending. Studies based on
structural vector autoregressions typically achieve identification by restricting the
contemporaneous interaction of fiscal and non-fiscal variables in a rather arbitrary way.
In this paper, we relax those restrictions and identify fiscal policy shocks by exploiting
the conditional heteroscedasticity of the structural disturbances. We use this
methodology to evaluate the macroeconomic effects of fiscal policy shocks in the U.S.
before and after 1979. Our results show substantive differences in the economy’s
response to government spending and tax shocks across the two periods. Importantly,
we find that increases in public spending are, in general, more effective than tax cuts in
stimulating economic activity. A key contribution of this study is to provide a formal test
of the identifying restrictions commonly used in the literature.
Keywords: Fiscal policy, Government spending, Taxes, Primary deficit, Structural
vector auto-regression, Identification
1.
Introduction
A classic question in macroeconomics is: how does fiscal policy affect economic activity and welfare? This question has received renewed interest in light of the recent financial crisis and the debate about the relevance and the nature of government intervention to stimulate the economy. To the extent that different theories provide different answers regarding the macroeconomic effects of fiscal policy, it is important to have an accurate empirical assessment of these effects. The purpose of this paper is to provide new evidence on this subject using an alternative empirical methodology that avoids potential shortcomings of existing approaches. The main challenge facing the empirical literature in this area is the difficulty to isolate exogenous and unanticipated changes in fiscal policy. One reason is that a large fraction of government revenue varies automatically with income and is, therefore, predictable. A second reason is that changes in public spending or taxes may reflect countercyclical policy actions to stabilize the economy or the government’s desire to maintain the budget deficit or public debt at a given level.
The complexity of the process by which fiscal policy is conducted is not fully captured, however, in existing empirical studies that use structural vector auto-regressions (SVAR) to assess the effects of unanticipated shocks to government spending and taxes.1 The assumptions commonly employed to identify these shocks are to a large extent arbitrary and sometimes overly restrictive, thus calling into question the validity of the ensuing results. For example, most existing studies identify government spending shocks by assuming that public spending is predetermined with respect to any other economic variable, including taxes (e.g., Fat´as and Mihov, 2001a, Blanchard and Perotti, 2002, and Gal´ı, L´opez-Salido and Vall´es, 2007). Also, following the seminal work of Blanchard and Perotti (2002), tax shocks are typically identified by purging the fraction of government revenue that changes automatically with output and by assuming that the resulting cyclically adjusted taxes do not respond to contemporaneous changes in government spending. In both cases, these exclusion restrictions–which define the policy indicator–are insufficient to achieve identification, and so additional restrictions must be imposed on the contemporaneous interaction of the variables included in the SVAR. These additional restrictions affect the transmission of fiscal policy shocks. In this paper, we estimate the effects of fiscal policy shocks on GDP and domestic absorption in the U.S. using a flexible SVAR that relaxes the identifying assumptions used in previous studies.
1
A parallel empirical literature uses the narrative approach to identify exogenous and unanticipated changes in U.S. fiscal policy. Ramey and Shapiro (1998) isolate three events that led to large military buildups in the U.S. (the Korean War 1950:3, the Vietnam War 1965:1, and the Carter-Reagan defense build-up 1980:1). They identify exogenous changes in government spending with a dummy variable that traces these episodes. Ramey (2008) isolates more events that led the press to forecast increases in defense spending and provides estimates of the present value of the forecasted changes. Romer and Romer (2008) use a variety of government documents to identify, quantify and classify significant changes in federal tax legislation from 1947 to 2007.
We instead achieve identification by exploiting the conditional heteroscedasticity of the innovations to the variables included in the SVAR, a methodology initially proposed by King, Sentana and Wadhwani (1994) and Sentana and Fiorentini (2001). This data-based approach avoids imposing a priori assumptions about the implicit indicator of fiscal policy or its transmission mechanism, as it leaves unrestricted the contemporaneous interaction among fiscal instruments and between those instruments and the remaining variables of interest. Importantly, it also allows us to test various identifying restrictions commonly imposed in the literature, which are otherwise untestable under the usual assumption of conditional homoscedasticity of the shocks.2 To the best of our knowledge, this is the first attempt to identify fiscal policy shocks and their effects through time-varying conditional variances.3
Underlying our empirical framework is a simple theoretical model that imposes a minimal struc-ture on the system to be estimated. The model casts fiscal policy in the context of a market for newly issued government bonds. The supply of bonds may or may not shift as a result of changes in taxes or public expenditures, depending on the government’s implicit target or, alternatively, fiscal-policy indicator. In turn, variations in taxes and public expenditures reflect both the auto-matic/systematic response of these variables to changes in economic conditions, and exogenous and unpredicted shifts in policy, i.e., fiscal-policy shocks. The market-clearing condition for bonds and the government budget constraint then impose a cross-equation restriction on the SVAR param-eters, thus ensuring that the dynamics of fiscal variables are mutually consistent. An additional advantage of our theoretical model is that it allows us to give a structural interpretation to the parametric restrictions associated with the different indicators of fiscal policy.
In order to account for a structural break in the data, we estimate our SVAR over the pre-and post-1979 periods. While the model specification is not rejected in any of the two periods, estimates of the structural parameters differ substantially from one period to the other. These differences have important implications for the dynamic effects of fiscal policy shocks and their relative contribution to the variability of output. In particular, we find that an unexpected increase in government spending leads to a larger and more persistent rise in output in the post-1979 period than in the pre-1979 period. The implied impact multiplier (defined as the dollar change in output
2
Mountford and Uhlig (2009) propose an alternative agnostic procedure whereby fiscal-policy shocks are identified by imposing sign restrictions on the impulse responses of fiscal variables and by assuming that these shocks are orthogonal to business-cycle and monetary-policy shocks. While Mountford and Uhlig’s approach leaves unrestricted many of the contemporaneous relations between the variables of interest, it still restricts the response of fiscal variables to fiscal shocks and requires the prior identification of business-cycle and monetary-policy shocks. Moreover, the sign-restriction approach does not allow formal testing of the commonly used identifying sign-restrictions.
3
Identification through heteroscedasticity has been recently applied to study the effects of monetary policy shocks. Rigobon and Sachs (2004) assume that there is a shift in the unconditional variance of the monetary policy shock on days of FOMC meetings, while Normandin and Phaneuf (2004) and Bouakez and Normandin (2008) allow the
that results from a dollar increase in the exogenous component of public spending) increases from 0.93 in the former period to 1.34 in the latter. Our results also indicate that output has become less responsive to tax shocks after 1979 and that tax cuts are, in general, less effective in stimulating economic activity than increases in government spending.
The extent to which these results differ from those obtained by imposing the commonly used identifying restrictions depends on the nature of the fiscal shock and on the sample period. In the case of government spending shocks, the discrepancies between the unrestricted and restricted re-sults are much more evident in the post-1979 period. Test rere-sults reveal that these discrepancies are not due to the restrictions associated with the policy indicator but rather to those associated with its propagation mechanism. More specifically, the hypothesis that government spending is prede-termined with respect to taxes and output cannot be statistically rejected, whereas the additional restrictions typically imposed in the literature to complete identification are strongly rejected by the data. In the case of tax shocks, important differences between the restricted and unrestricted results exist in both periods, but they originate from different sources. Before 1979, these differ-ences reflect the lack of empirical support for the restrictions associated with the transmission of tax policy. After 1979, they reflect the fact that cyclically adjusted taxes do not seem to be the appropriate indicator of tax policy.
The agnostic nature of our identification procedure also enables us to properly test some impor-tant propositions related to the effects of fiscal policy, such as the starve-the-beast and Ricardian-equivalence hypotheses. In contrast, testing these hypotheses within just-identified SVARs would lead to outcomes that are conditional on the identifying assumptions and that are therefore diffi-cult to interpret. The starve-the-beast hypothesis holds that a tax cut should lead to a reduction in future public spending, while Ricardian equivalence implies that a change in taxes that is not accompanied by a change in government spending should not affect economic activity. Our results indicate that none of these hypotheses is supported by the data.
A fundamental question that has received considerable attention in recent years concerns the response of private consumption to a government spending shock. Standard neoclassical theory predicts that public spending crowds out private consumption due to a negative wealth effect, but the empirical literature provides mixed evidence. Generally speaking, SVAR-based studies find that consumption rises in response to an increase in government spending (e.g., Blanchard and Perotti, 2002 and Gal´ı, L´opez-Salido and Vall´es, 2007), while those based on the narrative approach find the opposite result (e.g., Edelberg, Eichenbaum, and Fisher,1999, Burnside, Eichenbaum, and Fisher, 2004 and Ramey, 2008). To shed further light on this issue, we estimate an extended version of our SVAR that includes consumption. We find a significant crowding-in effect of public spending, which has become substantially more persistent after 1979. We also find that the effects of government
spending shocks on consumption are larger than those of tax shocks, whereas the opposite is true for private investment.
It is often argued that, due to the legislative and implementation lags inherent in fiscal pol-icy, changes in government spending and taxes are likely to be anticipated by economic agents several months before they actually take place, a phenomenon commonly referred to as fiscal fore-sight (see, for example, Leeper, Walker and Yang, 2008). To the extent that agents behave in a forward-looking manner, reacting to news about future fiscal policy, the SVAR approach may fail to correctly identify fiscal policy shocks and may therefore lead to biased estimates of their effects. Ramey (2008) provides suggestive evidence that the SVAR-based innovations are in fact anticipated. More specifically, she finds that the government spending shocks extracted from a standard SVAR estimated using U.S. data and identified as in Blanchard and Perotti (2002) are Granger-caused by the war dates isolated by Ramey and Shapiro (1998).
To verify whether this criticism applies to the government spending shocks implied by our SVAR, we subject them to the same test carried out by Ramey. The test provides no evidence that these shocks are Granger-caused by the war dates. In fact, we find that Ramey’s results are driven by the Korean-War episode, which is not covered by our sample period. We also conduct an analogous check for our tax shocks by testing whether they are Granger-caused by the dates identified by Romer and Romer (2008) as marking the announcements of exogenous changes in U.S. tax policy. We again find no evidence that these dates predict the SVAR tax shocks. These results suggest that the fiscal-foresight problem is not sufficiently severe to undermine the ability of the SVAR approach to identify truly unanticipated shocks to fiscal policy, at least in the sample period considered here. This is likely due to the fact that an important fraction of fiscal policy shocks are in fact unanticipated. Simulation results by Mertens and Ravn (2009a) indeed show that if the data are generated both by anticipated and unanticipated fiscal shocks and that the former explain a relatively small share of the variance of fiscal variables, the SVAR approach can be successful in uncovering the true impulse responses to an unanticipated fiscal shock. These authors also estimate the effects of unanticipated government spending shocks in the U.S. using an augmented SVAR procedure that is robust to the presence of anticipated effects and find very similar results to those obtained from a standard SVAR.
The rest of the paper is organized as follows. Section 2 presents the SVAR specification and describes the identification strategy, the estimation method and the data. Section 3 reports the estimation results and discusses the properties of the implied fiscal policy indicators, the dynamic effects of fiscal policy shocks, and the implications of imposing the commonly used identifying restrictions. Section 4 extends the baseline SVAR to study the effects of fiscal policy shocks on consumption and investment. Section 5 concludes.
2.
Empirical Methodology
2.1 Specification
We start with the following SVAR:
Azt= m
X
i=1
Aizt−i+ ǫt (1)
where ztis a vector of macroeconomic variables and ǫtis a vector of mutually uncorrelated structural
innovations, which include fiscal shocks. Blanchard and Perotti (2002) assume that the vector zt
consists of output, government spending and taxes. In our specification, we add to this list the price of government bonds for reasons that will become apparent below. Denote by νt the vector
of residuals (or statistical innovations) obtained by projecting zt on its own lags. These residuals
are linked to the structural innovations through
Aνt= ǫt, (2)
where A ≡ [ai,j]i,j=1,...,4 is the matrix that captures the contemporaneous interaction among the
variables included in zt. Extracting the structural shocks from the residuals requires knowledge of
the matrix A. As is well known, however, under conditional homoscedasticity of the structural shocks, projecting zt on its own lags does not provide sufficient information to identify all the
elements of A. As discussed below, our empirical methodology relaxes the assumption that the shocks are conditionally homoscedastic, so that no arbitrary restrictions need to be imposed to identify fiscal shocks and their effects. Nonetheless, we require that the elements of A satisfy a minimal set of cross-equation restrictions that ensure that system (1) is a coherent framework for the analysis of fiscal policy.
More specifically, we consider the following model:
νb,td = −ανq,t+ β(νy,t− ντ,t) + σdǫd,t, (3)
νp,t ≡ νg,t− ντ,t = νq,t+ νb,ts , (4)
νg,t = ηgνy,t+ θgσdǫd,t+ ψgστǫτ,t+ σgǫg,t, (5)
ντ,t = ητνy,t+ θτσdǫd,t+ ψτσgǫg,t+ στǫτ,t. (6)
Equation (3) is the demand of newly issued government bonds (Treasury bills), expressed in in-novation form. It states that the demand for bonds, νb,td , depends on the price of bonds, νq,t, on
disposable income, νy,t− ντ,t, and on a demand shock, ǫd,t, scaled by the parameter σd. The
pa-rameter α, which measures (the absolute value of) the slope of the demand curve, is assumed to be positive and different from 1, and β is a positive parameter. Rather than taking a stand on the
process by which the government determines the quantity of newly issued bonds, we simply require that this quantity satisfies the (linearly approximated) government’s budget constraint. The latter is given by equation (4), which states that the innovation in the primary deficit, νp,t, (i.e., the
difference between government spending and taxes) must be equal to the innovation in the value of debt. Note that because this constraint is expressed in innovation form, it does not include the payment for bonds that mature in period t (since those bonds were issued in period t − 1). Equa-tions (5) and (6) describe the procedures followed by the government to determine fiscal spending and taxes. The disturbances ǫg,t and ǫτ,t are the fiscal shocks that we aim to identify. The former
is a shock to government spending and the latter is a tax shock. The terms σg and στ are scaling
parameters. Equation (5) states that government spending may change in response to changes in output or to demand and tax shocks. Equation (6) has an analogous interpretation for taxes. As we explain below, different procedures to set fiscal policy will be characterized by different values of the parameters β, ηg, ητ, θg, θτ, ψg and ψτ.
Imposing equilibrium in the bonds market and solving for the structural innovations, ǫt, in
terms of the residuals, νt, yield
a11 a12 a13 a14 −σβ d α−1 σd 1 σd β−1 σd ψg(ητ−βθτ)−(ηg−βθg) σg(1−ψgψτ) (1−α)(θg−θτψg) σg(1−ψgψτ) 1−θg+θτψg σg(1−ψgψτ) (1−β)(θg−θτψg)−ψg σg(1−ψgψτ) ψτ(ηg−βθg)−(ητ−βθτ) στ(1−ψgψτ) (1−α)(θτ−θgψτ) στ(1−ψgψτ) ψτ(θg−1)−θτ στ(1−ψgψτ) 1+(1−β)(θτ−θgψτ) στ(1−ψgψτ) vy,t vq,t vg,t vτ,t = ǫ1,t ǫd,t ǫg,t ǫτ,t (7) where a1j (j = 1, ..., 4) are unconstrained parameters.
The conditional scedastic structure of system (7) is:
Σt= A−1ΓtA−1 ′
, (8)
where Σt = Et−1(νtνt′) is the (non-diagonal) conditional covariance matrix of the statistical
in-novations and Γt = Et−1(ǫtǫ′t) is the (diagonal) conditional covariance matrix of the structural
innovations. The unconditional variances of the structural innovations are normalized to unity (I = E(ǫtǫ′t)). The dynamics of the conditional variances of the structural innovations are
deter-mined by
Γt= (I − ∆1− ∆2) + ∆1• (ǫt−1ǫ′t−1) + ∆2• Γt−1. (9)
The operator • denotes the element-by-element matrix multiplication, while ∆1and ∆2are diagonal
matrices of parameters. Equation (9) involves intercepts that are consistent with the normalization I = E(ǫtǫ′t). Also, (9) implies that all the structural innovations are conditionally homoscedastic if
∆1 and ∆2 are null. On the other hand, some structural innovations display time-varying
[GARCH(1,1)] processes if ∆1and ∆2— which contain the ARCH and GARCH coefficients,
respec-tively — are positive semi-definite and (I − ∆1− ∆2) is positive definite. Finally, all the conditional
variances follow GARCH(1,1) processes if ∆1, ∆2, and (I − ∆1− ∆2) are positive definite.
2.2 Identification
Under conditional heteroscedasticity, system (7) can be identified, allowing us to study the effects of fiscal policy shocks. The sufficient (rank) condition for identification states that the conditional variances of the structural innovations are linearly independent. That is, λ = 0 is the only solution to Γλ = 0, such that (Γ′Γ) is invertible — where Γ stacks by column the conditional volatilities associated with each structural innovation. The necessary (order) condition requires that the conditional variances of (at least) all but one structural innovations are time-varying. In practice, the rank and order conditions lead to similar conclusions, given that the conditional variances are parameterized by GARCH(1,1) processes (see Sentana and Fiorentini, 2001).
To understand how time-varying conditional volatility helps with identification, first note that the unconditional variances of the statistical and structural shocks are related through
Σ = A−1A−1′. (10)
Assuming the SVAR includes n variables, the estimate of Σ allows to identify n(n+1)2 of the n2 elements of A, leaving n(n−1)2 elements to be identified. Note also that (8) implies
∆Σt= Σt− Σt−1 = A−1[Γt− Γt−1] A−1 ′
= A−1[∆Γt] A−1 ′
. (11)
This set of equations allows to identify k(k+1)2 additional parameters of A, where k is the rank of ∆Γt. Hence, if ∆Γt has a rank of at least n − 1, identification can be achieved. In our context, a
necessary condition for this is that at least n − 1 structural innovation are time-varying.
Under conditional homoscedasticity of the structural disturbances (i.e., when ∆1 and ∆2 are
null), (8) and (10) coincide, so that (11) becomes non-informative. In this case, n(n−1)2 arbitrary restrictions need to be imposed on the elements of A in order to achieve identification. These re-strictions reflect the econometrician’s belief about the relevant policy indicator and/or transmission mechanism of fiscal shocks. We now show how our empirical model nests various commonly used restrictions of both types.
2.2.1 Restrictions associated with the policy indicator
The third equation of system (7) shows how the government spending shock is related to the VAR residuals:
where a31 = ψg(ητ− βθτ) − (ηg− βθg) σg(1 − ψgψτ) , a32 = (1 − α) (θg− θτ ψg) σg(1 − ψgψτ) , a33 = 1 − θg + θτψg σg(1 − ψgψτ) , a34 = (1 − β) (θg− θτ ψg) − ψg σg(1 − ψgψτ) .
The term on the right-hand side of equation (12) defines the fiscal-spending indicator (in innovation form). Since the coefficients a3j (j = 1, ..., 4) are functions of freely estimated parameters, this
policy indicator is not constrained to be summarized by a single variable (or a particular subset of variables). This contrasts with existing empirical studies, which make a priori assumptions about the relevant policy indicator in order to achieve identification. Most of these studies assume that the fiscal-spending indicator is government spending (Blanchard and Perotti, 2002, Gal`ı, L´opez-Salido and Vall`es, 2007). Fat`as and Mihov (2001b), on the other hand, use the primary deficit as a broad indicator of fiscal policy (i.e., without distinction between government spending and tax policies). The parametric restrictions under which government spending and the primary deficit measure the stance of fiscal spending are the following:
• G indicator (government spending ): ηg = θg = ψg = 0. In this case, changes in government
spending are completely predetermined with respect to the current state of the economy and do not reflect any systematic/automatic response of the government. It is easy to show that under these restrictions the policy shock is proportional to the innovation to government spending (ǫg,t=
1 σgνg,t).
• PD indicator (primary deficit ): ηg = ητ, θg= θτ and ψg = 1. Under this scenario, the government
targets the primary deficit when setting fiscal spending. Unexpected changes in the primary deficit therefore reflect purely government spending shocks (ǫg,t= (1−ψ1τ)σgνp,t).
Analogously, the fourth equation of system (7) is
where a41 = ψτ(ηg− βθg) − (ητ − βθτ) στ(1 − ψgψτ) , a42 = (1 − α) (θτ− θg ψτ) στ(1 − ψgψτ) , a43 = ψτ(θg− 1) − θτ στ(1 − ψgψτ) , a44 = 1 + (1 − β) (θτ− θg ψτ) στ(1 − ψgψτ) .
Two cases of interest are nested in the rule above. The first defines the relevant indicator of tax policy as cyclically adjusted government revenue, as in Blanchard and Perotti (2002). In the second, the tax-policy indicator is the primary deficit. The corresponding restrictions are:
• CAT indicator (cyclically adjusted taxes): θτ = ψτ = 0. In this case, tax shocks are measured
with unexpected changes in the fraction of government revenue that does not vary automatically or systematically with output (ǫτ,t = ντ,t−ησττνy,t).
• PD indicator (primary deficit ): ηg= ητ, θg = θτ and ψτ = 1. In this case, tax shocks correspond
to unexpected changes in the primary deficit (ǫτ,t= (ψg−1)σ1 τνp,t).
2.2.2 Restrictions associated with the transmission mechanism
Each of the policy indicators discussed in the previous section implies 3 different restrictions on the elements of A (2 in the case of the CAT indicator). Therefore, 3 additional restrictions (4 in the case of the CAT indicator) have to be imposed in order to achieve identification. These restrictions in turn determine the way in which fiscal shocks affect the endogenous variables over time. In the case of a government spending shock, the literature typically completes identification via a Cholesky decomposition of the covariance matrix of the VAR residuals, which yields three additional zero restrictions (see, for example, Fat´as and Mihov, 2001a and Gal´ı, L´opez-Salido and Vall´es, 2007). By ordering government spending first among the variables included in the VAR, this scheme implies that the matrix A in (1) is lower triangular, so that system (7) becomes
˜ a11 0 0 0 ˜ a21 ˜a22 0 0 ˜ a31 ˜a32 ˜a33 0 ˜ a41 ˜a42 ˜a43 a˜44 vg,t vy,t vτ,t vq,t = ǫg,t ǫ1,t ǫτ,t ǫd,t . (14)
This identification scheme can be obtained as a special case of system (7) by imposing the following restrictions: a12 = a14 = θτ = 0, in addition to three restrictions associated with the G indicator.
Note that the ordering of the remaining variables is irrelevant when computing the effects of a government spending shock.
Blanchard and Perotti (2002) propose an alternative, non-recursive, scheme to identify the ef-fects of a government spending shock. In the context of our four-variable SVAR, their identification scheme implies ˜ a11 0 0 0 ˜ a21 ˜a22 ˜a23 0 ˜ a31 −x˜a33 ˜a33 0 ˜ a41 ˜a42 ˜a43 a˜44 vg,t vy,t vτ,t vq,t = ǫg,t ǫ1,t ǫτ,t ǫd,t , (15)
where x is the elasticity of taxes with respect to output, which is estimated outside the SVAR. The system above can be obtained by setting a12 = θτ = 0 and ητ = x in (7), in addition to
the restrictions associated with the G indicator. It is worth emphasizing that the recursive and non-recursive schemes given by (14) and (15) yield identical responses to a government spending shock since they imply identical estimates of the parameters ˜ai1 (i = 1, ..., 4).
To identify the effects of a tax shock, Blanchard and Perotti relax the assumption that ˜a12= 0
and assume instead that taxes are predetermined with respect to government spending. This yields ˜ a11 ˜a12 −˜a12/x 0 ˜ a21 ˜a22 ˜a23 0 0 −x˜a33 ˜a33 0 ˜ a41 ˜a42 ˜a43 a˜44 vg,t vy,t vτ,t vq,t = ǫg,t ǫ1,t ǫτ,t ǫd,t . (16)
In this specification, the precise value of x imposed by Blanchard and Perotti captures exclusively the automatic adjustment of taxes to output.4 This system can be obtained from (7) by imposing a12= θg= ηg= 0 and ητ = x, in addition to the two restrictions associated with the CAT indicator.
Under conditional homoscedasticity, none of these identifying restrictions can be tested; thus, no formal criterion can be used to choose among competing identification schemes. This is possible, however, under our identification method (which exploits the conditional heteroscedasticity of the shocks) since it leaves unrestricted the elements of A. We perform this exercise in Sections 3.2.1 and 3.3.3.
2.3 Estimation method and data
The elements of A, ∆1, and ∆2 are estimated using the following two-step procedure. We first
estimate by ordinary least squares a m−order VAR that includes output, the price of bonds,
4
Note that the first and third equations of (16) can be rewritten as
vg,t = ˜ a12 x˜a11˜a33 ǫτ,t+ 1 ˜ a11 ǫg,t, vτ,t = xvy,t+ 1 ˜ a33 ǫτ,t.
government spending and taxes,5 and extract the implied residuals, νt, for t = m + 1, ..., T. For
given values of the elements of the matrices A, ∆1, and ∆2, it is then possible to construct an
estimate of the conditional covariance matrix Σt recursively, using equations (8) and (9) and the
initialization Γm = I. Assuming that the residuals are conditionally normally distributed, the
second step consists in selecting the elements of the matrices A, ∆1, and ∆2 that maximize the
likelihood of the sample.
We use quarterly U.S. data from 1960:1 to 2007:4. In their main analysis, Blanchard and Perotti (2002) excluded the 1950s on the ground that this period was characterized by exceptionally large spending and tax shocks. Since one of our objectives is to compare our results to theirs, we restrict our sample to the post-1960 period. Output is measured by real GDP. The price of bonds is measured by the inverse of the gross real return on 3-month treasury bills, where the CPI is used to deflate the gross nominal return. Government spending is defined as the sum of federal (defense and non-defense), state and local consumption and gross investment expenditures. Taxes are defined as total government receipts less net transfer payments. The data are taken from the National Income and Products Accounts (NIPA), except for the 3-month treasury bill rate, which is obtained from the Federal Reserve Bank of Saint-Louis’ Fred database.6 Output, government spending and taxes are divided by total population (taken from Fred) and all the series are expressed in logarithm.
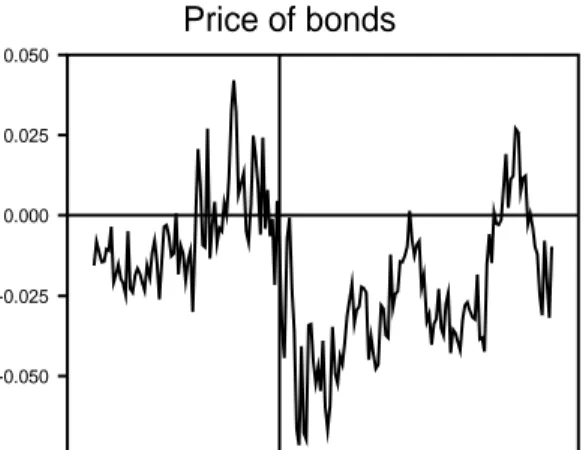
The transformed series are depicted in Figure 1. The series of output, government spending and taxes exhibit a clear upward trend, but that of the price of bonds appears to have two distinct regimes separated by a break around the end of the 1970s. This observation suggests that it may not be appropriate to estimate (7) over the entire sample period. To determine the cutoff date in a more formal and precise way, we applied Andrews and Ploberger’s (1994) structural break test to detect changes in the trend of the price of bonds. The test suggests that there is a break at 1979:2. We therefore consider the two sub-periods: 1960:1–1979:2 and 1979:3–2007:4.
3.
Results
3.1 Parameter estimates and specification test
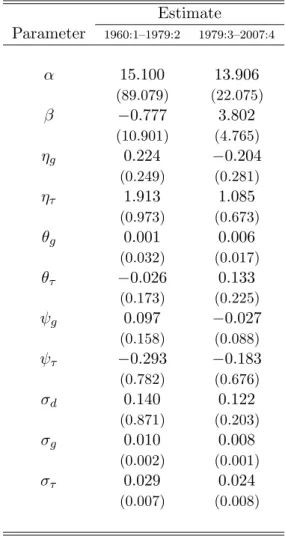
Estimates of the GARCH(1,1) parameters are reported in Table 1. These estimates indicate that U.S. tax shocks exhibit a persistent conditional variance, as the sum of the ARCH and GARCH coefficients exceeds 0.85 in both sub-periods. For government spending shocks, this is only the case in the pre-1979 period. More importantly, the estimates imply that the order and rank conditions for identification are always satisfied, which means that fiscal policy shocks and their effects can be identified through the conditional heteroscedasticity of the structural innovations.
5
A constant and a trend are also included among the regressors.
6
Table 2 reports estimates of the structural parameters. With a few exceptions, the estimates differ substantially across the two periods, thus confirming the presence of instability and justifying the need to focus on sub-periods rather than the entire sample period. Recall that the model presented in Section 2 imposes restrictions only on the parameters α and β. The former has to be positive and different from 1, while the latter must take a positive value. The requirements for α are satisfied in both periods, but we obtain a positive estimate of β only for the post-1979 period. None of the point estimates is precise, however. Our model also implies that the linear restriction a21+ a23 = −a24 must hold. A likelihood-ratio test of this restriction indicates that it cannot be
rejected at standard significance levels in any of the two sub-periods (see Table 3). This suggests that system (7) represents an adequate specification of the data, so we henceforth refer to it as the unrestricted system and to its implications as the unrestricted ones. As stated above, this system can be used to test the identifying restrictions associated with the various indicators of fiscal policy and with the different transmission mechanisms usually assumed in the literature.
3.2 Fiscal policy indicators
Our empirical approach implies that the appropriate indicator of fiscal policy is an unrestricted linear combination of output, the price of bonds, government spending and taxes. On the other hand, each of the commonly used indicators discussed above implies a set of parametric restrictions that we formally test below. We also graphically compare the time series of fiscal policy shocks implied by the unrestricted system and those associated with the restricted indicators. Finally, we discuss the predictability of our measured fiscal policy shocks.
3.2.1 Tests of the restricted indicators
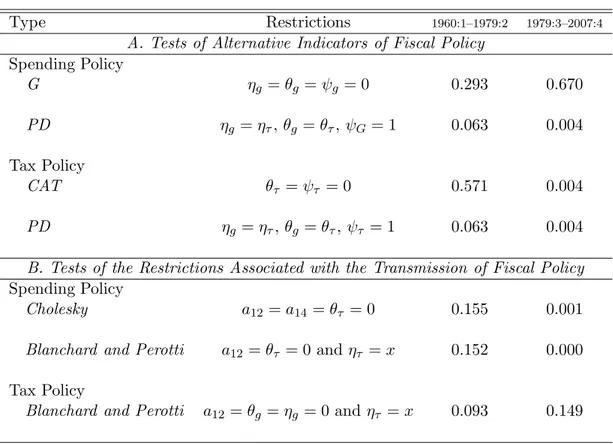
The restrictions associated with each of the fiscal policy indicators are tested using a likelihood-ratio test. Panel A of Table 4 reports the results. Starting with spending policy, the results indicate that the restrictions associated with the G indicator cannot be rejected, whereas those associated with the PD indicator are clearly not supported by the data, especially in the 1979:3–2007:4 period. The former result corroborates the conclusion reached by Blanchard and Perotti (2002) based on institutional information that there is little evidence of a contemporaneous response of government spending to economic activity. In turn, this also suggests that the commonly used identifying assumption that innovations to government spending are exogenous is a plausible one.
As for tax policy, we find that the restrictions associated with the CAT indicator are consistent with the data only in the 1960:1–1979:2 period, but that they are soundly rejected in the post-1979 period. Thus, purging the automatic/systematic response of taxes to economic activity is not sufficient to isolate the purely exogenous component of tax changes, at least when focusing on more
recent data. The message that the unrestricted model conveys is that one also needs to purge the systematic response of taxes to government spending and demand shocks.
3.2.2 Unrestricted versus restricted measures of fiscal policy shocks
Using the estimates of the elements of A and the statistical innovations extracted in the first step of our estimation procedure, it is straightforward to recover (via equation 2) the time series of structural shocks and, in particular, fiscal policy shocks, implied by the unrestricted system and each of the restricted policy indicators discussed above. Figure 2 depicts the unrestricted and restricted series of government spending shocks. Figure 3 shows the series of tax shocks. Table 5 reports the correlation coefficients between the unrestricted and restricted measures of fiscal policy shocks.
Figure 2 shows that the time series of government spending shocks obtained under the restric-tions associated with the G indicator tracks very closely the unrestricted measure of shocks in each of the two sub-samples. The correlation between the two series is 0.99 in the first sub-period and 0.97 in the second. On the other hand, the time series of shocks obtained under the restrictions associated with the PD indicator are weakly correlated with their unrestricted counterparts, espe-cially in the post-1979 period. This weak correlation reflects frequent and sometimes important gaps with respect to the valid measures of government spending shocks. In particular, imposing the restrictions associated with the PD indicator would lead the econometrician to substantially underestimate the unexpected increase in public spending that occurred during the Vietnam-WAR period (mid-1960s) and to completely miss the one that followed September 11, 2001. These results are consistent with the test results discussed in the previous section and confirm that the primary deficit is a poor indicator of fiscal spending.
Regarding tax shocks, Figure 3 reveals that the restrictions associated with the CAT indicator do not occasion any major mis-measurement of tax innovations in the pre-1979 period: the correlation between the restricted and unrestricted series of innovations is 0.98 in this sub-period. In the post-1979 period, however, these restrictions entail some important counterfactual implications, which explain their statistical rejection discussed in the previous section. For example, under these restrictions, one would mistakenly conclude that there were substantial exogenous tax cuts in 1994 and tax increases in 1999. The restrictions associated with the PD indicator, for their part, generate a measure of tax shocks that deviates markedly from the unrestricted one in both sub-samples, although the fit is much worse in the post-1979 period. This again confirms that the primary deficit is not an appropriate indicator of tax policy.
3.2.3 Are fiscal policy shocks anticipated ?
The SVAR approach has often been criticized on the ground that it may not be robust to fiscal foresight, i.e., the phenomenon that, due to legislative and implementation lags, future changes in fiscal policy are signaled to economic agents several months before they become effective.7 To
the extent that agents adjust their behavior in response to anticipated shocks, the resulting time series may have a non-invertible moving average component, such that it would be impossible to recover the true fiscal shocks from current and past variables.8 Ramey (2008) presents suggestive evidence that the SVAR-based innovations miss the timing of the news and are in fact predictable. More specifically, she shows that the government spending shocks extracted from a standard SVAR (identified via a Cholesky decomposition) are Granger-caused by Ramey and Shapiro’s (1998) war dates.9
In order to investigate whether this criticism also applies to our government spending shocks, we subject them to the Granger causality test performed by Ramey. More precisely, we regress government spending shocks on four lags of a dummy variable that represents the war dates, and test the joint significance of the regression coefficients. The results are reported in Panel A of Table 6. They indicate that the Ramey-Shapiro dates do not Granger-cause the (unrestricted) government spending shocks in any of the two periods.10 Interestingly, even when we consider the shocks
implied by the restricted policy indicators of fiscal spending, we strongly reject the hypothesis that they are Granger-caused by the war dates.11 We conclude that the SVAR government spending shocks correctly capture unexpected changes in public expenditures. The fact that this result holds across several identification schemes suggests that Ramey’s findings are most likely driven by the Korean-War episode, which is not covered by our sample period.12
To undertake an analogous check for tax shocks, we use the dates isolated by Romer and Romer (2008) to identify “exogenous” changes in tax policy based on presidential speeches and Congressional reports. In Romer and Romer’s terminology, these exogenous changes correspond to legislated tax policy actions that are not taken for the purpose of offsetting factors that could affect output growth. Panel B of Table 6 reports Granger-causality results for the SVAR tax shocks.
7
Leeper, Walker and Yang (2008) review the literature that reports reduced-form and anecdotal evidence on the extent of fiscal foresight.
8
See Sims (1988), Hansen and Sargent (1991), Yang (2005), and Leeper, Walker and Yang (2008).
9
Ramey (2008) adds 2001:3 to three episodes previously identified by Ramey and Shapiro (1950:3, 1965:1, 1980:1).
10
This result is robust to using 1, 2 or 3 lags. We also considered the new military dates isolated by Ramey (2008) based on her reading of Business Week and the New York Times, and found no evidence that these dates Granger-cause the SVAR government spending shocks.
11
The only exception occurs in the case of the PD indicator, for which government spending shocks are Granger-caused by the war dates in the 1979:3–2007:4 period.
12
We verified that once we extend the sample period to include the Korean War (that is, when we consider the period 1947:1–2007:4), we recover Ramey’s result that the war dates Granger-cause the SVAR-based government spending shocks.
These results clearly show that Romer and Romer’s dates do not Granger-cause the SVAR tax shocks, irrespective of the time period and the specification.13 This means that these shocks are not forecastable based on the dates of legislated exogenous tax changes.
Together, these findings suggest that the fiscal-foresight problem is not sufficiently severe to hinder the ability of the SVAR approach to correctly identify unanticipated fiscal policy shocks.14 This could be due to the fact that economic agents do not behave in a forward-looking manner, either because they are myopic or because they are prevented from doing so (due, for example, to liquidity constraints). A more plausible explanation, however, is that an important fraction of fiscal policy shocks are in fact unanticipated.15 A recent study by Mertens and Ravn (2009b) lends support to this conjecture. Using artificial data generated by a neoclassical model with anticipated and unanticipated fiscal shocks, these authors show that the SVAR approach can successfully recover the true impulse responses to a unanticipated fiscal shocks provided that these shocks account for a relatively large fraction of the variance of fiscal variables. Mertens and Ravn also estimate the effects of unanticipated government spending shocks in the U.S. using an augmented SVAR procedure that is robust to the presence of anticipated effects and find very similar results to those obtained from a standard SVAR.16
3.3 Dynamic effects of fiscal policy shocks
In this section, we study the dynamic effects of unanticipated spending and tax shocks and their importance in accounting for aggregate fluctuations. We then contrast these results with those obtained upon imposing the identifying restrictions commonly used in the literature.
3.3.1 Dynamic responses
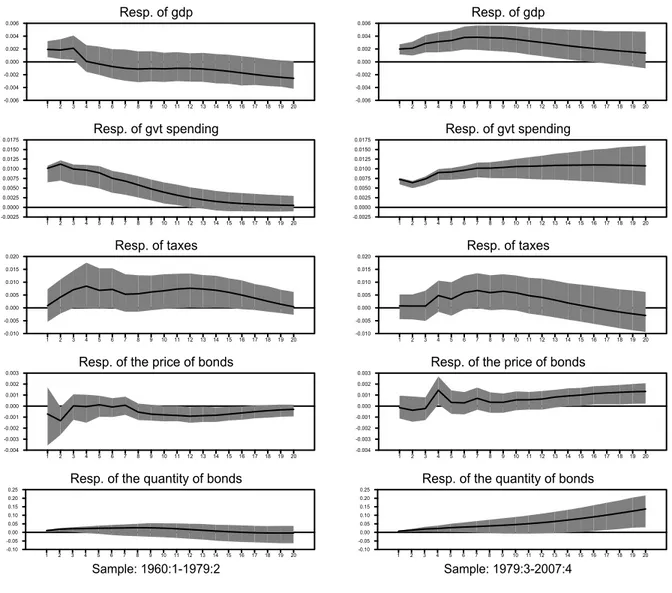
Figures 4 and 5 report the dynamic responses of output, government spending, taxes, the price of bonds, and the quantity of bonds to a government spending shock and to a tax shock, respectively. In each case, the shock is normalized to its unconditional standard deviation, i.e., unity. Since the quantity of bonds is not included in the SVAR, its response is constructed residually using
13
There are only two dates for which Romer and Romer report simultaneously tax changes taken for exogenous and endogenous reasons. Excluding these two dates does not alter the outcome of our Granger-causality test.
14
Perotti (2004) also finds little evidence that the SVAR fiscal innovations are predictable in a sample of 5 OECD countries. More specifically, he shows that these innovations are, in general, uncorrelated with the OECD forecasts of government spending and GDP growth.
15
As emphasized by Perotti (2004), throughout a given fiscal year, there are often supplements to the Budget and other decisions by the governments that affect the outcome of fiscal policy. Moreover, Mertens and Ravn (2009b) point out that of the 70 changes in the tax bill identified by Romer and Romer (2008) as being exogenous, 32 took effect within 90 days of the date on which they were legislated. In their empirical analysis, Mertens and Ravn treat these tax changes as being unanticipated
16
the government budget constraint. The figures also report (possibly asymmetric) 68% confidence intervals computed using the procedure developed by Sims and Zha (1999).
Government spending shock
The upper panels of Figure 4 show that, in both sub-periods, a positive government spending shock leads to a temporary increase in output. The shape and the magnitude of the output response differ sharply, however, across the two periods: in the pre-1979 period, the increase in output is largest on impact and is statistically significant only during the first three quarters following the shock. In the subsequent quarters, the response becomes statistically insignificant. In contrast, in the post-1979 period, the response of output is persistent, mostly statistically significant, and hump-shaped, reaching its maximum at around 6 quarters after the shock.
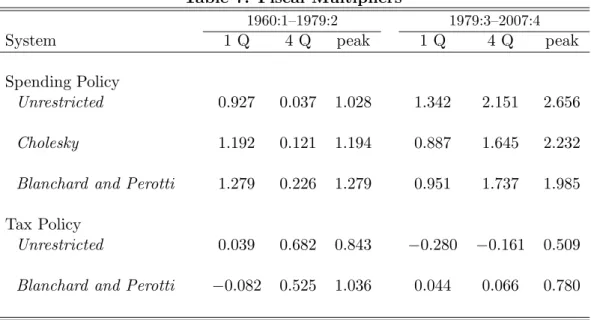
As is common in the literature, we quantify the effects of government spending shocks on output by computing the associated multiplier, which is defined as the dollar change in output that results from a dollar increase in the exogenous component of public spending. Table 7 reports the value of the multiplier on impact, at the 4 quarter horizon and at the peak. In the 1960:1–1979:2 period, the spending multiplier is 0.93 on impact and barely exceeds 1 at the peak. The corresponding numbers for the 1979:3–2007:4 period are 1.34 and 2.66, respectively. These numbers indicate that fiscal spending appears to have become more effective in stimulating economic activity after 1979. Figure 4 shows that taxes are initially essentially unresponsive to the government spending shock, suggesting that the increase in spending is mostly financed by debt. Since the price of bonds decreases on impact in the first sub-period and remains roughly constant in the second, the government budget constraint implies that the quantity of issued bonds must increase in both cases (to finance the increase in public spending), which is what the lower panels of Figures 4 show.
Tax shock
Figure 5 depicts the dynamic responses to a positive tax shock. The upper panels of this figure show notable differences in the response of output across the two sub-periods. In the pre-1979 period, output remains inertial for about three quarters after the shock before starting to fall in a persistent and statistically significant manner. After reaching a trough at around six quarters after the shock, output returns gradually to trend. This U-shaped pattern is much less apparent in the post-1979 period, where the unexpected increase in taxes leads to an immediate small increase in output followed by a very persistent, though statistically insignificant, decline.17
17
Dotsey (1994) shows that a positive response of output to an increase in taxes is not necessarily at odds with economic theory. In his model, higher capita-tax rates lead to an increase in output and investment when current government deficits are financed by future distortionary taxation.
Table 7 reports the values of the tax multiplier, defined as the dollar increase in output resulting from a dollar cut in the exogenous component of taxes. The tax multiplier is essentially zero on impact in the 1960:1–1979:2 period and even negative in the 1979:3–2007:4 period. The maximum multiplier is larger in the former period than in the latter (0.84 versus 0.51), but it is less than 1 in both cases. Importantly, we find that the tax multiplier is generally smaller than the spending multiplier, consistent with traditional Keynesian theory.18 This result stands in contrast to that
reported by Mountford and Uhlig (2009) who find that tax cuts are more effective than increases in government spending to boost the economy.
A second discrepancy in the results across the two periods concerns the response of government spending, which is positive in the pre-1979 period but negative after 1979. None of these responses, however, is statistically distinguishable from 0. Thus, our results provide little support for the so-called starve-the-beast hypothesis, which states that tax cuts should lead to a reduction in future government spending. Romer and Romer (2008) have recently emphasized the importance to test this hypothesis using exogenous measures of taxes to avoid biases due to inverse causation and omitted variables. Using the narrative records to isolate legislated tax changes that are unlikely to be correlated with other factors affecting government spending, they also find little evidence in favor of the starve-the-beast hypothesis.
The price of bonds also responds asymmetrically across the two sub-samples, rising significantly in the pre-1979 period and falling in the post-1979 period. In both cases, however, the initial increase in taxes is so large (relative to the response of government spending and the price of bonds) that the quantity of issued bonds falls after the shock.
3.3.2 Variance decomposition
Figures 6 and 7 report the contribution (in percentage) of, respectively, government spending and tax shocks to the variance of the k-step ahead forecast error of output, government spending, taxes, the price and the quantity of bonds. The dashed lines delimit the confidence intervals.
Two main messages emerge from these figures. First, fiscal policy shocks explain a small fraction of output variability, especially at short horizons. Government spending and tax shock jointly explain less than 10 percent of the variance of output at horizons of less than four quarters in the pre-1979 period and less than 15 percent in the post-1979 period. Second, the relative importance of government spending and tax shocks in accounting for the variance of output has changed over time. While government spending shocks explain barely 5 percent of output variability at any given horizon before 1979, this fraction became larger than 10 percent in the post-1979 period. Conversely, the contribution of tax shocks to the variance of output fell from roughly 25 percent
18
to less than 5 percent at the 20-quarter horizon.
Variance-decomposition results also indicate that government spending shocks account for more than 90 percent of the variance of the one-quarter ahead forecast error of fiscal spending regardless of the period considered. This result reflects the notion that spending is largely predetermined with respect to economic activity (recall that the restrictions associated with the G indicator are not rejected by the data). In contrast, the contribution of taxes to the variance of the one-quarter ahead forecast error of taxes is around 70 percent, which suggests that an important fraction of tax changes occur in response to other shocks to the economy.
Finally, the results show that tax shocks are much more important than government spending shocks in accounting for the variability of the price and the quantity of bonds. The contribution of tax shocks to the variance of the price of bonds is larger than 10 percent at any horizon before 1979 and exceeds 40 percent in the post-1979 period. Government spending shocks, on the other hand, explain less than 5 percent of this variance at almost any horizon (in both periods). For the quantity of bonds, the contribution of tax shocks is always larger than 40 percent at short horizons (and reaches 75 percent in the pre-1979 period), whereas that of government spending shocks never exceeds 10 percent.
3.3.3 Comparison with the restricted systems
It is instructive at this stage to assess the implications of imposing the various sets of identifying restrictions discussed in Section 2.2. More specifically, the purpose of this section is to determine whether these restrictions lead to significant departures from the impulse-response and variance-decomposition results discussed above.19 Figure 8 superimposes on the unrestricted dynamic
re-sponses to a government spending shock those obtained using the Cholesky and Blanchard-Perotti identification schemes.20 The figure shows that the two restricted systems overestimate the effects
of government spending shocks on output in the 1960:1–1979:2 period and underestimates it in the 1979:3–2007:4 period. This is in turn reflected in the values of the spending multiplier: Table 7 shows that under the Cholesky and Blanchard-Perotti identification schemes the multiplier is larger than 1 on impact in the pre-1979 period but less than 1 in the post-1979 period, which is the opposite of what the unrestricted system predicts. A similar message is conveyed by Figure 9, which compares the unrestricted and restricted variance-decomposition results for government spending shocks. The figure shows that the two restricted systems overstate the fraction of output
19
Since the PD indicator is found to be strongly rejected in the data in both sub-samples, we shall not discuss it any further.
20
For the sake of remaining as faithful as possible to the original specification of Blanchard and Perotti (2002), the results based on their model are generated using a three-variable VAR that includes output, government spending and taxes.
variability explained by government spending shocks in the pre-1979 period, while the opposite scenario holds in the post-1979 period.
While Figures 8 and 9 show that the Cholesky and Blanchard-Perotti identification schemes lead to deviations from the unrestricted responses, these deviations are in general more pronounced in the post-1979 period. Given that the restrictions associated with the G indicator have been shown to be supported by the data (see Panel A of Table 4), these deviations are likely due to the restrictions associated with the transmission mechanism of government spending shocks. In order to investigate this conjecture, we test these restrictions using a likelihood-ratio test. The results, shown in Panel B of Table 4, indicate that, both under the Cholesky and Blanchard-Perotti schemes, these restrictions are strongly rejected by the data in the post-1979 period, but not in the pre-1979 period.21
Figure 10 contrasts the unrestricted responses to a tax shock with those implied by Blanchard and Perotti’s specification. In both periods, the latter involves significant departures from the unrestricted dynamic responses. For example, the peak response of output to a tax shock is much larger in the restricted system, with a multiplier of 1.04 in the pre-1979 period and 0.78 in the post-1979 period, whereas the corresponding numbers are 0.84 and 0.51 in the unrestricted system. Figure 11 shows that Blanchard and Perotti’s specification also implies that tax shocks account for a counterfactually large fraction of the variance of output at long horizons in the 1960:1–1979:2 period. A likelihood-ratio test of the restrictions associated with the transmission mechanism imposed by Blanchard and Perotti indicates that these restrictions are rejected at the 10 percent level in the pre-1979 period (see Panel B of Table 4). For the post-1979 period, on the other hand, these restrictions are not rejected by the data, which suggests that the discrepancy with respect to the unrestricted results are mainly due to the restrictions associated with the CAT indicator (which are strongly rejected in this period. See Panel A of Table 4).
3.4 Testing Ricardian Equivalence
Our framework can be used to test the Ricardian-equivalence hypothesis, according to which a tax shock that does not alter the path of government spending should not affect the price of bonds or output. This prediction is based on the argument that, keeping government spending constant, a temporary decrease in taxes should lead to an equal (in present value) increase in future tax liabilities, leaving the households’ intertemporal budget constraint, and therefore private spending, unchanged (see Barro 1974). In order to test this hypothesis, we proceed as follows. We first estimate system (7) under the requirement that government spending does not respond to a tax
21
Blanchard and Perotti (2002) estimate the average output elasticity of taxes, x, to be 2.08 based on data from 1947:1 to 1997:4. In our tests, however, we consider the values of 1.75 and 1.97 estimated by Perotti (2004) for the periods 1960:1–1997:4 and 1980:1–2001:4, respectively.
shock at any horizon. To do so, we impose ηg = ψg = 0, so that there is no contemporaneous
effect of the tax shock on government spending, and zero restrictions on the relevant elements of the reduced-form VAR matrices, Ci ≡ A−1Ai, to ensure the tax shock has no effect on future levels
of government spending. We then extract the implied residuals and estimate the elements of A as explained in Section 2. Finally, we test the restrictions β = 1 and a14 = b14 = 0, which jointly
imply that output and the price of bonds do not respond to the tax shock either contemporaneously or with a lag.
The dynamic responses to a tax shock under the restriction that it does not affect the path of government spending are shown in Figure 12. Note that the response of government spending is nil by construction in both periods. The responses of the remaining variables exhibit some important differences across the two periods, both in terms of sign and shape. In the pre-1979 period, output remains unresponsive to the tax shock (at least in a statistical sense), before declining significantly for a prolonged period of time. In the post-1979 period, there is a short-lived increase in output, followed by an insignificant fall in subsequent quarters. The tax shock also triggers a significant increase in the price of bonds in the pre-1979 period, but a significant and persistent decline after 1979. Together, these results suggest that Ricardian equivalence does not hold. This conclusion is formally confirmed by a likelihood-ratio test, which indicates that the parametric restrictions β = 1 and a14= b14= 0 are strongly rejected in the two periods considered (see Table 8).
4.
Extensions
Having analyzed the effects of fiscal policy shocks on aggregate output, we now investigate how these shocks affect private consumption and investment. This exercise is useful on two counts. First, it helps determine which type of private expenditure is more responsive to fiscal policy, thus allowing a better understanding of the channels through which fiscal instruments affect aggregate output. Second, the response of private consumption to unanticipated changes in government spending is useful to discriminate between competing views of fiscal policy: According to Keynesian theory, an increase in government spending should lead to an increase in consumption, whereas standard neoclassical model predict that public spending crowds out consumption due to a negative wealth effect (Barro and King, 1984 and Baxter and King, 1993). While most of existing studies using SVARs tend to corroborate the crowding-in effect, the magnitude of this effect is sensitive to identification. Furthermore, this effect may well vanish altogether if one relaxes the commonly used identifying assumptions.
To examine the implications of our unrestricted SVAR for consumption and investment, we extend system (7) by adding each of these two variables one at a time in a way that preserves
specification (3)–(6) but that leaves the dynamics of the added variable unrestricted (as is the case for output). The implied dynamic responses of consumption to government spending and tax shocks are reported in Figures 13 and 14, respectively. The corresponding results for investment are shown in Figures 15 and 16. In order to gain further insights into the effects of fiscal policy shocks on the different categories of private spending, we also report results for durable and non-durable consumption and for residential and non-residential investment.
4.1 Consumption
In response to an unexpected increase in government spending, total consumption rises significantly in the two periods considered (Figure 13). In the pre-1979 period, the increase is large but short lived, becoming statistically insignificant within a year after the shock. A much more persistent pattern is observed in the post-1979 period, where the rise in consumption remains statistically significant for roughly three years. Looking at the response of durables and non-durables, one can see that the increase in total consumption before 1979 reflects almost exclusively the rise in the consumption of non-durable goods–the response of durable consumption being nil on impact and statistically insignificant at all horizons. In contrast, after 1979, both consumption categories contribute to the observed increase in total consumption. In sum, there is strong evidence of a crowding-in effect of public spending on private consumption, contrary to neoclassical theory.22
In the pre-1979 period, an unanticipated increase in taxes lowers total and non-durable con-sumption, but with a delay of several quarters (Figure 14). In both cases, the response is statistically significant in a window of 6 to 12 quarters after the shock and reaches its trough at around 9 quarters after the shock. Durable consumption, on the other hand, displays an oscillatory but statistically insignificant response. In the post-1979 period, tax shocks do not affect total consumption or its two categories in any significant manner. These findings corroborate our earlier conclusion that U.S. tax policy has become less effective after 1979.
4.2 Investment
According to the point estimates in Figure 15, a positive government spending shock decreases total investment in the pre-1979 period and raises it in the post-1979 period. Both responses, however, are statistically insignificant. While the response of non-residential investment is completely muted before 1979 and mostly statistically insignificant after 1979, residential investment reacts strongly but quite differently across the two periods: Before 1979, it begins to decline gradually until it
22
Several explanations have been proposed to reconcile theory with data. Most of these explanations operate through consumer preferences (Bouakez and Rebei, 2007, Ravn, Schmitt-Groh´e, and Uribe 2007, Monacelli and
Perotti, 2008). Gal´ı, L´opez-Salido and Vall´es (2007), on the other hand, propose a resolution that emphasizes the
reaches a significantly large trough at around 7 quarters after the shock, whereas it reacts positively after 1979, at least during the two quarters following the shock.
A significant sub-sample instability is also found in the response of total investment to a tax shock. After an initial increase during the two quarters following the shock, total investment falls significantly for several quarters in the pre-1979 period, while it continues to rise in a hump-shaped manner in the post-1979 period. These patterns are also apparent in the dynamic responses of non-residential investment. As for residential investment, we find that it exhibits a delayed decline in both sub-periods, reaching its trough between 1 and 2 years after the shock.
Overall, these results indicate that fiscal policy shocks affect aggregate output mainly through their effect on private consumption. Investment is essentially unresponsive to government spending shocks, and although it increases sharply following a tax cut, this effect only marginally affects output.
5.
Concluding Remarks
The purpose of this paper was to estimate the macroeconomic effects of fiscal policy shocks in the U.S. using an alternative empirical methodology that relaxes the identifying restrictions commonly used in the SVAR literature. Identification is instead achieved by exploiting the conditional het-eroscedasticity of the structural innovations. This approach avoids making arbitrary assumptions about the relevant policy indicator or its transmission mechanism.
Several important findings emerge from this study. First, based on historical data, increases in government spending are found to be more effective than tax cuts in stimulating U.S. economic ac-tivity. This result suggests that the $800 Billion stimulus package enacted by Congress in February 2009, which allocates less than 20 percent of the funds to increases in government purchases, might not be optimally designed. Second, the dynamic effects of fiscal policy shocks and their relative importance to output fluctuations have changed significantly after 1979. Since this date is also believed to have marked an important shift in U.S. monetary policy, it would be interesting to in-vestigate whether, and to what extent, the two phenomena are linked. Third, the crowding-in effect of public spending on private consumption documented in earlier SVAR-based studies is robust to relaxing conventional identifying assumptions. While a number of solutions have been proposed to reconcile this evidence with neoclassical theory, we believe more empirical work is needed to unravel the exact mechanism that gives rise to the positive covariance of public and private expenditures.
References
[1] Andrews, Donald W. K., and Werner Ploberger (1994), “Optimal Tests When A Nuisance Parameter Is Present Only Under The Alternative,” Econometrica 62: 1383–1414.
[2] Barro, Robert J. (1974), “Are Government Bonds Net Wealth?” Journal of Political Economy 82: 1095–1117.
[3] Barro, Robert J. and Robert G. King (1984), “Time-Separable Preferences and Intertemporal-Substitution Models of Business Cycles,” Quarterly Journal of Economics 99: 817–839.
[4] Baxter, Marianne and Robert G. King (1993), “Fiscal Policy in General Equilibrium,” Amer-ican Economic Review 83: 315–334
[5] Blanchard, Olivier J. and Roberto Perotti (2002), “An Empirical Characterization of the Dynamic Effect of Changes in Government Spending and Taxes on Output,” Quarterly Journal of Economics 117: 1329–1368.
[6] Bouakez, Hafedh and Nooman Rebei (2007), “Why Does Private Consumption Rise After a Government Spending Shock?,” Canadian Journal of Economics 40: 954–979.
[7] Bouakez, Hafedh and Michel Normandin (2008), “Fluctuations in the Foreign Exchange Mar-ket: How Important are Monetary Policy Shocks?” CIRP´EE Working Paper No. 08–18.
[8] Burnside, Craig, Martin Eichenbaum and Jonas Fisher (2004), “Fiscal Shocks and Their Con-sequences,” Journal of Economic Theory 115: 89–117.
[9] Dotsey, Michael (1994), “Some Unpleasant Supply Side Arithmetic,” Journal of Monetary Economics 33: 507–524.
[10] Edelberg, Wendy, Martin Eichenbaum and Jonas Fisher (1999) “Understanding the Effects of a Shock to Government Purchases,” Review of Economic Dynamics 2: 166–206.
[11] Fat´as, Antonio and Ilian Mihov (2001a), “The Effects of Fiscal Policy on Consumption and Employment: Theory and Evidence,” manuscript, INSEAD.
[12] Fat´as, Antonio and Ilian Mihov (2001b), “Fiscal Policy and Business Cycles: An Empirical Investigation,” Moneda y Credito 212: 167–210.
[13] Gal´ı, Jordi, J. David L´opez-Salido and Xavier Vall´es (2007), “Understanding the Effects of Government Spending on Consumption,” Journal of the European Economic Association 5: 227–270.
[14] Hansen, Lars P. and Thomas J. Sargent (1991), “Two Difficulties in Interpreting Vector Au-toregressions,” in: Hansen, L.P., Sargent, T.J. (Eds.), Rational Expectations Econometrics. Westview Press, Boulder and London: 77–119.
[15] King, Mervyn, Enrique Sentana, and Sushil B. Wadhwani (1994), “Volatility and Links Be-tween National Stock Markets,” Econometrica 62: 901–933.
[16] Leeper, Eric M., Todd B. Walker and Shu-Chun Susan Yang (2008), “Fiscal Foresight: Ana-lytics and Econometrics,” manuscript, Indiana University.
[17] Mertens, Karel and Morten O. Ravn (2009a), “Measuring the Impact of Fiscal Policy in the Face of Anticipation: a Structural VAR Approach,” Economic Journal, forthcoming.
[18] Mertens, Karel and Morten O. Ravn (2009b), “Empirical Evidence on the Aggregate Effects of Anticipated and Unanticipated U.S. Tax Policy Shocks,” manuscript, Cornell University and University of Southamtpon.
[19] Monacelli, Tommaso and Roberto Perotti (2008), “Fiscal Policy, Wealth Effects, and Markups,” NBER Working Paper No. 14584.
[20] Mountford, Andrew and Harald Uhlig (2009), “What are the Effects of Fiscal Policy Shocks?” Journal of Applied Econometrics, forthcoming.
[21] Normandin, Michel and Louis Phaneuf (2004), “Monetary Policy Shocks: Testing Identification Conditions Under Time-Varying Conditional Volatility,” Journal of Monetary Economics 51: 1217-1243.
[22] Perotti, Roberto (2004), “Estimating the Effects of Fiscal Policy in OECD Countries,” Uni-versit`a Bocconi Discussion Paper No. 276.
[23] Ramey, Valerie A. (2008), “Identifying Government Spending Shocks: It’s All in the Timing,” manuscript, UCSD.
[24] Ramey, Valerie A. and Matthew D. Shapiro (1998), “Costly Capital Reallocation and the Effects of Government Spending,” Carnegie Rochester Conference Series on Public Policy 48: 145–94.
[25] Ravn, Morten O., Stephanie Schmitt-Groh´e, and Martin Uribe (2007) “Explaining the Ef-fects of Government Spending Shocks on Consumption and the Real Exchange Rate,” NBER Working Paper No. 13328.
[26] Rigobon, Roberto and Brian Sack (2004), “The Impact of Monetary Policy on Asset Prices,” Journal of Monetary Economics 51: 1553–1575.
[27] Romer, Christina D. and David H. Romer. (2008), “A Narrative Analysis of Postwar Tax Changes,” manuscript, University of California, Berkeley.
[28] Romer, Chrisitina D. and David H. Romer (2009), “Do Tax Cuts Starve the Beast: The Effect of Tax Changes on Government Spending,” Brookings Papers on Economic Activity, forthcoming.
[29] Sentana, Enrique and Gabriele Fiorentini (2001), “Identification, Estimation and Testing of Conditionally Heteroskedastic Factor Models”, Journal of Econometrics 102: 143–164.
[30] Sims, Christopher A. (1988), “Identifying Policy Effects,” in: Bryant, R., et al. (Eds.), Empir-ical Macroeconomics for Interdependent Economics. The Brookings Institution, Washington, DC: 308–321.
[31] Sims, Christopher A. and Tao Zha (1999), “Error Bands for Impulse Responses,” Econometrica 67: 1113–1157.
[32] Yang, Shu-Chun Susan (2005) “Quantifying Tax Effects Under Policy Foresight,” Journal of Monetary Economics 52: 1557–1168.
Table 1. Estimates of the GARCH(1,1) Parameters Estimate Shock Parameter 1960:1–1979:2 1979:3–2007:4 ǫ1,t ARCH 0.549 0.403 (0.365) (0.227) GARCH − 0.247 − (0.320) ǫd,t ARCH 0.040 0.340 (0.157) (0.209) GARCH − − − − ǫg,t ARCH 0.102 0.123 (0.186) (0.209) GARCH 0.758 − (0.473) − ǫτ,t ARCH 0.205 0.117 (0.250) (0.083) GARCH 0.671 0.848 (0.324) (0.128)
Notes: Figures between parentheses are standard errors. A dash (−) indicates that zero restrictions are imposed to ensure that ∆1 and ∆2 are non-negative definite.
Table 2. Estimates of the Structural Parameters Estimate Parameter 1960:1–1979:2 1979:3–2007:4 α 15.100 13.906 (89.079) (22.075) β −0.777 3.802 (10.901) (4.765) ηg 0.224 −0.204 (0.249) (0.281) ητ 1.913 1.085 (0.973) (0.673) θg 0.001 0.006 (0.032) (0.017) θτ −0.026 0.133 (0.173) (0.225) ψg 0.097 −0.027 (0.158) (0.088) ψτ −0.293 −0.183 (0.782) (0.676) σd 0.140 0.122 (0.871) (0.203) σg 0.010 0.008 (0.002) (0.001) στ 0.029 0.024 (0.007) (0.008)
Note: Figures between parentheses are standard errors.
Table 3. Test of the Restriction: a21+ a23= −a24
1960:1–1979:2 1979:3–2007:4
P-value 0.319 0.104
Table 4. Tests of Commonly Used Identifying Restrictions
Type Restrictions 1960:1–1979:2 1979:3–2007:4
A. Tests of Alternative Indicators of Fiscal Policy Spending Policy G ηg= θg = ψg = 0 0.293 0.670 PD ηg = ητ, θg = θτ, ψG= 1 0.063 0.004 Tax Policy CAT θτ = ψτ = 0 0.571 0.004 PD ηg= ητ, θg = θτ, ψτ = 1 0.063 0.004
B. Tests of the Restrictions Associated with the Transmission of Fiscal Policy Spending Policy
Cholesky a12= a14= θτ = 0 0.155 0.001
Blanchard and Perotti a12= θτ = 0 and ητ = x 0.152 0.000
Tax Policy
Blanchard and Perotti a12= θg = ηg = 0 and ητ = x 0.093 0.149
Notes: Entries are p-values of the χ2-distributed likelihood-ratio test statistics. x is fixed to 1.75