IMPACT DES ECLAIRCIES COMMERCIALES SUR LA CROISSANCE ET LA QUALITÉ DU BOIS DE L'EPINETTE NOIRE (PICEA MARIANA (MILL.) BSP) EN
FORÊT BORÉALE.
PAR
MANON VINCENT
THESE PRESENTEE A
L'UNIVERSITÉ DU QUÉBEC À CHICOUTIMI COMME EXIGENCE PARTIELLE
DU DOCTORAT EN SCIENCES DE L'ENVIRONNEMENT
Août, 2010 © Manon Vincent, 2010
RÉSUMÉ
Depuis dix ans, les limites d'exploitation des forêts d'intérêt commercial ont été atteintes dans certaines régions pour des raisons de protection du territoire. Les compagnies forestières de la région 02 (Saguenay-Lac-Saint-Jean) effectuent actuellement des traitements d'éclaircie commerciale dans les peuplements naturels d'épinette noire pour augmenter le volume du bois produit en forêt. Si l'évaluation du gain en volume demeure une priorité, le fait que l'augmentation de la croissance radiale induite par les traitements puisse entraîner une diminution des propriétés mécaniques du bois est à prendre en considération. En effet, s'il s'avérait que les traitements d'éclaircie effectués sur des milliers d'hectares ne rencontraient pas les standards de l'industrie en matière de résistance mécanique ou perdaient de la valeur qualitativement, l'impact sur la valeur marchande du bois serait économiquement néfaste pour la région. Nous supposons que la croissance radiale par site augmente après le traitement, mais que tous les arbres ne réagiront pas positivement à l'éclaircie. L'accélération de la croissance radiale après le traitement se traduisant par une augmentation du bois initial devant le bois final, nous devrions observer une baisse de densité du matériau. Les trois principaux objectifs de la thèse étaient donc : 1) Évaluer la variabilité de l'accroissement radial à l'échelle de la station selon les techniques standards utilisées en dendroécologie et quantifier l'accroissement en volume des tiges. 2) Déterminer la qualité du bois formé avant et après éclaircie à l'aide du module d'élasticité (MOE) et de la densité de cerne. 3) Établir un portrait économique du traitement.
Les résultats suggèrent que l'éclaircie commerciale entraine une augmentation de la croissance radiale des individus. Cette augmentation dépend cependant des
caractéristiques des arbres résiduels et de leurs compétiteurs. Bien que l'accroissement radial observé suite au traitement soit plus important à la base de l'arbre, cela n'entraine pas de variation significative de la forme ou du défilement de la tige. Aucune variation significative du MOE et de la densité n'a été notée après le traitement. Finalement sous certaines conditions de marché, Péclaircie commerciale peut augmenter la valeur finale du peuplement par rapport à un peuplement non traité. Le "timing" de l'opération pourrait donc influencer la rentabilité des éclaircies commerciales.
Mots Clés : Éclaircie commerciale, Épinette noire, qualité du bois, croissance radiale, module d'élasticité, défilement, densité de cerne, rendement, forêt boréale, défilement.
ABSTRACT
For the last ten years the forests allocated to commercial interests have declined due land conservation, to respect the territorial claims of the First Nations and because the limits of exploitation were attained in certain regions. It is thus necessary to find strategies to increase the volume of wood produced in the remaining forests. The silvicultural practices, such as the thinning, have been effective for several decades in mixed and leafy forests in southern Quebec, but more recently have been used in a less informed way in the northern forests. The forestry companies of the region 02 (Saguenay Lac St-Jean) currently use treatments of commercial thinning in black natural spruce stands. The evaluation of the volume yield in volume remains a priority; on the other hand, the increase in radial growth caused by the thinning treatments can be associated with a decrease in mechanical wood properties. This has to be considered both during the first transformation and when evaluating the wood quality. Coniferous trees respond to increased light by producing some weaker density wood. If it turns out that thinning performed on thousands of hectares of land does not attain the industry standards in terms of mechanical resistance or depreciated quality, the impact on the market value of the wood coming from region 02 would be economically fatal. The main objectives of the thesis were to: 1) Establish radial and volume growth increment at the individual and at the stand scale using dendroecological methods. 2) Determine wood quality variations (modulus of elasticity - MOE - and ring density) before and after thinning. 3) Estimate economical returns in thinned and control stands based on recovery products available after CT and final harvest. The results suggest that commercial thinning leads to an increase of radial growth at the individual level. Response depends upon tree diameter
Growth increment in thinned trees appears to occur at the expense of natural radial growth in the upper part of the stem. However, no significant variation in taper or stem shape has been noticed. Moreover, no significant variation in average ring density due to CT was observed after treatment, which may be explained by between-stand variability. The thinning treatment showed no significant effect on flexural MOE over a ten-year period. Eventually, compared with financial incomes for control stands, it appeared that "timing" may influence CT returns. Indeed, doing CT in natural black spruce stands 10 years before final harvest may be profitable when the lumber market was high during CT and low or lower during final harvest.
Key words: Commercial thinning, wood quality, black spruce, boreal forest, yield, radial growth, Modulus of Elasticity, ring density, taper.
RÉSUMÉ ii ABSTRACT iv TABLE DES MATIÈRES vi LISTE DES TABLEAUX XIII LISTE DES FIGURES xv REMERCIEMENTS XVIII
CHAPITRE 1 19
INTRODUCTION GÉNÉRALE 19
1.1. IMPORTANCE DE L'ÉPINETTE NOIRE POUR LA FORÊT BORÉALE
CANADIENNE 19
1.2. UNE TECHNIQUE SYLVICOLE ÉPROUVÉE POUR RÉPONDRE AUX BESOINS
D'AUJOURD'HUI : L'ÉCLAIRCIE COMMERCIALE ? 20
1.3. OUVERTURE DU PEUPLEMENT ET RÔLE DES RACINES 22
1.4. DU GAIN DE CROISSANCE À LA QUALITÉ DU BOIS : VERS LA VALEUR
AJOUTÉE 23
1.5. L E TERRITOIRE ÉTUDIÉ 25
1.6. HYPOTHÈSES ET OBJECTIFS 26
1.7. RÉFÉRENCES 3 0
RADIAL GROWTH RESPONSE OF BLACK SPRUCE ROOTS AND STEMS TO
COMMERCIAL THINNING IN THE BOREAL FOREST 3 9
2.1. ABSTRACT 39 2.2. INTRODUCTION 40 2.3. METHODS 42 2.3.1. Study Area 42 2.3.2. Data 43 2.3.3. Dendrochronology 44 2.3.4. Radial Growth 44 2.3.5. Competition Index 45 2.3.6. Stastitical analyses 46 2.4. RESULTS 47
2.4.1. Stem Growth Response 47
2.4.2. Root Response 48
2.4.3. Comparison between stem and Root Radial Growth 49
2.5. DISCUSSION 50
2.5.1. Growth Response 50
2.5.2. Variables Influencing Response to Thinning 51
2.5.3. Roots and Stem Growth 52
2.6. CONCLUSIONS 54 2.7. ACKNOWLEDGEMENTS 54
CHAPITRE 3 72
YIELD OF BLACK SPRUCE STANDS FOLLOWING COMMERCIAL THINNING: A WAY TOWARDS FULFILLING NEW MANAGEMENT EXPECTATIONS 7 3
3.1. ABSTRACT 73
3.2. INTRODUCTION 74
3.3. MATERIAL AND METHODS 76
3.3.1. Study area 76
3.3.2. Sampling and volume calculation 77
3.3.3. Statistical analysis 79
3.4. RESULTS 79
3.4.1. Individual tree volume growth 80
3.4.2. Stand increment 81
3.5. DISCUSSION 82
3.5.1. Individual tree volume growth 82
3.5.2. Stand increment 83
3.5.3. Yield allocation and implications for forest ecosystem-based
management 85
3.6. CONCLUSION 86
3.7. ACKNOWLEDGMENTS 87
3.8. REFERENCES 88
HOW DOES COMMERCIAL THINNING INFLUENCE PROFILE SHAPE IN PiCEA MARIANA: A CASE-STUDY IN QUEBEC'S BOREAL FOREST 103
4.1. ABSTRACT 103
4.2. INTRODUCTION 104
4.3. MATERIAL AND METHODS 105
4.3.1. Study area 106
4.3.2. Sampling 107
4.3.3. Radial growth and relative height 108 4.3.4. Stem shape and taper calculation 108 4.3.5. Other parameters influencing taper and stem form 109 4.3.6. Statistical analysis 110
4.4. RESULTS I l l 4.4.1. Radial growth response along stem, taper and stem shape variation I l l 4.4.2. Parameters influencing taper and stem shape 112
4.5. DISCUSSION 112
4.6. CONCLUSION 116
4.7. ACKNOWLEDGMENTS 116
4.8. REFERENCES 118
VARIATION IN BLACK SPRUCE (PICEA MARIANA (MILL.) BSP) WOOD
QUALITY AFTER THINNING 133
5.1. ABSTRACT 133
5.2. INTRODUCTION 134
5.3. MATERIALS AND METHODS 136
5.3.1. Study area 136 5.3.2. Sampling 137 5.3.3. Sample analysis 138 5.3.4. Statistical analysis 138 5.4. RESULTS 139 5.4.1. Growth variation 139 5.4.2. Ring density variation 140 5.4.3. MOE variation with thinning. 141 5.4.4. Stem height influence on MOE and average RD 141
5.5. DISCUSSION 141
5.5.7. Variation in wood characteristics due to thinning. 142 5.5.2. Variation in wood characteristics with tree height 144
5.6. CONCLUSION 146
5.7. ACKNOWLEDGEMENTS 146
5.8. REFERENCES 148
DOES TIMING MAKE THE DIFFERENCE ON THE PROFITABILITY OF COMMERCIAL THINNING IN THE BOREAL FOREST? 163
6.1. ABSTRACT 163
6.2. INTRODUCTION 164
6.3. STUDY AREA 166
6.4. DATA 167
6.5. METHODS 167
6.5.1. Prediction of products recovery 167 6.5.2. Economic analysis 168 6.5.3. Influence of lumber price fluctuations 170 6.5.4. Retrospective analysis 170 6.5.5. Statistical analyses 171
6.6. RESULTS 171
6.6.1. Lumber products recovery 171 6.6.2. NPVprediction 172 6.6.3. Retrospective analysis 173 6.7. DISCUSSION 173 6.7.1. Products recovery 173 6.7.2. Thinning profitability 174 6.7.3. Limits analysis 174 6.8. CONCLUSION 176 6.9. ACKNOWLEDGMENTS 177
6.10. LITERATURE 178
CHAPITRE 7 191 CONCLUSION GÉNÉRALE 191 7.1. IMPLICATIONS SYLVICOLES 191 1.1.1. Éclaircie commercial et croissance des peuplements 191 1.1.2. Éclaircie commerciale et qualité du bois 192 1.1.3. Implication économique 193
7.2. CONTRIBUTION SCIENTIFIQUE ET ORIGINALITÉ DE L'ÉTUDE 194 7.3. PERSPECTIVES DE RECHERCHES 196
LISTE DES TABLEAUX
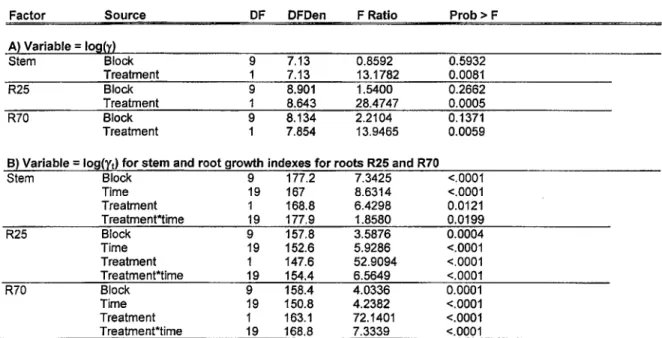
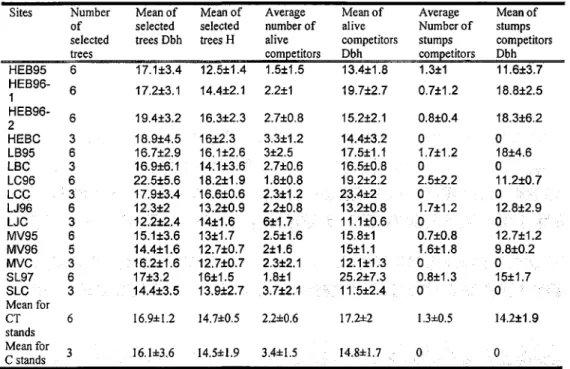
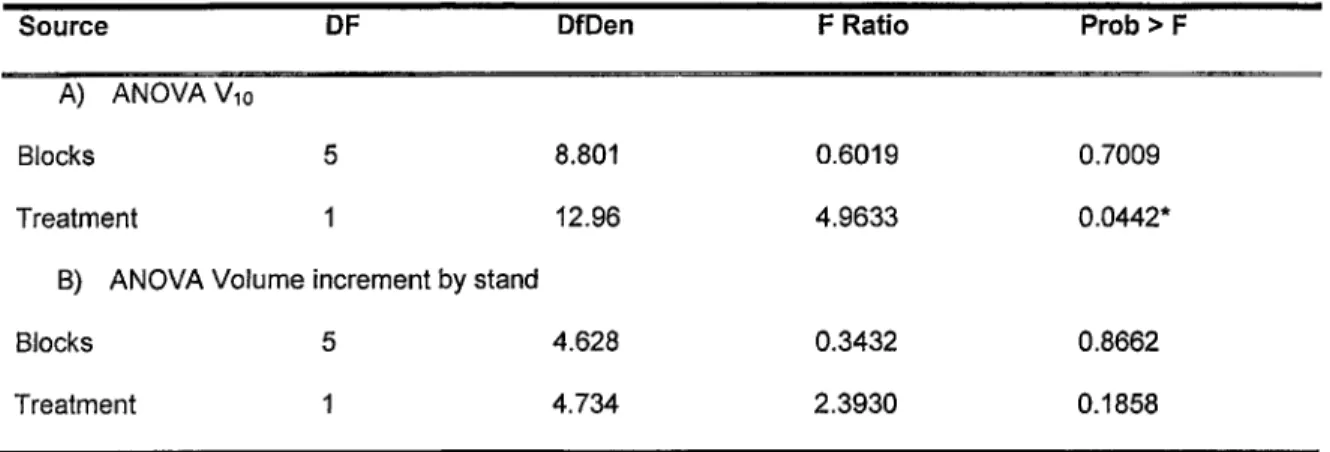
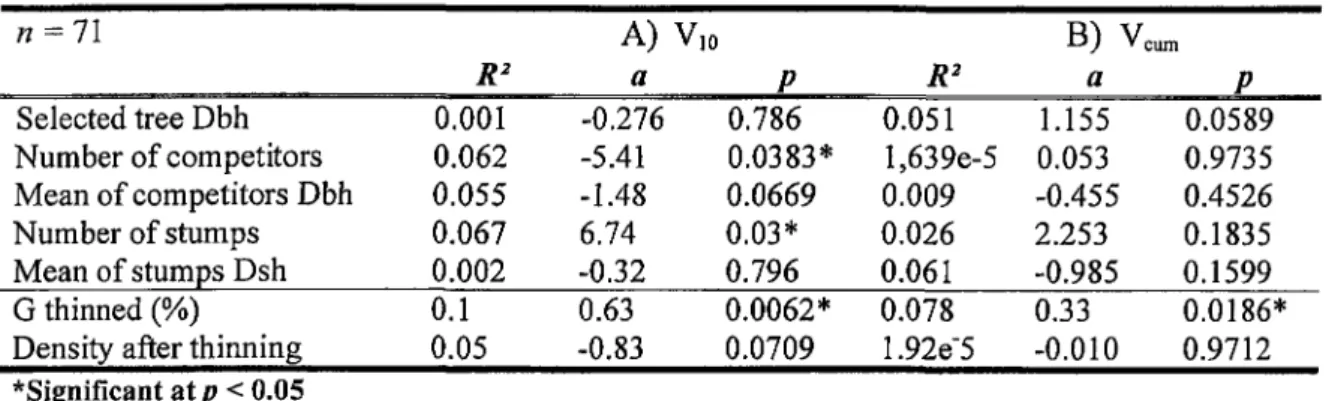
Table 2.1: Stand characteristics 64 Table 2.2 : Effects from the analysis of variance (ANOVA) for A) log(y), where y is the mean growth increment since thinning year for stems, roots 25 (R25) and roots 70 (R70), treatments (thinning and controls) are compared; and B) log(yt), where yt is the annual growth increment, temporal analysis is presented. Data are transformed in logarithmic value when necessary 65 Table 2.3: Regression coefficients for independent variables: diameter at breast high (dbh), Competition Index at Thinning Year (CITY), Stump Competition Index (CIS), tree height (height) and crown length. Data are transformed in logarithmic value when necessary 66 Table 2.4: A) Stepwise regression for the model of log(y), B) Whole model of the multivariate regression resulting from the stepwise analysis and C) Independent variables. Data are transformed into logarithmic values when necessary 67 Table 3.1: Stands characteristics 94 Table 3.2: Stands volume (V) and average volume per stem (AVS) at thinning year (TY) and 10 years after treatment (f) 95 Table 3.3: Selected trees characteristics and environment 96 Table 3.4: Effects from A) analysis of variance (ANOVA) for Vjo and B) the analysis of variance (ANOVA) for volume increment by stand 97 Table 3.5: R2, p and correlation coefficients (a) between A) Vio (decennial volume increment, %) and selected trees characteristics and competitors (alive and stumps) characteristics; and B) individual tree volume growth (Vcum) and selected trees
characteristics and competitors (alive and stumps) characteristics 98 Table 4.1: Stands characteristics 124 Table 4.2: Effects from the analysis of variance (ANOVA) for log(y), where y is the radial growth increment (y = mean growth before/mean growth after). Hr is relative height. Blocks and sites are random factors, sites are nested within blocks and trees are nested within sites 125
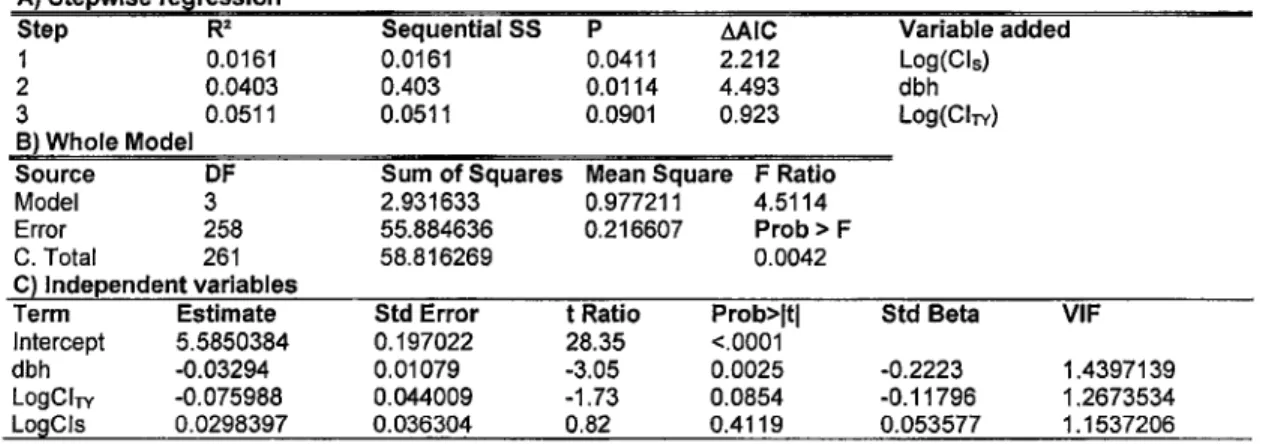
Table 4.3: Effects from the analysis of variance (ANOVA) for A) log(ASEC) and B) log(Taper). Blocks and sites are random factors, sites are nested within blocks and trees (#) are nested within sites 126 Table 4.4: Stepwise regression, whole model of multivariate regression resulting from the stepwise analysis, and independent variables for A) ASEC and B) Taper. Ch = Crown height, h = total height, Dbh = diameter at breast height and Td = Thinning density.... 127 Table 5.1: Stand Characteristics 154 Table 5.2: Ring characteristics and MOE variation by stand 155 Table 5.3: ANOVA for treatment and temporal effects on a) ring width (RW), b) early-wood width (EWW), c) lateearly-wood width (LWW), d) ring density (RD), e) average ring density (average RD) and f) modulus of elasticity (MOE) 156 Table 5.4: Effect from analysis of variance (ANOVA) for a) average ring density (Average RD) and b) modulus of elasticity (MOE) before and after thinning: analysis with tree height 157 Table 6.1: Stands characteristics 182 Table 6.2: Stands characteristics and parameters, used to calculate commercial thinning (CT) and final harvest (FINAL) costs and incomes 183 Table 6.3 : Mean of historical prices from 1981 to 2009 for commercial thinning (CT) and final harvest (FINAL) costs (CCT, CFINAL), stumpage fees, transformation costs, incomes (ICT, IFINAL) and Net Present Value (NPV) in SCAN2009, CT data are discounted to fit in NPV calculation. Costs and Incomes are given by hectare for each stand 184 Table 6.4 : A) Stepwise regression for the model of VANCT, B) whole model of the multivariate regression resulting from the stepwise analysis and C) independent variables. 185 Table 6.5: A) Stepwise regression for the model of VANc, B) whole model of the multivariate regression resulting from the stepwise analysis and C) independent variables. 186 Table 6.6 : Percentiles of prices combinations observed during the last 30 years for a 10-year lag period between CT and final harvest (FINAL). Grey case correspond to "winning conditions" as defined it the text (NPVCT > NPVC) 187
LISTE DES FIGURES
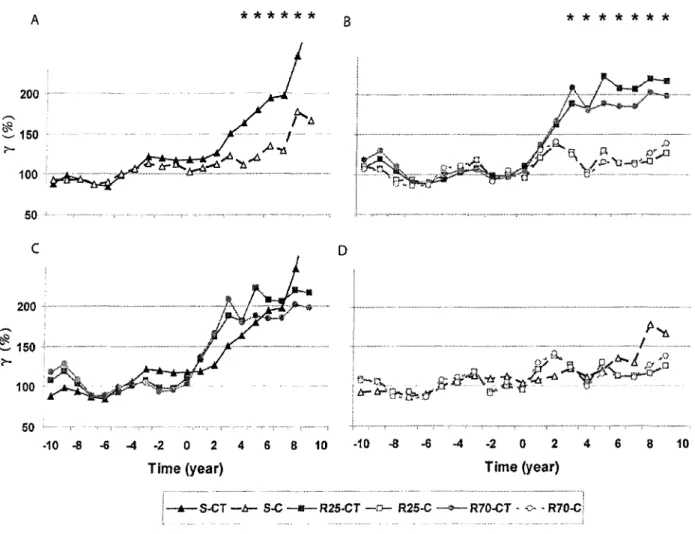
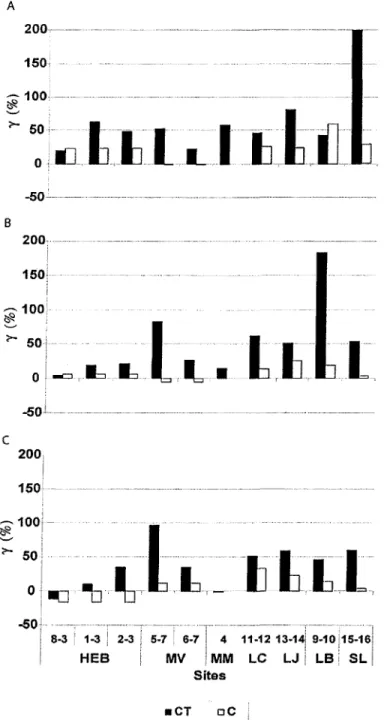
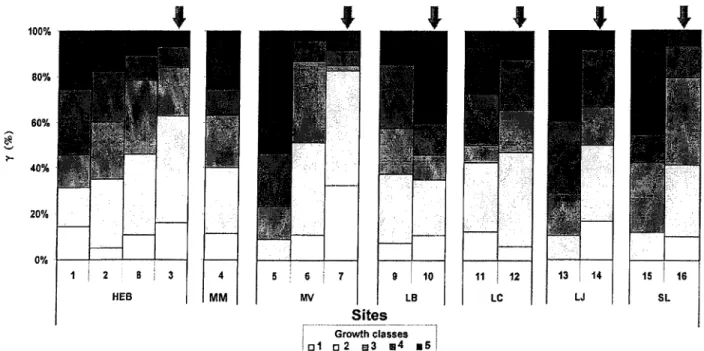
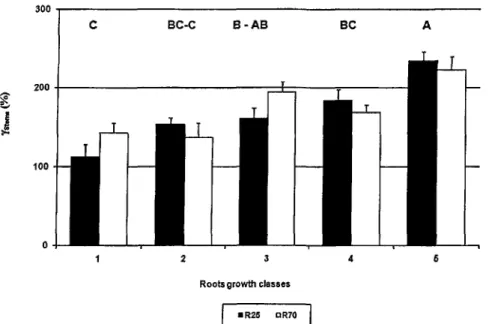
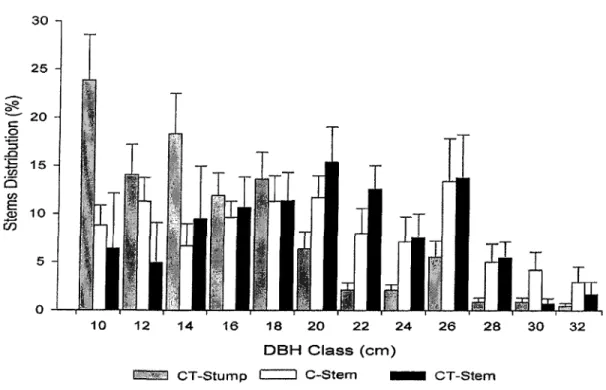
Figure 2.1: Radial growth increments (y) over time of stems (S), built with all thinned stands and compared with controls. B) Radial growth increments of roots R25 and R70 over time, built with all thinned stands and compared with controls. C) Root and stem growth increment pattern over time for thinned stands. D) Root and stem growth increment pattern over time for control stands. Time 0 = year of thinning, negative numbers correspond to years before treatment and positive ones to years after thinning. Asterisks mean significant treatment*time interactions. C = Control stands and CT = Commercial thinning 68 Figure 2.2: A) Stem growth increment (y) by thinning (CT) stands (black); comparison with control (C) stands (white). B) Roots R25 growth increment by thinning stands; comparison with control stands. C) Roots R70 growth increment by thinning stands; comparison with control stands. For each graph, stand (first number) is grouped with its control (second number) by location 69 Figure 2.3: Percentage of trees within stands as a function of their growth increment (y) after thinning year for thinned stands (left part on each graph) and control stands (last part of each graph, arrows). Different colours correspond to the five growth response classes described in the methods 70 Figure 2.4: Relation between stem growth increment (y) after thinning and root growth classes after thinning for all thinned stands (levels not connected by same letter are significantly different) 71 Figure 3.1: Stem distribution (%) following Dbh class (cm). Stems from control (white) and thinned (black) stands are represented as well as stumps from thinned (grey) stands 99 Figure 3.2: Decennial volume increment, VI0 (%), by block. Comparison between thinned (black) and control (white) stands 100 Figure 3.3: Stand volume increment (%), by block. Comparison between thinned (black) and control (white) stands 101 Figure 4.1: Map showing the locations of study stands around the St-Jean Lake, Quebec, Canada. Black squares = thinned stands, white squares = control stands 128
Figure 4.2: Mean of relative radial growth (a) ten years before (solid line) and ten years after (dash line) the treatment along the bole for thinned (black) and control (grey) stands. Data have been transformed into relative values so are thus without unit. A) a for thinned stands before and after treatment; B) a for control stands before and after treatment; C) a before treatment, comparison between thinned and control stands; D) a after treatment comparison between thinned and control stands 129 Figure 4.3: Radial growth increment (y) along relative height (hr) for thinned (dash line) and control (solid line) trees. Stars mean significant treatment*hr interactions. C = Control and CT = Commercial thinning 130 Figure 4.4: Relative diameter (Drel) along relative height (hr) for 4 five-year periods around thinning year. Arrows indicate start of each five-year period: 10 years before thinning year, 5 years before thinning year, 5 years after thinning year and 10 years after thinning year. C = Control (dashed grey line) and CT = Commercial Thinning (blac line) 131 Figure 5.1: Change before and after thinning year (time = 0) in A) ring width (RW, mm) B) early-wood width (EWW, mm) and C) latewood width (LWW, mm) for both thinned (CT, black circle) and control (C, white triangle) stands 158 Figure 5.2: Change before and after thinning year (time = 0) in A) ring density (RD, kg/m3) and B) average ring density (Average RD, kg/m3) for both thinned (CT, black
circle) and control (C, white triangle) stands 159 Figure 5.3: Variation in modulus of elasticity (MOE, GPa) for both thinned (CT, black circle) and control (C, white triangle) stands 160 Figure 5.4: Change along the first four metres of stem in A) average ring density (Average RD) for thinned stands, B) Average RD for control stands, C) modulus of elasticity (MOE) for thinned stands and D) MOE for control stands, before (black square) and after (white square) thinning year 161 Figure 6.1: Individual stem value according to their Dbh classes for the five percentiles of prices (PP). A) When final harvested, B) when thinned. Thinned values were discounted. 188 Figure 6.2: PRIBEC series ($CAN2009) from 1981 to 2009 embraced with percentile of prices. The five horizontal lines correspond to the five selected percentile from 10th
(bottom solid line) to the 90th (upper dash line) and including 25th, 50th and 75th percentile of prices 189 Figure 6.3 : Net Present Value (NPV, left-hand side) estimated for CT (NPVCT solid line)
REMERCIEMENTS Simon, j'espère que tu pourras bientôt prendre ta retraite ;-)
Un grand merci à Cornelia Krause, sans qui je n'aurais pu réaliser cette thèse. Merci de m'avoir fait confiance, et de m'avoir soutenue durant ces 5 années.
Ce travail est le fruit de plusieurs collaborations, Tony Zhang, Ahmed Koubaa, Hubert Morin et Jean-Martin Lussier ont chacun, grandement contribué aux différents chapitres constituant ce document. Je vous en suis très reconnaissante.
Merci encore aux professionnels et aux étudiants qui ont permis la réalisation de ce projet par leur travail sur le terrain ou au laboratoire d'écologie végétale.
Mais cette thèse est une histoire d'à-côtés et de rencontres qui m'ont apporté autant si ce n'est plus que les journées passées devant l'ordinateur. Andres, Cleo qui étiez là lorsque je suis arrivée, merci d'être encore là aujourd'hui. Merci JF pour ta générosité et tes conseils. Merci Pierre-Luc, Pascal, Boris, pour toutes les aventures. Merci Julie aussi, pour ton énergie et pour m'avoir montré comment voir les choses différemment.
Merci Marie-Eve, Pascale, Véro, et tous les autres qui vous cachez derrière ce travail.
CHAPITRE 1
INTRODUCTION GÉNÉRALE
1.1. IMPORTANCE DE L'ÉPINETTE NOIRE POUR LA FORÊT BORÉALE CANADIENNE
Les forêts boréales couvrent 14.5 pour cent du territoire terrestre (Melillo et al, 1993), formant du nord au sud, une ceinture continue de 1000 km de largeur. Elles s'étendent en Amérique du Nord, en Europe et en Asie (Encyclopédie Canadienne, 2009). Élément de la biodiversité mondiale, l'épinette noire (Picea mariana (Mill.) BSP), domine largement la forêt boréale de l'est du continent Nord-Américain (Gagnon et Morin, 2001). Présente uniquement en Amérique du Nord (Gagnon, 1988; Viereck et al, 1990), elle est de par son abondance et ses propriétés, une essence très importante économiquement. La qualité des ses fibres en fait une espèce très appréciée autant dans la fabrication du papier que dans celle du bois d'œuvre (Gagnon et Morin, 2001; Zhang et Koubaa, 2008).
Pourtant, ces dernières années, les attentes societal es envers l'aménagement sylvicole en forêt boréale ont évolué. Les forestiers doivent désormais relever autant de défis que la protection de la diversité et de la qualité environnementale, l'intégration du style de vie des premières nations, le maintien des activités récréotouristiques et la production de matériel renouvelable (Côté et Bouthillier, 1999). Ainsi, la réduction de la disponibilité en bois de sciage recommandée en 2004 par la Commission Coulombe (Coulombe et al, 2004), associée à l'augmentation de la compétition mondiale au sein de l'industrie forestière, implique la mise en place de nouvelles stratégies sylvicoles pour augmenter le volume de bois produit sur un territoire limité, tout en permettant l'atteinte
des objectifs sociétaux à grande échelle. Contrairement aux traitements sylvicoles associés à la régénération des peuplements tels que la coupe à blanc ou les coupes progressives, l'éclaircie commerciale est généralement considérée comme un moyen d'éduquer les peuplements au même titre que l'élagage ou le débroussaillage (Doucet et al, 2009). Cependant, les coupes partielles, dont font partie les éclaircies, apparaissent selon certains auteurs comme un choix judicieux pour atteindre les contraintes de développement et de mondialisation du marché tout en conservant une bonne qualité de production (Zhang et al, 2006; Thorpe et Thomas, 2007; Thorpe et al, 2007).
1.2. UNE TECHNIQUE SYLVICOLE ÉPROUVÉE POUR RÉPONDRE AUX BESOINS D'AUJOURD'HUI : L'ÉCLAIRCIE COMMERCIALE ?
L'éclaircie commerciale est en vigueur depuis plusieurs décennies dans les forêts mélangées et feuillues du sud du Québec, aux États-Unis et en Europe (Worthington et Staebler, 1961 ; Bella et De Franceschi, 1974). Plus récemment, et de façon moins documentée, les compagnies forestières ont réalisé des traitements d'éclaircie commerciale dans les peuplements naturels d'épinettes noires en forêt boréale. L'intervention consiste en une coupe partielle effectuée dans un peuplement qui n'est pas arrivé à maturité afin de stimuler la croissance des tiges résiduelles tout en récoltant une certaine quantité de bois (Doucet et al. 2009). Théoriquement, il existe différentes manières de réaliser une éclaircie (Doucet et al. 2009), soit :
— l'éclaircie par le bas : on enlève les tiges dans l'étage dominé afin de favoriser celles de l'étage dominant;
— l'éclaircie par le haut : on élimine les dominants les moins prometteurs afin de stimuler la croissance des autres tiges de ce même étage;
— l'éclaircie jardinatoire : on enlève les tiges dominantes pour favoriser celles des étages codominants et intermédiaires;
— l'éclaircie libre : on intervient dans plusieurs étages à la fois;
— l'éclaircie systématique : on laisse un espacement constant entre les tiges résiduelles.
La pratique d'éclaircie commerciale est préconisée dans les peuplements moyennement âgés pour augmenter la disponibilité en bois de sciage, réduire la période de révolution des peuplements (Curtis et Marshall, 2002) et leurs coûts d'aménagement (Cameron, 2002). Cependant, les objectifs varient suivant le type de peuplement (plantation ou naturel) dans lequel elle est réalisée (Gouvernement du Québec, 2003). En effet, par le choix d'un scénario d'éclaircies, le sylviculteur peut façonner en grande partie l'évolution du peuplement et atteindre les objectifs de production prédéterminés (Thiffault et al, 2003). Les effets de l'éclaircie commerciale ont ainsi été étudiés sur différents peuplements de pin gris {Pinus banksiana Lamb., Bella et De Franceschi, 1974 ; Schneider et al, 2008), de pin sylvestre (Pinus sylvestris L., Mâkinen et Isomaki, 2004b ; Mâkinen et al, 2005) ou d'épinette de Norvège (Picea abies (L.) Karst, Jaakola et al, 2005). Les auteurs s'accordent généralement sur le fait que l'éclaircie régularise l'accroissement et la croissance d'une forêt (Prégent, 1998 ; Petrâs, 2002). Plus particulièrement, les éclaircies par le bas peuvent favoriser la sélection des meilleurs phénotypes et accélérer le temps de récolte en haussant l'âge auquel l'accroissement annuel moyen culmine (O'Neil, 1998 ; Cameron, 2002). L'effet réel sur le gain en volume reste cependant controversé. Alors que Stinson (1999) observe un accroissement du volume total de la récolte dans les peuplements de sapin Douglas {Pseudotsuga
menziessii (Mirb.) Franco) 50 ans après le traitement, Mâkinen et Isomâki (2004a), qui travaillent sur des peuplements d'épinette de Norvège, 27 ans après le traitement, constatent que l'accroissement total du volume et le volume marchand produit par hectare sont plus importants chez les peuplements témoins. Lussier (2007), qui étudie des pessières noires 40 ans après le traitement, pourrait «réconcilier» ces auteurs puisqu'il suggère qu'alors qu'une éclaircie commerciale modérée ne se justifie pas pour augmenter le volume marchand à courte échéance; à longue échéance une éclaircie de forte intensité pourrait apporter un gain en volume en raison de l'augmentation de la vigueur du peuplement.
1.3. OUVERTURE DU PEUPLEMENT ET RÔLE DES RACINES
Pourtant, l'ouverture du peuplement peut entraîner des conséquences néfastes sur la stabilité des arbres. Ainsi, l'éclaircie commerciale peut entraîner des dommages conséquents à la charge de la neige sur les branches ou encore rendre les peuplements plus susceptibles aux chablis (Cameron, 2002). D'après Cremer et al. (1982) ou Savill (1983), les dommages causés par la neige et la chute des arbres lors des tempêtes pourraient ainsi augmenter du fait de la plus faible stabilité des arbres lors de l'ouverture des milieux et entraîner une perte économique significative dans les peuplements éclaircis. Parce que la stabilité des individus dépend du développement adéquat du système racinaire (Fayle, 1975), certains auteurs ont étudié le développement des racines et son rôle sur la stabilité du peuplement après ouverture de la canopée (Stokes et al, 1995 ; Nicoll et Dunn, 2000 ; Ruel et al, 2003 ; Bergeron et al, 2009). Nicoll et Dunn (2000) ont démontré une croissance adaptée à la pression du vent favorisant la distribution de la croissance des racines proches de la base des tiges d'épinette de Sitka
(Picea sitchensis (Bong.) Carr.). D'autres études ont porté sur la compétition pour l'eau et les nutriments (Mitchell et al, 1993). Pourtant, alors que le système racinaire semble être un très bon indicateur sur la croissance de l'arbre et la qualité du bois (Bôhm, 1979 ; Bernier et al, 1995), peu d'études concernant le développement des racines en réaction à l'éclaircie ont jusqu'alors été réalisées (Mitchell, 2000 ; Valinger étal, 2000).
1.4. DU GAIN DE CROISSANCE À LA QUALITÉ DU BOIS : VERS LA VALEUR AJOUTÉE
La qualité est une notion subjective qui doit être précisée dans chaque contexte. Josza et Middleton (1997) définissent la qualité du bois en fonction des caractéristiques qui le valorisent dans le cadre d'une utilisation donnée. Les caractéristiques déterminant la qualité d'un bois peuvent être inhérentes à l'espèce ou dépendre des conditions de croissance.
Plusieurs auteurs ont démontré qu'une augmentation de croissance chez les conifères induisait généralement un rehaussement de la largeur du bois initial par rapport à celle du bois final et l'allongement du temps de transition entre le bois juvénile et le bois mature (Barbour et al, 1994; Zhang et al, 1996; Koga et Zhang, 2002). Les résineux répondraient donc à l'éclaircie en produisant du bois de densité plus faible (Carter et al, 1986; Barbour et al, 1992; Debell et al, 2004; Kang et al, 2004). Bien que l'évaluation du gain en volume demeure une priorité, le fait que l'accroissement radial induit par les traitements puisse entraîner une diminution des propriétés mécaniques du bois (Zhang et al, 1998) est un élément important à prendre en considération. De plus, Viens (2001), Pape (1999) ou encore Barbour et al (1992) ont démontré que les premières années suivant le traitement, la forme de la tige, notamment son défilement,
pouvait être modifiée. Cameron (2002) a observé que les arbres résiduels produisaient plus de bois de réaction, ce qui diminue la qualité de la fibre.
Enfin, le poids spécifique, considéré par certains auteurs comme le meilleur indice pratique de la qualité du bois (Shepard et Shottafer, 1990; Szymanski et Tauer, 1991) semble diminuer après le traitement. Or, les propriétés des produits forestiers dépendent fortement des caractéristiques du matériau bois. En particulier, la densité du bois joue un rôle important sur le rendement, la qualité et la valeur des matériaux composites et solides produits (Shi et al, 2007). Reliée aux autres propriétés du matériau, résistance mécanique, retrait, rendement en pâte à papier et propriété de cette pâte (Josza et Middleton, 1997); elle est couramment utilisée comme indicateur de la qualité du bois et les variations annuelles de la densité de cerne déterminent souvent, l'utilisation du bois à des fins spécifiques (Echols, 1972; Koubaa et al., 2002).
Un autre indicateur de qualité du bois est son module d'élasticité (MOE). L'épinette noire est ainsi l'une des principales essences utilisées pour la classification mécanique du bois ("Machine Stress Rated", MSR) qui dépend essentiellement du module d'élasticité (Tong et al., 2009).
Quelques études ont porté sur la relation entre le taux de croissance et la qualité du bois chez différentes essences commerciales mais les résultats sont contradictoires (Pneuvmaticos et al, 1979; Kellogg et Warren, 1984; Castéra et al, 1996; Koga et Zhang, 2002; Zhang et al, 2002). Chez le pin gris, comme chez le sapin baumier {Abies balsamea L.) Barbour et al. (1994) et Kang et al. (2004), ont observé une réduction de la densité du bois après une éclaircie commerciale. Bendtsen (1978), a trouvé que les effets de l'accélération de croissance sur les propriétés du bois étaient négligeables par rapport
à la différence entre le bois mature et le bois juvénile. Zobel et Van Buijetenen (1989) quant à eux, ont conclu que la relation négative entre le taux de croissance et la densité du bois était commune pour certaines espèces d'Abies, mais que cette généralisation présentait de nombreuses exceptions. Pourtant, la plupart de ces études ont été réalisées pour évaluer l'impact de la densité initiale de peuplement sur la valeur des produits transformés (Koga et Zhang, 2002; Zhang et al, 2002; Alteyrac et al, 2005) et peu d'entre elles discutent des variations des propriétés mécaniques du bois après une éclaircie commerciale dans les peuplements naturels d'épinettes noires.
Finalement, les propriétés mécaniques du bois varient aussi en fonction de la position dans l'arbre des échantillons testés (Larson, et al, 2004; Alteyrac et al, 2005). Le besoin est grand de développer une stratégie d'optimisation d'utilisation des billots en fonction de leur emplacement dans la tige pour maximiser la valeur de la ressource (Shi et al, 2007). Plusieurs auteurs mentionnent en effet un retard de la recherche sur l'effet des traitements sylvicoles sur la valeur des produits de deuxième transformation. Celle-ci trainant derrière la recherche sur la croissance et le rendement et créant une déconnexion au niveau de la chaine de valeur ajoutée, l'industrie forestière ne possédant pas les informations de base liant la croissance des arbres à la valeur des produits (Briggs et Fight, 1992; Kang étal, 2004).
1.5. L E TERRITOIRE ÉTUDIÉ
L'étude a été réalisée dans la région 02 du Saguenay-Lac-Saint-Jean. Au total 10 sites éclaircis entre 1995 et 1997 ont été échantillonnés. Tous ces sites à l'exception d'un seul (MM96) ont pu être associés à un site témoin présentant des caractéristiques d'âges, d'essences et de structures similaires. Bien qu'inclus dans les chapitres 2 et 4, le site
MM96 a été exclu des chapitres 3, 5 et 6 pour simplifier les analyses statistiques. Pour les sites localisés dans les Monts Valins (MV) et dans Hebertville (HB), un témoin a été sélectionné et associé à plusieurs sites éclaircis. Au total donc 17 sites ont été échantillonnés, 17 étudiés aux chapitres 2 et 4 et 16 pour les chapitres suivants. Tous les peuplements étudiés sont des peuplements naturels purs d'épinette noire, non éduqués. 1.6. HYPOTHÈSES ET OBJECTIFS
L'éclaircie commerciale étant à l'origine d'une ouverture de la canopée et d'un gain d'espace pour les arbres résiduels, l'hypothèse de recherche sous-jacente à ce projet est la suivante : L'éclaircie commerciale induira un gain de croissance des tiges résiduelles associé au développement particulier de celles-ci. Chez les résineux, une augmentation de croissance peut se traduire par une diminution de la proportion du bois final par rapport à celle du bois initial (Koga et Zhang, 2002). La qualité du bois, en termes de résistance mécanique et de densité, des arbres résiduels peut donc diminuer. Le principal objectif de cette thèse est donc de déterminer l'impact des éclaircies commerciales sur la croissance d'épinettes noires et les conséquences sur la qualité du bois produit après traitement d'éclaircie. À ce titre, l'intensité de l'éclaircie ne sera pas un facteur étudié dans la réponse au traitement. L'hypothèse posée pour appuyer ce choix est qu'après avoir intégré le circuit de deuxième transformation, aucune distinction n'est faite entre les types ou les intensités d'éclaircies réalisées dans le peuplement. L'effet du traitement à l'échelle du peuplement et de l'individu sera étudié. Un objectif plus spécifique est de déterminer quels sont les facteurs qui influencent l'intensité de la réaction des arbres au traitement. Si nos hypothèses sont confirmées, la valeur du peuplement résiduel pourrait augmenter après l'éclaircie par rapport à un peuplement non
traité (lors de l'éclaircie commerciale, les tiges de moins bonne qualité sont prélevées, de plus la qualité des tiges résiduelles augmente après l'éclaircie). Le dernier objectif de la thèse est d'évaluer la rentabilité d'une éclaircie commerciale et les facteurs affectant cette rentabilité par rapport à une unique coupe finale.
Suite à cette introduction, les chapitres 2, 3, 4, 5 et 6 présentent les résultats de la thèse en répondant chacun à des objectifs spécifiques. Ces chapitres sont présentés en anglais sous forme d'articles. Les chapitres 2 et 3 traitent de l'impact sur la croissance des arbres et de l'ensemble du peuplement.
Le chapitre 2 considère de plus la réaction des racines au traitement et les paramètres influençant la croissance de chaque individu. Certaines études ont démontré une variation de l'accroissement radial inter- et intra-site suite au traitement (Zarnovican et al, 2001 ; Skovsgaard, 2009). Nous posons l'hypothèse que, au sein d'un peuplement, les caractéristiques des tiges (diamètre, compétiteurs, hauteur) vont jouer un rôle dans l'accroissement relatif des arbres résiduels. L'objectif est alors de déterminer quels sont ces caractéristiques et de modéliser leur effet sur la variation de croissance observée après le traitement.
Le troisième chapitre se place dans un contexte d'aménagement sylvicole. Il présente les variations observées en termes de surface terrière et de volume de peuplement. Dans cette étude une première analyse de la structure du peuplement résiduel est réalisée. L'hypothèse testée est que l'accroissement radial observé peut se traduire par un gain en surface terrière et en volume. L'objectif est de quantifier ce gain de croissance.
Au chapitre 4 l'évolution de la forme de la tige et son défilement sont étudiés. L'hypothèse testée dans ce chapitre est que l'accroissement radial est localisé sur la tige entrainant une variation de la forme de la tige. L'influence de certaines caractéristiques des tiges sur ces paramètres est étudiée.
Le chapitre 5 concerne les propriétés physiques et mécaniques des tiges traitées. Le module d'élasticité et la densité sont les deux paramètres étudiés. L'hypothèse sous-jacente est que l'augmentation du taux de croissance observée après le traitement, se traduisant par des cernes plus larges, va entrainer une diminution de la densité du bois (Zhang et al, 1996). Cette diminution peut se refléter au niveau du module d'élasticité. L'analyse porte sur la variation avant et après le traitement et sur la variation entre tiges traitées et témoins.
Finalement, le chapitre 6 concerne les retombées économiques du traitement. L'éclaircie commerciale est souvent critiquée car les coûts de récolte associés au traitement dépassent les revenus liés au gain de croissance des arbres. Pour que l'éclaircie commerciale soit une opération profitable, il faut que le gain de valeur du peuplement résiduel soit supérieur au coût net de l'éclaircie. Par contre l'éclaircie permet d'améliorer la valeur finale du peuplement. Or la valeur sur pied des arbres varie en fonction de leur dhp et des fluctuations de prix. Nous avons posé l'hypothèse qu'en période de faible prix, seuls les arbres les plus gros avaient une valeur positive, les arbres les plus petits ayant une valeur négative. Dans ce cas, la présence de petits arbres réduit la valeur de la récolte totale. Si ces mêmes arbres sont prélevés par une éclaircie commerciale, la valeur de la récolte totale peut être accrue. Pour que ce soit financièrement intéressant, il faut que la récolte des petits bois par éclaircie se fasse pendant une période de prix élevés (pour
réduire les coûts de l'éclaircie) et que la récolte finale se fasse en période de prix faible. Il faut donc évaluer si cette combinaison de conditions se réalise et selon quelle probabilité.
1.7. RÉFÉRENCES
Alteyrac, J., Zhang, S.Y., Cloutier, A., Ruel, J.C., 2005. Influence of stand density on ring width and wood density at different sampling heights in black spruce {Picea mariana (Mill.) BSP). Wood Fiber Sci. 37, 83-94.
Barbour, R.J., Bailey, R.E., Cook, J.A., 1992. Evaluation of relative density, diameter growth, and stem form in a red spruce {Picea rubens) stand 15 years after precommercial thinning. Can. J. For. Res. 22, 229-238.
Barbour, R.J., Fayle, D.C.F., Chauret, G., Cook, J., Karsh, M.B., Ran, S.K., 1994. Breast-height relative density and radial growth in mature jack pine (Pinus banksiana) for 38 years after thinning. Can. J. For. Res. 24, 2439-2447.
Bella, I.E., De Franceschi, J.P., 1974. Commercial Thinning Improves Growth of Jack Pine. In: Information Report NOR-X-112. Canadian Forestry Service, Northern Forest research Center, Edmonton, Canada. 23 p.
Bendtsen, B.A., 1978. Properties of wood from improved and intensively managed trees. Forest Prod. J. 28, 61-72.
Bergeron, C , Ruel, J.C., Elie, J.G., Mitchell, S.J., 2009. Root anchorage and stem strength of black spruce {Picea mariana) trees in regular and irregular stands. Forestry 82, 29-41.
Bernier, P.Y., Lamhamedi, M.S., Simpson, D.G., 1995. ShootRoot Ratio is of Limited Use in Evaluating the Quality of Container Conifer Stock. Tree Planters' Notes 46,
102-106.
Briggs, D.G., Fight, R.D., 1992. Assessing the effects of silvicultural practices on product quality and value of coast douglas-fir trees. Forest Prod. J. 42, 40-46.
Cameron, A.D., 2002. Importance of early thinning in the development of long-term stand stability and improved log quality : a review. Forestry 75, 25-35.
Carter, R.E., Miller, I.M., Klinka, K., 1986. Relationships Between Growth Form and Stand Density in Immature Douglas-fir. Forest. Chron., 440-445.
Castéra, P., Faye, C , El Ouadrani, A., 1996. Prevision of the bending strength of timber with a multivariate statistical approach. Ann. For. Sci. 53, 885-898.
Côté, M.A., Bouthillier, L., 1999. Analysis of the relationship among stakeholders affected by sustainable forest management and forest certification. Forest. Chron. 75, 961-965.
Coulombe, G., Huot, J., Arsenault, J., Bauce, E., Bernard, J.-T., Bouchard, B., Liboiron, M.-A., Szaraz, G., 2004. Commission d'étude sur la gestion de la forêt publique québécquoise, Québec, Canada. 314 p.
Cremer, C.K., Borough, C.J., McKinnell, F.H., Carter, P.R., 1982. Effects of stocking and thinning on wind damage in plantations. New. Zeal. J. For. Sci. 12, 244-268.
Curtis, R.O. and Marshall, D.D., 2002. Levels of growing stock cooperative study in Douglas-fir: report no. 14 - Stampede Creek: 30-year results. USDA For. Serv. Pap. PNW-RP-543.77p.
Debell, D.S., Singleton, R., Gartner, B.L., Marshall, D.D., 2004. Wood density of young-growth western hemlock: relation to ring age, radial young-growth, stand density, and site quality. Can. J. For. Res. 34, 2433-2442.
Doucet, R., Ruel, J.-M., Jutras, S., Lessard, G., Pineau, M., Prégent, G., Thiffault, N., 2009. "Sylviculture appliquée". In: OIFQ (Ed.), Manuel de foresterie, 2eéd. Ouvrage
collectif, Éditions Multimondes, Québec, pp. 1147-1186.
Echols, R.M., 1972. Products suitability of wood determined by density gradients across growth rings. In: Research Note PSW-273. USD A Forest Service, Berkeley, CA. 6 p. Encyclopédie canadienne, 2009. "Forêt Boréale". Fondation Historica 2010. Novembre 2009. http://www.thecanadianencyclopedia.comForêt boréale.
Fayle, D.C.F., 1975. Distribution of Radial Growth During the Development of Red Pine Root Systems. Can. J. For. Res. 5, 608-625.
Gagnon, R., 1988. La dynamique naturelle des peuplements équiennes d'épinette noire. In : Colloque "Les mécanismes de régénération naturelle de l'épinette noire: applications pratiques en aménagement", Chicoutimi, Québec, Canada, pp. 1-11.
Gagnon, R., Morin, H., 2001. Les forêts d'épinettes noires du Québec: dynamique, perturbations et biodiversité. Le Naturaliste Canadien 125, 26-35.
Gouvernement du Québec. 2003. Manuel d'aménagement forestier. Ministère des Ressources naturelles, de la Faune et des Parcs, Québec. 245 p.
Jaakkola, T., Makinen, H., Saren, M.P., Saranpaa, P., 2005. Does thinning intensity affect the tracheid dimensions of Norway spruce? Can. J. For. Res. 35, 2685-2697.
Jozsa, L.A. and Middleton, G.R., 1997. Les caractéristiques déterminant la qualité du bois: nature et conséquences pratiques. In: Publication spéciale SP-34F. Forintek Canada corp. (Ed), Sainte-Foy, Québec, Canada. 42 p.
Kang, K.Y., Zhang, S.Y., Mansfield, S.D., 2004. The effects of initial spacing on wood density, fibre and pulp properties in jack pine (Pinus banksiana Lamb.). Holzforschung 58,455-463.
Kellogg, R.M., Warren, W.G., 1984. Evaluating Western Hemlock Stem Characteristics in Terms of Lumber Value. Wood Fiber Sci. 16, 583-597.
Koga, S., Zhang, S.Y., 2002. Relationships between wood density and annual growth rate components in balsam fir (Abies balsamea). Wood Fiber Sci. 34, 146-157.
Koubaa, A., Zhang, S.Y.T., Makni, S., 2002. Defining the transition from early wood to late wood in black spruce based on intra-ring wood density profiles from X-ray densitometry. Ann. For. Sci. 59, 511-518.
Larson, D., Mirth, R., Wolfe, R., 2004. Evaluation of small-diameter ponderosa pine logs in bending. Forest Prod. J. 54, 52-58.
Lussier, J.M., 2007. Regard sur l'éclaircie commerciale en pessière noire : 40 ans plus tard. L'éclaircie 31, 2p.
Mâkinen, H., Hynynen, J., Isomaki, A., 2005. Intensive management of Scots pine stands in southern Finland: First empirical results and simulated further development. For. Ecol. Manag. 215,37-50.
Mâkinen, H., Isomâki, A., 2004a. Thinning intensity and growth of Norway spruce stands in Finland. Forestry 77, 349-364.
Mâkinen, H., Isomâki, A., 2004 b. Thinning intensity and growth of Scots pine stands in Finland. For. Ecol. Manag. 201, 311-325.
Melillo, J.M., McGuire, A.D., Kicklighter, D.W., Moore, B., Vorosmarty, C.J., Schloss, A.L., 1993. Global Climate-Change and Terrestrial Net Primary Production. Nature 363, 234-240.
Mitchell, R.J., Zutter, B.R., Green, T.H., Perry, M.A., Gjerstad, D.H., Glover, G.R., 1993. Spatial and temporal variation in competitive effects on soil moisture and pine response. Ecol. Appl. 3,167-174.
Mitchell, S.J., 2000. Stem growth responses in Douglas-fir and Sitka spruce following thinning: implications for assessing wind-firmness. Forest Ecol. Mang. 135, 105-114. Nicoll, B., Dunn, A.J., 2000. The effect of wind speed and direction on radial growth of structural roots In: The supporting roots of trees and woody plants: form, function and physiology. Stokes, A. (Ed.). Kluwer Academic Publishers, Dordrecht, Netherlands, pp. 219-225.
O'Neil, M., 1998. Tendances mondoales et incidences sur les pratiques forestières au Canada. Forest. Chron. 6, 834-838.
Pape, R., 1999. Effects of Thinning Regime on the Wood Properties and Stem Quality of Picea abies. Scand. J. For. Res. 14, 38-50.
Petrâs, R., 2002. Age and diameter classes or growth stages as criteria for the implementation of thinning. J. For. Sci. 48, 8-15.
Pnevmaticos, S.M., Corneau, Y., Kerr, R.C., 1979. Yield and productivity in processing treelength softwoods in Quebec. Can. Forest Ind. 99, 37-&.
Prégent, G., 1998. L'éclaircie des plantations In: Mémoire de recherche forestière no 133. Gouvernement du Québec, Ministère des Ressources Naturelles, Forêt Québec (Ed). Direction de la recherche forestière, Sainte-Foy, Québec, Canada. 38 p.
Ruel, J.-C, Larouche, C , Achim, A., 2003. Changes in root morphology after precommercial thinning in balsam fir stands. Can. J. For. Res. 33, 2452-2459.
Savill, P.S., 1983. Silviculture in windy climates. For. Abstr. 44, 473-488.
Schneider, R., Zhang, S.Y., Swift, D.E., Begin, J., Lussier, J.M., 2008. Predicting selected wood properties of jack pine following commercial thinning. Can. J. For. Res. 38, 2030-2043.
Shepard, R.K., Shottafer, J.E., 1990. Effect of early release on specific gravity and wood yield of black spruce. Forest Prod. J. 40, 18-20.
Shi, J.L., Riedl, B., Deng, J., Cloutier, A., Zhang, S.Y., 2007. Impact of log position in the tree on mechanical and physical properties of black spruce medium-density fibreboard panels. Can. J. For. Res. 37, 866-873.
Skovsgaard, J.P., 2009. Analysing effects of thinning on stand volume growth in relation to site conditions: A case study for even-aged Sitka spruce (Picea sitchensis (Bong.) Carr.). Forestry 82, 87-104.
Stinson, S.D., 1999. 50 years of low thinning in second growth Douglas-fir. Forest. Chron. 75,401-405.
Stokes, A., Fitter, A.H., Coutts, M.P., 1995. Responses of young trees to wind and shading: effects on root architecture. J. Exp. Bot. 46, 1139-1146.
Szymanski, M.B., Tauer, C.G., 1991. Loblolly pine provenance variation in age of transition from juvenile to mature wood specific gravity. In, Forest Sci., pp. 160-174. Thiffault, N., Roy, V., Prégent, G., Cyr, G., Jobidon, R., Ménétrier, J., 2003. La sylviculture des plantations résineuses au Québec. Nat. Can. 127, 63-80.
Thorpe, H.C., Thomas, S.C., 2007. Partial harvesting in the Canadian boreal: Success will depend on stand dynamic responses. Forest. Chron. 83, 319-325.
Thorpe, H.C., Thomas, S.C., Caspersen, J.P., 2007. Residual-tree growth responses to partial stand harvest in the black spruce (Picea mariana) boreal forest. Can. J. For. Res. 37, 1563-1571.
Tong, Q.J., Fleming, R.L., Tanguay, F., Zhang, S.Y., 2009. Wood and lumber properties from unthinned and precommercially thinned black spruce plantations. Wood Fiber Sci. 41, 168-179.
Valinger, E., Elfving, B., Môrling, T., 2000. Twelve-year growth response of Scots pine to thinning and nitrogen fertilisation. Forest. Ecol. Manag. 134,45-53.
Viens, É., 2001. Effets de l'éclaircie commerciale sur la croissance et la forme de la tige du pin gris (Pinus banksiana Lamb.) en Abitibi, Québec. In: Université du Québec à Chicoutimi, Mémoire de maîtrise, Chicoutimi, Québec, Canada. 63 p.
Viereck, L.A., Johnston, F.B., R. M., Honkala, B., 1990. Picea mariana (Mill.) B.S.P. Black spruce. In: Agriculture Handbook 654, Silvics of North America Vol. 1. USDA Forest Service, Washington DC, pp. 227-237.
Worthington, N.P., Staebler, G.R., 1961. Commercial thinning of Douglas-fir in the Pacific Northwest. In: Technical Bulletin No 1230. USDA Forest Service, Pacific Northwest Forest and range Experiment Station, Washington, US. 119p.
Zarnovican, R,, Lussier, J.M., Laberge, C , 2001. Coupe préparatoire et croissance en surface terrière d'une sapinière de seconde venue à la forêt modèle du Bas-Saint-Laurent, Québec. Forest. Chron. 77, 685-695.
Zhang, S. Y., Chauret, G., Ren, H.Q.Q., Desjardins, R., 2002. Impact of initial spacing on plantation black spruce lumber grade yield, bending properties, and MSR yield. Wood Fiber Sci. 34,460-475.
Zhang, S.Y., Chauret, G., Swift, E., Duchesne, I., 2006. Effects of precommercial thinning on tree growth and lumber quality in a jack pine stand in New Brunswick, Canada. Can. J. For. Res. 36, 945-952.
Zhang, S.Y., Corneau, Y., Chauret, G., 1998. Impact of precommercial thinning on product quality and value in balsam fir. In: Forintek Canada Corp. Project No 1108, Canadian Forest service No. 39, Forintek, Quebec, Canada. 74 p.
Zhang, S.Y., Koubaa, A., 2008. Softwoods of Eastern Canada: their silvics, characteristics, manufacturing and end-uses. Special publication SP-526E. FPInnovations-Forintek division, Québec, Canada.
Zhang, S.Y., Simpson, D., Morgenstern, E.K., 1996. Variation in the relationship of wood density with growth in 40 black spruce (Picea mariana) families grown in New Brunswick. Wood Fiber Sci. 28, 91-99.
Zobel, B., Van Buijtenen, J., 1989. Wood variation; its causes and control. Springer-Verlag Berlin Heidelberg, Berlin-Heidelberg-New York.
RADIAL GROWTH RESPONSE OF BLACK SPRUCE ROOTS AND STEMS TO COMMERCIAL THINNING IN THE BOREAL FOREST
Manon VINCENT*, Cornelia KRAUSE, S.Y. ZHANG
Département des sciences fondamentales, Université du Québec à Chicoutimi, 555 boul.
de l'Université, Chicoutimi (Québec), CANADA, G7H2B1.
(Article publié dans Forestry : Vincent, M., Krause, C , Zhang, S., 2009. Radial growth response of black spruce roots and stems to commercial thinning in Boreal
forest. Forestry 82, 557-571)
Keywords: Commercial thinning, black spruce, roots, stem, radial growth response, competition
CHAPITRE 2
RADIAL GROWTH RESPONSE OF BLACK SPRUCE ROOTS AND STEMS TO COMMERCIAL THINNING IN THE BOREAL FOREST
2.1. ABSTRACT
Black spruce is one of the most important boreal tree species in Canada. In the current ecosystem-based management context, commercial thinning (CT) could be a sound choice for attaining sustainable forest management while still achieving maximum returns on competitive timber markets. Through stand density regulation, CT aims to increase tree growth and enhance stand productivity, but the pattern and level of treatment responses are still unknown. This study examined the radial growth response of roots and stems to commercial thinning in 10 thinned stands and their controls. A split-plot unbalanced model was developed to describe growth variations over time. The study shows that CT leads to an increase in the radial growth of stems and roots for at least 10 years following the treatment. The 10-year post-treatment radial growth increment of stems is from 20 to 100 per cent higher than the pre-treatment 10-year mean growth. Response depends upon tree diameter and competition, with the biggest trees exhibiting the lowest response to the treatment. Nevertheless, these variables only explain a fraction of the response (R2 = 0.0511), suggesting that much of the observed variation may be due to variability between the stands and between trees within a stand. Moreover, stem growth response is correlated with, but lags behind root growth response. This study suggests that CT results may be enhanced by the selection of retained trees based on initial diameter at breast height.
2.2. INTRODUCTION
The Boreal forest biome covers much of the landmass of the northern hemisphere and stores most of the global carbon stock (Melillo et al, 1993; Dixon, et al, 1994). Society's expectations of forest management in the boreal forest have evolved in recent years. Foresters now face challenges such as protecting biodiversity and environmental quality, integrating First-Nation traditional lifestyles, maintaining recreational activities and procuring renewable material. This called for strategies to optimize timber growth without removing the entire canopy (Côté and Bouthillier, 1999). Silvicultural practices such as thinning could be a sound choice for attaining sustainable development within global market constraints while still achieving maximum value (Zhang et al, 2006).
Black spruce {Picea mariana (Mill.) BSP) is one of the most important boreal tree species in Canada (Parent and Fortin, 2008; Zhang and Koubaa, 2008). Its abundance and properties make it a valuable resource for the timber industry. The impacts of silvicultural treatments such as commercial or pre-commercial thinning (CT) have already been studied for different eastern species, including jack pine (Pinus banksiana Lamb., Bella and De Franceschi, 1974; Schneider et al. 2008), Norway spruce {Picea abies (L.) Karst.) and Scots pine {Pinus sylvestris L., Mâkinen and Isomaki, 2004a, b), but the effects of CT still have to be studied in natural black spruce stands.
Theoretically, CT aims to regularise the size and growth of a forest to maintain its productivity throughout its life cycle (Prégent, 1998; Petrâs, 2002). The main advantages of thinning are to increase saw timber availability, decrease rotation age and management costs, while enhancing stand value and quality (Cameron, 2002). However, results differ depending on authors and studied species. Bella and De Francheschi (1974) on jack pine
and Curtis and Marshall (2002) or Stinson (1999) on Douglas fir {Pseudotsuga menziessii) noticed an increase in relative stem volume after treatment. Instead, Mâkinen and Isomaki (2004a, b) observed no significant differences between stem volume increments in Norway spruce and Scots pine stands at different thinning intensities, including no thinning. Thinning influences not only tree growth, but also stem shape, tapering (Barbour et al, 1992; Viens, 2001; Koga et al, 2002) and wood properties (Petrâs, 2002; Raulier et al, 2003; Zhang et al, 2006). Tasissa's team (Tasissa et al, 1997; Tasissa and Burkhart, 1998), working reforested on a loblolly pine (Pinus taeda L.) cutover, observed a significant impact on stem characteristics after a second thinning. However, Viens (2001) studying jack pine, as well as Bouillet and Lefevre (1996) working on khasi pine {Pinus kesiya Royle ex Gordon), concluded that thinning did not induce worsening of shape along stems. The disparity observed between stands (Zarnovican et al, 2001) and within stands (Skovsgaard, 2009) may therefore be worth considering.
The risk of uprooting by strong winds is particularly high during clearing of the surroundings (Cremer et al, 1982) and may be responsible for significant economic losses in thinned stands. Because the stability of individual trees depends upon the adequate development of root systems (Fayle, 1975), some authors studied root development and its role on stand stability after opening up the canopy (Stokes et al, 1995; Nicoll and Dunn, 2000; Ruel et al, 2003; Bergeron et al, 2009). Nicoll and Dunn (2000) demonstrated adaptive growth to wind loading favouring the allocation of growth to roots near the base of Sitka spruce trees {Picea sitchensis (Bong.) Carr.). Other studies focused on root adaptation to competition for water and nutrients (Mitchell et al, 1993). But while the root system is supposed to be a very good indicator of tree growth and
wood quality (Bôhm, 1979; Bernier et al, 1995), its role in radial growth increment after commercial thinning has been less studied and little information is available on root growth response to thinning in black spruce stands.
In this study we investigate the 10-year pattern of stem and root increment in response to various thinning intensities in operationally thinned stands. Our first hypothesis was that trees showing an increase in radial diameter growth after treatment will also show increased root growth preceding the stem growth response as an adaptation to environmental changes after thinning. A second hypothesis contends that thinning response will vary depending on tree characteristics and their competitors. 2.3. METHODS
2.3.1. Study Area
This study was based on 10 commercially thinned stands and their control stands in the boreal forest of Quebec, Canada. Latitudes ranged from 47.9 °N to 49 °N, longitudes from 70.5 °W to 72.7 °W and altitudes from 210 to 671 m (Table 2.1). The region is characterized by cold winter temperatures and short vegetation periods. Over the past 30 years, the average minimum temperature for this region was -18.4 °C during the coldest month, and the average maximum was 17.9 °C during the warmest month. Average annual precipitations vary from 920 cm to 1187 cm in the studied stands (Environment Canada, 2000). Essentially pure, unmanaged natural black spruce stands were selected. The mean age of the stands at the time of treatment varied from 47.8 years to 99.1 years. Other than CT, no silvicultural treatment has been applied. Basal area density, evaluated by number and basal diameter of all trees within a 20 x 20 m quadrat, was between 800 and 3900 trees per hectare (Table 2.1). The herbaceous and moss layers
are mainly composed of Pleurozium schreberi (Brid.) Mitt., polytrichum sp., Ptilium crista-castrensis (Hedw.) De Not., Ledum groenlandicum Oeder, Vaccinium angustifoliwn Ait. and Kalmia angustifolia L.. As thinning is still a recent silviculrural treatment applied to boreal forests, no standard methods have yet been developed and no information is available about thinning types and techniques. Stand selection was thus based on two main criteria: (i) thinning was done 10-12 years before sampling in unmanaged natural stands; (ii) all stands had to have similar site characteristics and stand densities before thinning. Whenever possible, a nearby unthinned natural black spruce stand with similar characteristics was selected as a control. In two instances, the same control stand was used for comparison with more than one nearby thinned stand where all stands had the same environmental characteristics (Table 2.1).
Due to the large number of selected stands, the following nomenclature was adopted: the initial letters refer to stand location, followed by numbers representing the thinning year or the letter C for control stands. Stands were also numbered from 1 to 16 to simplify figure headings (Table 2.1).
2.3.2. Data
In order to specify the number of samples required, an a priori power analysis was conducted at each site to allow for estimating the variance of the population. It was determined that at least 35 trees per stand were required to cover stand variation and increase the statistical power of the analysis. Consequently, quadrats comprising at least 35 black spruces (Dbh > 9 cm) were selected. At one site, LJC, only 25 trees were selected because of environmental constraints (Table 2.1). The stand characteristics of each quadrat, such as vegetation composition, topography and depth to mineral soil or woody debris, were determined. Each tree in the quadrat was measured for height,
diameter at breast height (d.b.h.), at stump (diameter at stump height), and stem height at the lowest living branch (Table 2.1). Tree positions within the quadrat were recorded using a measuring tape and plotted onto a map. Stump circumferences and their positions within the quadrat were also determined.
An increment core was taken from each tree at 25 cm above the ground along the north-south axis and two other cores along one randomly chosen main horizontal root, at about 25 cm (R25) and 70 cm (R70) from the stump. Root increment cores were taken vertically from the upper side of the roots.
2.3.3. Dendrochronology
A dendrochronogical analysis was done on the stem and root increment samples of each tree. Preparation, measurements and sample analyses were conducted following standard dendroecology techniques (Stokes and Smiley, 1968; Krause and Morin, 1995). The cores were sanded using up to 400-grit paper, ring width was measured to 0.01 mm using a manual Henson micrometer, and semi-automatic Windendro™ width measuring machine (Guay et al, 1992). Tree-ring series were then cross-dated on a light table and verified statistically (COFECHA, Holmes, 1983). Ring series for each root were calculated and cross-dated with the corresponding stem curve and between different root cores. Root cross-dating was also verified using COFECHA, but visual dating was more often used than statistical dating, due to the short series length of the root samples. As a consequence of the core state, ~ 5 per cent of the cores per site were rejected for interdatation. Final index chronologies were developed for individual trees based on raw data, using ARSTAN (Cook and Holmes, 1986).
Radial growth in the thinned and control stands was evaluated based on average 10-year index values before treatment. Mean growth increments since the year of thinning were then calculated with the average of all years after treatment equation (1). An annual growth increment was also calculated for each year after treatment equation (2). t=l Ta, /lO t=TY-10 / 7t= ^ I x l 0° (2) t=TY-10
where y is the radial growth increment (per cent), TY is the thinning year, i is the sampling year (i = 2006 or 2007) and t = time (year); a is the growth index (dimensionless).
Five radial growth increment classes were determined: class 1 (y< 80 (per cent)), class 2 (80 < y< 120), class 3 (120 < y< 150), class 4 (150 < y< 200), and class 5 (y> 200). This classification was chosen arbitrarily since no classification standard was available in the literature and is used for stem and root growth increment in both thinned and control stands.
To determine the relative growth between stem and roots, the ratio of root growth to stem growth was calculated according to the following equations (3 and 4):
yR2S/S = XR25/yS , (3)
yR70/S = ÏR70 //S • ( 4 ) 2.3.5. Competition Index
Based on the work of Mailly et al. (2003), the competition index (CI) for each tree within a given quadrat was calculated using Hegyi's diameter-distance CI in equation (5):
(5)
where Di is the d.b.h. of subject tree /; D; is d.b.h. of the competitor tree j ; DISTtJ is the distance between subject tree /and competitor j . Studied trees belongs to R} the search radius (= 3.5 x mean crown radius of canopy trees, 4 m in our study).
Two different Hegyi's CI types were calculated: (1) the stump competition index (CIs) and (2) competition index at thinning year (CITY) of the remaining trees (alive trees). CIs characterizes the influence of tree harvesting on the growth of remaining trees, whereas CITY illustrates the competition among remaining trees after thinning. CITY was calculated using data collected during field work and then corrected after dendrochronology analysis to fit with the thinning year.
2.3.6. Statistical Analyses
Data were compiled using an analysis of variance (ANOVA) multifactor model with a Restricted Maximum Likelihood procedure (mixed model). A 10-block, unbalanced, split-plot design was used for radial growth increment and root growth increment with time as the main plot level, and with treatment (thinning/control) at the subplot level. ANOVAs were performed using JMP software (SAS Institute Inc., Cary, NC). Post-hoc one factor ANOVAs on data were used to extract the evolution of stem and root growth along the time-release treatment.
To determine the influence of independent variables on radial growth increment, simple regression tests were conducted between radial growth increment (y) and CIs,
CITY, d.b.h., tree height, and crown length. A multiple regression model was used to determine which variable has the most influence on y after thinning. In all cases, the confidence level was 95 per cent.
2.4. RESULTS
As shown in Table 2.1, the treated stands had a mean age of 62 years at thinning. For control stands, the mean age was 55 years. Based on the initial basal area, thinning intensity in the different stands varied from 17 to 62 per cent (Table 2.1) and can be classified as light to heavy thinning.
2.4.1. Stem Growth Response
Pre- and post-thinning comparison of the radial growth index of chronology values based on all stands together showed a significant increase in stem radial growth due to treatment (p = 0.0199 for interaction treatment x time, Figure 2.1 A, Table 2.2B). The radial growth index is similar in the control and thinned stands before treatment, but after the thinning, the radial growth index values increase immediately in the thinned stands (Figure 2.1 A).
By comparing the thinned stands with the control stands, most of the treated stands show significantly higher radial growth index values (p = 0.0081, Table 2.2A). The radial index values between the thinned and control stands vary from 20.4 to 170.5 per cent. However, two stands (HEB95, LB95) show post-thinning radial growth increments which are lower than their corresponding control stands (Figure 2.2A).
Response at the tree scale is heterogeneous within each stand (Figure 2.3A). For the thinned stands, the percentage of trees with positive growth response (classes 3,4 and 5 together) varies from 67.6 to 97.4 per cent, with a mean of 81.6 per cent. On the
contrary, these three classes represent less than 50 per cent of trees in the control stands. Two types of thinned stands can be defined (Figure 2.3) based on tree response. In six of these stands (1, 2, 8, 4, 6 and 11), ~ 60 per cent of the trees belonging to classes 3-5 showed growth responses, in the remaining three stands, ~ 90 per cent of trees had growth responses above 120 per cent. Stand LBC seems to be an exception for the control stands, with 41 per cent of trees showing class 5 growth increments after 1995.
Variability in tree growth response, apart from their own characteristics, could be explained by the influence of the number and characteristics of tree competitors on thinning efficiency. When all independent variables are computed separately, only CIs and d.b.h. have a significant effect on post-treatment stem growth increment. A negative correlation between d.b.h. and y was found, and a positive one between CIs and y (Table 2.3). Significant correlation was found between tree heights and crown lengths, but none between CITY and y. Yet, fitting CIs, d.b.h. and CITY using the stepwise forward procedure and the Akaike Information Criterion (AIC) as a selection criterion (Akaike, 1974; Mac Nally, 2000) resulted in a significant model (p = 0.0042, Table 2.4) explaining ~ 5 per cent of the y variance after thinning, d.b.h. was the most significant predictor (std P = -0.2223), indicating that trees with larger diameters have lower relative radial growth (Table 2.4).
2.4.2. Root Response
CT also has a positive effect on root growth (Figure 2.IB), with a significant increase over time due to treatment (p < 0.0001 for interaction treatmentxtime for both R25 and R70, Table 2.2B).
Comparing the thinned and control stands shows that thinning has a positive effect on root growth (Table 2.2A, p = 0.0005 and p = 0.0059 for Roots R25 and R70 respectively). Roots R25 show a 51.1 per cent mean increase in radial growth index values after treatment, varying from 4.4 to 183 per cent, depending on site (Figure 2.2B). The same trend can be observed for roots R70 (Figure 2.2B), with growth increments ranging from -11.3 to 59.3 per cent, and a mean of 37.7% for the thinned stands. In the control stands, radial growth index values for R25 and R70 after the thinning year vary from -4.5 to 26.1 per cent and from -16.3 to 33.4 per cent, respectively.
2.4.3. Comparison between Stem and Root Radial Growth
A significant relationship between stem and root growth after treatment was found, where increased root growth is associated with increased stem growth (Likelihood ratio and Pearson test both < 0.0001 for roots R25 and R70, data not shown). A Student's Mest shows that tree root growth classes are significantly linked with stem response (Figure 2.4, p < 0.0001).
Stem and root responses occur at different times after thinning. The effect of treatment appears first and stronger in the roots (Figure 2.1C). Four years after thinning a stabilization of root growth index is observed, whereas stem growth index values continue to increase (Figure 2.1C). A 1-year delay after treatment can be observed before stem growth starts to increase compared with roots (Figure 2.1 A and B). Indeed, after 1 year, yi is ~ 135.6 per cent for roots, which is an increase of 27 per cent compared with YTY- For stems, yi is equal to 113.79 per cent, a decrease of 0.3 per cent compared with YTY. A similar 27 per cent growth increase is observed for roots 2 years after thinning (y2