O
pen
A
rchive
T
OULOUSE
A
rchive
O
uverte (
OATAO
)
This is an author-deposited version published in :
http://oatao.univ-toulouse.fr/
Eprints ID : 19854
To link to this article : DOI:10.2147/CPT.S32050
URL :
http://dx.doi.org/10.2147/CPT.S32050
To cite this version : Assemat, Pauline
and Hourigan, Kerry
Evolution and rupture of vulnerable plaques: a review of mechanical
effects. (2013) ChronoPhysiology and Therapy, vol. 2013 (n° 3). pp.
23-40. ISSN 2230-2026
Any correspondence concerning this service should be sent to the repository
administrator:
[email protected]
OATAO is an open access repository that collects the work of Toulouse researchers and
makes it freely available over the web where possible.
ChronoPhysiology and Therapy
Evolution and rupture of vulnerable plaques:
a review of mechanical effects
Pauline Assemat Kerry Hourigan
Fluids Laboratory for Aeronautical and Industrial Research (FLAIR), Department of Mechanical and Aerospace Engineering and Division of Biological Engineering, Monash University, Melbourne, VIC, Australia
Correspondence: Pauline Assemat Fluids Laboratory for Aeronautical and Industrial Research (FLAIR), Department of Mechanical and Aerospace Engineering and Division of Biological Engineering, Faculty of Engineering, Office 105, Building 36, Monash University, Wellington Road, Clayton, Melbourne, VIC 3800, Australia
Tel +61 39 905 1791
Email [email protected]
Abstract: Atherosclerosis occurs as a result of the buildup and infiltration of lipid streaks in
artery walls, leading to plaques. Understanding the development of atherosclerosis and plaque vulnerability is of critical importance, since plaque rupture can result in heart attack or stroke. Plaques can be divided into two distinct types: those that rupture (vulnerable) and those that are less likely to rupture (stable). In the last few decades, researchers have been interested in studying the influence of the mechanical effects (blood shear stress, pressure forces, and structural stress) on the plaque formation and rupture processes. In the literature, physiological experimental studies are limited by the complexity of in vivo experiments to study such effects, whereas the numerical approach often uses simplified models compared with realistic conditions, so that no general agreement of the mechanisms responsible for plaque formation has yet been reached. In addition, in a large number of cases, the presence of plaques in arteries is asymptomatic. The prediction of plaque rupture remains a complex question to elucidate, not only because of the interaction of numerous phenomena involved in this process (biological, chemical, and mechanical) but also because of the large time scale on which plaques develop. The purpose of the present article is to review the current mechanical models used to describe the blood flow in arteries in the presence of plaques, as well as reviewing the literature treating the influence of mechanical effects on plaque formation, development, and rupture. Finally, some directions of research, including those being undertaken by the authors, are described.
Keywords: atherosclerosis, rupture prediction, wall shear stress, structural stress, vulnerable
plaques
Introduction
Atherosclerosis is an inflammatory disease characterized by lipid accumulation underneath the endothelium that lines the walls of blood vessels. In addition to lipid deposition, atherosclerotic progression involves monocyte infiltration, lipid oxidation,1
foam-cell formation, smooth-muscle cell migration and extracellular matrix production, to cite just a few processes.2,3 The lipid core is separated from the circulating blood by
a fibrous cap4 composed of smooth-muscle cells, neovascularization, and extracellular
matrix.2,5 As plaques develop, they can cause luminal constriction (stenotic shape),
or may undergo expansive remodeling (aneurysm-like shape) that maintains lumen diameter.6 The reason one type of remodeling occurs instead of the other remains a
question to be answered. Vulnerable plaques,7 prone to rupture or to erosion processes,
can undergo a disruption of the fibrous cap, thereby exposing the thrombogenic plaque core to the circulating blood.8 Interactions between platelets and the lipid core
can induce thrombus formation on the plaque surface, with possible consequences
Dovepress
R E V I E W
open access to scientific and medical research Open Access Full Text Article
ChronoPhysiology and Therapy downloaded from https://www.dovepress.com/ by 147.127.33.113 on 27-Apr-2018
For personal use only.
Number of times this article has been viewed
This article was published in the following Dove Press journal: ChronoPhysiology and Therapy
including vessel occlusion, myocardial infarction, or stroke. While it is widely accepted that plaque vulnerability is influ-enced by fibrous cap thickness and size of the lipid core,9
these criteria are not sufficient for the prediction of future rupture, as this process also depends on luminal remodeling and on the effects of mechanical stresses.10
The complexity of constructing a prediction model for plaque formation, development, and overall rupture arises from the interaction of numerous phenomena (biological, chemical, mechanical) involved in this process. A review of the main biological effects involved in vulnerable plaque formation, as well as the current strategies used to stabi-lize them, is presented in the recent position paper of the European Society of Cardiology.11
An approach adopted by numerous research teams to investigate this problem is to restrict their studies to the influence of the mechanical effects on plaque development, which still leads to a problem of some complexity. Indeed, the influence of hemodynamic parameters (fluid stresses, pressure forces) or of the structural stresses has been shown to provide a clue for the location of plaque development, and is starting to be used for determination of rupture mechanisms (these points will be developed in the following sections). However, the accurate calculation of such parameters is still challenging, and their relative contribution to plaque develop-ment continues to be debated. In addition, the literature on plaque progression is very rare, so it is currently difficult to relate plaque morphology in its early stage to its vulnerabil-ity over the longer term. The development of numerical and theoretical models, as well as the improvement of biomedical engineering imaging,12–14 may provide the means to predict
such phenomena; nevertheless, a large number of important physical parameters (geometry, blood viscosity, transmural pressure, blood flow rate, heart beating frequency, blood and tissue density, tissue elasticity properties and boundary conditions) is involved in the implementation of the problem, making the task complex and requiring sometimes unrealistic simplifications. An additional complexity comes from the fact that these parameters vary with the groups under study, with the subjects considered, with their sex and their age, and even-tually with the circadian pressure changes.15,16 This parameter
variation, on which mechanical effects (hemodynamic and structural stresses) are strongly dependent, makes theoretical and numerical model development very challenging.
The purpose of the present article is to review the current knowledge of these parameters as well as of the influence of hemodynamic and structural stresses on plaque formation, development, and rupture.
In the following sections, after a description of the animal models used to mimic human plaque development, a discus-sion about the physical parameters involved in the mechanical model will be conducted. The hemodynamic parameters and structural stress influence on plaque formation, development, and rupture will then be reviewed.
Animal models
Different animal models are used to study experimen-tally vulnerable atherosclerosis development, such as the Watanabe heritable hyperlipidemic rabbit model17 and the
porcine model;18 however, in recent studies, mice have been
the dominant model used for experiments. Different mouse models are available, and their capacity to reproduce vul-nerable plaque behavior is discussed in detail in Bond and Jackson,19 Schwartz et al,20 and Jackson et al.21 The most
common models are the apolipoprotein E-deficient mouse22
(ApoE-/-) and the low-density lipoprotein (LDL) receptor-deficient mouse (LDLR-/-).23 Under normal diet, the ApoE
-/- model develops plaques spontaneously, whereas for the LDLR-/- model the process of atherosclerotic plaque for-mation is much slower. Both mouse models rapidly develop atherosclerosis on a high-fat, high-cholesterol diet. For these models, the location of the plaques on the arterial tree is similar to that for humans (aortic root, lesser curvature of the aortic arch, and branch points of the brachiocephalic, left carotid, and subclavian arteries).24 This localization is
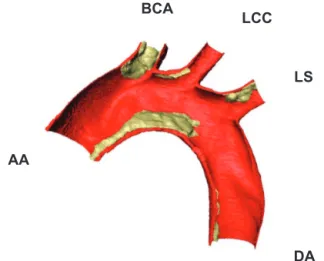
often associated in the literature with hemodynamic para-meters, as reviewed in a following section. An example of plaque formation in an ApoE-/- mouse obtained by X-ray imaging on the Swiss Light Source synchrotron is pre-sented in Figure 1 (mice under 12 weeks of fat diet). The techniques used by our group to reconstruct such an image are described in Assemat et al.25 A shortcoming in these
models is that plaque rupture, with superimposed thrombosis commonly observed in humans, is rarely observed in the two previously described mouse models26 unless surgery is
applied on the mice.21,27,28
A new mouse model has been developed in the last few years – the SM22α-hDTR ApoE29 – which is a
trans-genic mouse model expressing the human diphtheria toxin receptor in addition to the deficiency of ApoE. When fed a “Western” diet, the mice undergo a thinning of the fibrous cap, a loss of collagen and matrix, an accumulation of cells, and intense intimal inflammation, which are some of the phenomena described in the literature to be characteristic of plaque vulnerability.11 Experiments are currently being
undertaken in our laboratory to test implications of this
Dovepress
Assemat and Hourigan
ChronoPhysiology and Therapy downloaded from https://www.dovepress.com/ by 147.127.33.113 on 27-Apr-2018
new model on the mechanical phenomena responsible for plaque formation and rupture. In parallel, experiments are being performed on an ApoE–/– mouse model to study stable plaque development.
The physical parameters necessary to implement numeri-cal methods used to achieve the numeri-calculation of hemodynamic and structural stresses will be described in the following sections. The influence of these parameters on the mechanical effects will be presented for cases where it has been described in the literature.
Numerical model
Three equations, with associated initial and boundary con-ditions, are commonly used to model the coupled blood flow (fluid) and artery motion (solid). The first equation models the incompressibility of the blood flow, the second corresponds to the Navier–Stokes equation and represents the conservation of momentum, and the third is the elas-todynamic equation, which describes the motion of the flexible artery wall.
∇⋅ =U 0, ρf σf U t U U ∂ ∂ + ⋅∇ ( ) = ∇⋅ , ρs(Dttη− fs)= ∇⋅σs.
In these equations, ρf and ρs represent the fluid and solid density, respectively, U is the 3-D blood velocity field, η is
the 3-D structure displacement, and fs represents the body forces. The terms σf and σs correspond, respectively, to the fluid and structural stresses. The quantity σf depends
on the internal blood pressure distribution p, on U and on the dynamic viscosity µ, whereas σs depends on the elastic properties of the tissues and on the loads applied on them (for example, pressure force, flow velocity, tension). Additional effects could be taken into account as thermal or chemical effects, but they will not be discussed here. In fluid–structure interaction (FSI) prediction models, the most realistic current type of numerical model used to study mechanical effects on plaques, the unknowns that need to be calculated are U, p, and η, whereas all the
other terms correspond to physical parameters experi-mentally measured and implemented in the numerical codes. In the following subsections, these parameters are discussed.
Concerning the boundary conditions at the blood–tissue interface, the parameters are defined mathematically by the equilibrium of the constraints and the continuity of the velocity field:
σf⋅ = ⋅ ,nf σs ns
U D= tη.
These boundary conditions are implicitly implemented in the numerical code, and no experimental measurement is necessary to define them. Additional boundary conditions must be applied to the flow and the structure for the problem to be well determined. These conditions are the inlet and out-let boundary conditions. They depend on different physical parameters, such as the physiological blood flow waveform, the natural stretching of the vessels, or the elasticity of the surrounding matrix tissue, so their definition is complex and a current challenge of research.
Physical parameters
Boundary conditions for the inlet and outlet
Blood flow in arteries is dominated by unsteady flow phenomena.30 Simulating steady flow can be useful in small
vessels for which the pulsatile characteristic of the flow has been damped because of the downstream resistance and the distensibility of the vessels. In addition, it can give a first approximation of the distribution of the time-averaged wall shear stress (WSS);31 however, most of the time, the use of
unsteady flow conditions is necessary to simulate realistic situations.
As a consequence, the imposed boundary condi-tions applied to solve the fluid part of the problem have a significant influence on the numerical results, and thus accurately defining the boundary conditions is crucial.32 BCA
LCC
LS
AA
DA Figure 1 Half aortic arch segmented from synchrotron data; red corresponds to
the artery wall, with atherosclerotic plaque in yellow.
Abbreviations: AA, ascending aorta; DA, descending aorta; BCA, brachiocephalic
artery; LCC, left common carotid; LS, left subclavian.
Dovepress Evolution and rupture of vulnerable plaques
ChronoPhysiology and Therapy downloaded from https://www.dovepress.com/ by 147.127.33.113 on 27-Apr-2018
Boundary conditions are commonly defined in terms of pressure waveforms, velocity waveforms, or flow rate. Such waveforms can be obtained by measuring the velocity field or pressure at particular locations in the arterial tree in live animals. Such measurements can be made by various techniques, including magnetic resonance imaging (MRI) and Doppler ultrasound.
The boundary conditions that need to be applied to calculate the blood flow depend on the characteristics of the vessel of interest. Plaques are mainly observed in three vascular regions of the body: the coronary vasculature, the carotid, and the aortic arch. The treatment of the flow boundary conditions for the carotid and aortic arch is quite similar, whereas circulation beds such as coronary vascula-ture have a specific hemodynamic condition and require a specific treatment. The complexity of the implementation of numerical methods in the coronary vasculature comes from the different spatial (arterial, venous, capillary system) and temporal scales (short, cardiac cycle changes; long, remod-eling and neovascularization) involved33 in the modeling,
but also from the strong coupling between mechanical and biological effects.34 Indeed, the specificity of the coronary
circulation is the compression of the blood vessels as the heart contracts, combined with the necessity to provide continu-ous perfusion to match metabolic rates (such as oxygen).33
During the systole, the contracting myocardium generates a high level of intramyocardial pressure that compresses the coronary microvasculature, thereby impeding blood flow. Conversely, during diastole (much longer than the systole), intraventricular pressures transmitted into the left ventricular wall exert a small compressive force on the intramural vas-culature, creating “waterfalls” at the level of the arterioles and the venules.35 Another characteristic of the coronary
vasculature is the autoregulation process. This corresponds to the intrinsic tendency of the vasculature to maintain constant blood flow despite changes in perfusion pressure34 during a
constant metabolism. These adjustments correspond mainly to a change in the diameter of the arterioles and microvessels. The extensive reviews of Waters et al,33 Westerhof et al,34
and Duncker and Bache35 give a detailed insight of the
com-plexity of the flow in coronary vasculature. In particular, Waters et al33 recently reviewed current challenges to model
accurately coronary vascular biomechanics.
Concerning the aortic arch, the temporal and spatial scale ranges are more homogeneous, and boundary conditions are often directly extracted from in vivo measurements. In addition, compared to the coronary vasculature, the motion of those arteries is more independent of biological
effects, and their behavior is mainly subject to mechanical loads. For animal studies, measurements are typically taken in unconscious animals, and anesthesia is known to reduce heart rate and hence cardiac output. Therefore, the waveforms for anesthetized animals are typically scaled to obtain the velocity waveform in a conscious animal. This technique has been employed by Huo et al;36 they used an inlet velocity
profile measured from a Doppler flow meter that was scaled based on ratios of heart rates and time-averaged flow rates in conscious and anesthetized mice. Van Doormaal et al37 also
used a scaling technique to obtain inlet boundary conditions from aortic root velocities measured in anesthetized mice, using phase-contrast MRI. In a separate study involving mice, scaling was performed by compressing the diastolic portion of the cardiac cycle, but not the systolic, since it was noted that the decreased cardiac output during anesthesia is predominantly due to decreased heart rate rather than stroke volume.38 However, not all studies have used an
anesthetized-to-conscious scaling technique to obtain the inlet bound-ary conditions. Trachet et al39 employed an inlet velocity
waveform from humans that was scaled in magnitude and time to match mouse physiology. In addition, Janssen et al40
demonstrated that cardiac output can be measured reliably in conscious mice using transit-time flow and electromagnetic probes placed in mice by surgery. In addition to velocity and flow rate, boundary conditions may be defined by pressure. In a study of the idealized human aortic arch, Vasava et al41
employed a pulsatile pressure pulse as the inlet boundary condition.
Concerning the outflow boundary conditions, outflow velocities could also be measured in live animals, and scaled velocity waveforms directly applied to the boundaries. However, in reality, the velocity waveforms in the abdominal aorta arrive later than those measured earlier in the arterial tree, due to interactions between the blood flow and artery wall motion.42
For this reason, in many numerical simulations, rigid walls are assumed; thus, to ensure mass conservation, it is considered that the sum of the inflow and outflow must be equal so that the velocity waveforms measured in vivo cannot be directly applied. In order to overcome this problem, Trachet et al42
redistributed the flow (from Doppler flow measurements) across all inlets and outlets using a weighting scheme. In other studies conducted in mice, the outlet boundary conditions were based on a percentage of the flow rate entering the aortic root.31,37–39 These studies assume that flow division remains
constant throughout the pulse. Huo et al36 used pressure as a
boundary condition when studying pulsatile flow through the mouse aortic arch. The pressure at each outlet was obtained
Dovepress
Assemat and Hourigan
ChronoPhysiology and Therapy downloaded from https://www.dovepress.com/ by 147.127.33.113 on 27-Apr-2018
based on a scaling law, using pressure measurements from the common carotid artery. Pulsatile pressure profiles were also employed as the outlet condition in a numerical study in the human aortic arch.41 In Lantz et al,43 scaled mass ratios were
applied at the outlet of the connected arteries, and an impedance boundary condition applied at the end of the descending aorta. This boundary condition is represented by a Windkessel model and describes the relationship between the aortic outflow and a physiologically relevant aortic pressure condition.44 To our
knowledge, one of the most complete studies conducted on the boundary conditions in a complex geometry is the recent work of Moireau et al.45 In this study, the flow inlet boundary
condition was a volumetric waveform, whereas a “coupled multidomain” approach is used for the outlets where three-element Windkessel models are implemented.
The previously described inlet and outlet boundary have been associated with numerical models that consider rigid walls (except the two last references);43,45 however, for a
more realistic model, a coupled solid motion must be taken into account and boundary conditions on the solid must be implemented as well.
Most of the studies that take into account the fluid and structure coupling consider that the tissue is fixed at the inlet and outlet46 or that structure motion is prevented in the axial
direction.47 An illustration of the influence of such
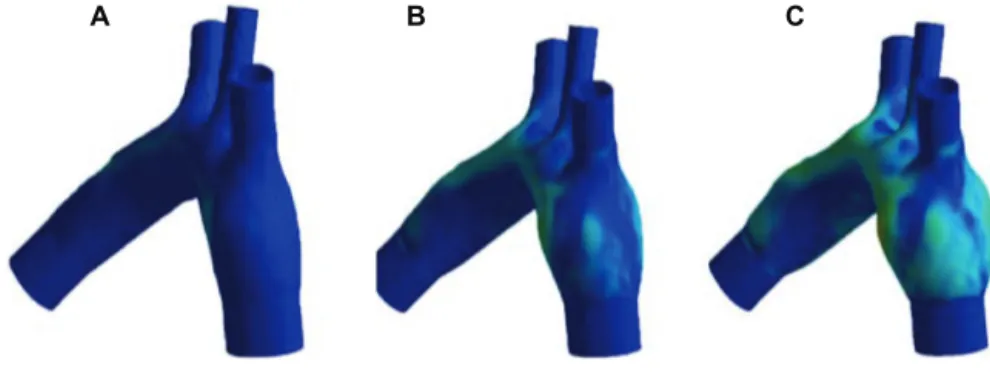
bound-ary conditions is shown in Figure 2.48 Here, the geometry
was obtained by synchrotron X-ray computed tomogra-phy imaging. Pressure was increased from 100 mmHg to 105.2 mmHg. The simulations have been performed with the AnSys CFX for the fluid solver, and AnSys Mechan-ical Parametric Design Language has been used for the struc-tural solver. The two-way FSI coupling between the strucstruc-tural and fluid solvers is achieved within a coupling iteration loop (AnSys Multi-field), where field variables (displacement and forces) are exchanged between both solvers. The hexahedral
mesh was achieved using AnSys ICEM CFD software. It is observed in Figure 2 that fixed boundary conditions for the solid generate a bulging; therefore, more realistic boundary conditions must be taken into account to predict the deforma-tion of the artery wall in in vivo condideforma-tions.
To this aim, natural traction equilibrium can be implemented.49,50 An improved model of boundary conditions
for the tissue has been implemented by Lantz et al.43 In their
study, the geometry is considered to be constrained in axial direction at the inlets and outlets, but it is allowed to evolve in the radial and circumferential directions at all locations. In addition, as the tissue surrounding the aorta is expected to have a damping effect on the aortic wall movement, this effect is taken into account by applying a linear elastic support boundary condition on the external face of the aorta. In Moireau et al,45
the authors note that the descending thoracic aorta is longitu-dinally tethered by the spine, whereas the ascending aorta is less constrained by external tissues and structures. To take into account this variety of phenomena, they consider Robin bound-ary conditions on the external surface of the artery:
σs ns ksη s η s
d dt p n
⋅ = − −c − 0 .
In this equation, ks and cs depend on space and model, respectively: an elastic and a viscoelastic response of the surrounding tissue matrix. Similar boundary conditions are implemented on the structure outlet. Concerning the inlet (aortic arch root), large displacements of the aorta due to heart-beating motion are taken into account through similar Robin-type boundary conditions:
σs⋅ = −ns ks(η η− b)
Here, ηb is a prescribed displacement that can be extracted from in vivo image data.
A B C
Figure 2 (A–C) Deformation of artery walls under pressurization.
Notes: Isocontours of structural stress are represented. The geometry has been obtained by synchrotron X-ray imaging. The mice tissues were perfusion fixed with
Karnofsky’s fluid (2% glutaraldehyde + 4% paraformaldehyde in 0.1 M phosphate buffer, pH 7.4) at a mean pressure of 100 mmHg. The tissue is consider isotropic, with a Young’s modulus of E = 20 kPa. (A) p = 100 mmHg; (B) p = 102.6; (C) p = 105.2 mmHg.
Dovepress Evolution and rupture of vulnerable plaques
ChronoPhysiology and Therapy downloaded from https://www.dovepress.com/ by 147.127.33.113 on 27-Apr-2018
Besides the question of the implementation of realistic boundary conditions, the numerical coupling between the fluid and structural solvers is far from being trivial. In this approach, three main difficulties have to be overcome: the implementation of large deformation, the implementation of thick structure with various elastic properties (the plaque generates a thickening of the artery wall and the structural stresses over the thickness need to be known), and the strong coupling between the fluid and the structure dynamics. The first point implies that the numerical methods used to imple-ment the fluid–structure coupling need to enable large mesh deformation or to be able to track the fluid solid interface without changing the basic mesh. Mesh-deformation methods are often preferred in commercial codes such as AnSys or ADINA, but also in open-source codes such as OpenFOAM. This approach was used, for instance, by Lantz et al43 to study
the influence of moving wall on the calculation of WSS in human aortic arch. Huang et al51 and Leach et al52 also used
this approach to study plaque rupture in human carotid arteries. Another method that takes into account the mesh deformation is the Arbitrary Langrangian Eulerian method implemented by Moireau et al45 to study patient-specific
aortic arch deformations. The second type of method often used in bioengineering comprises front tracking/capturing techniques, such as immersed boundary methods and level-set methods, implemented, for example, at the Johns Hopkins University to simulate flow in the left ventricle.53 However,
the main limitation of these two powerful methods in the present context comes from the approximation of the vessel
wall as a membrane, so that plaques cannot be taken into account. The last point to be addressed is the time coupling between the fluid and the solid. Most of the current methods use iterative methods to transfer the loads between the fluid in the solid phase within one time-step iteration. In reality, the fluid and solid are fully coupled so that this iterative pro-cess induces additional numerical approximations within the temporal scheme. In order to prevent such approximations, direct methods, such as the coupled momentum method45
or the simultaneous solution approach (ADINA), can be implemented.
Geometrical dimensions
As discussed previously, even if a specific plaque distribution pattern is recovered between subjects,11 the geometry of the
plaques depends on the species, sex,21 and specific
morphol-ogy of the subjects considered. The question of the impact of the geometrical parameters is then important for the pre-diction of plaque formation and rupture. As a consequence, determining the geometry with accuracy is a crucial question related to the advancement of imaging techniques.12–14
Currently, the main techniques used in the literature are MRI,31,49 ultrasound,31,54 angiography,55 computed
tomogra-phy,45,56 and microcomputed tomography.25,57,58 An example
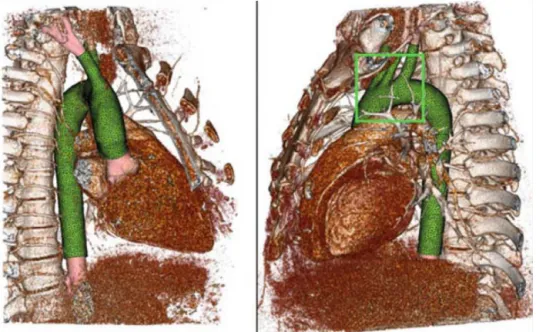
of the geometry obtained by computed tomography and used for computational simulations is given in Figure 3.45
A recent review of the current imaging techniques used in vivo and in vitro is given in Fleg et al.59 Concerning the
resolution of the cited methods for in vivo measurements,
Figure 3 Computed tomography volume rendering, segmentation, and associated computational mesh.
Reproduction from Moireau et al.45
Dovepress
Assemat and Hourigan
ChronoPhysiology and Therapy downloaded from https://www.dovepress.com/ by 147.127.33.113 on 27-Apr-2018
MRI, used extensively for clinical applications, achieves a spatial of order of a few millimeters60–64 up to 0.5 mm65
for a temporal resolution ranging between 10 and 57 ms. Another extensively used imaging technique is ultrasound imaging, which can provide a very good temporal resolution. However, this method is limited by its spatial resolution and overall penetration depth, which decreases (from 30 mm to a few millimeters) when higher spatial resolution is required (0.7 mm to 40 µm).65 X-ray technology (angiography when
associated with the visualization of blood vessels) is also a commonly used technique (0.6 mm for the spatial resolu-tion and 210 ms for the temporal).66 Recently, the use of
synchrotron monochromatic X-ray radiation67 enabled the
authors to reach a spatial resolution of 8 µm and a temporal resolution of 33 ms in angiograms obtained from an adult rat. This technique provides only 2-D images, a restriction that can be overcome using the promising microcomputed tomography technique. Dubsky et al68 used it to image lung
motion of mice and newborn rabbits. The spatial resolution reached is 20 µm for a temporal resolution of 33 ms. In the present context, one of the challenges is to obtain images of atherosclerosis in the early stage of development to prevent eventual complications, a purpose that can be achieved using high-resolution imaging such as microcomputed tomography; however, this method is risky, and other techniques are usually preferred for in vivo imaging. In in vitro imaging techniques, spatial resolution up to 23 µm can be obtained with MRI,69,70
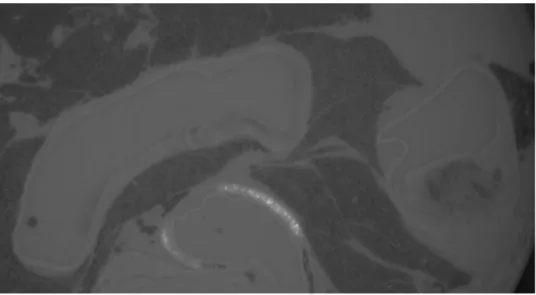
and up to 1.7 µm with microcomputed tomography (recent results obtained by our group at the Swiss Light Source, Figure 4). In addition to these approaches, new techniques are emerging, such as nanoparticle technologies71,72 coupled
to traditional imaging methods (eg, MRI). By this technol-ogy, the core of the plaque can be tracked using specific nanoparticles embedded in a convenient product that targets the cells needed to be observed. In the context of atheroscle-rotic diseases, the targeted cells are the macrophages, which deposit in the lipid core.
Concerning the effects of the dimensions on the hemo-dynamic parameters, Trachet et al39 discussed the impact of
the size of the aortic arch at different times of a mouse’s life (from embryonic stage to 9 months old) and calculated the WSS associated. They showed that the size has a substantial impact on the WSS, a fact that can considerably change the stresses applied on the plaque and therefore its vulnerability. In a separate study, Feintuch et al31 discussed the effect of the
scaling between humans and mice, and found that the wall stresses induced by the blood flow are higher in amplitude and more spatially uniform in mice than in humans. This result can be explained by the difference in the Reynolds num-bers, a dimensionless parameter that characterizes the ratio of inertial forces to viscous forces, and which varies from 100 in mouse aortic arch to 1500 in human aortic arch in the steady-flow simulations of Feintuch et al.31 For a human aortic
arch, Lantz and Karlsson73 indicate, based on MRI
mea-surements, that the instantaneous Reynolds number ranged from 150 at the late diastole to 6500 at the peak systole. The mean Reynolds number is found to be around 1200. Consequently, the resulting flow in humans is more complex and eventually turbulent64 (see next section); however, zones
of low WSS are located in the same areas of the arterial tree for both the species, a criterion related to plaque-formation site location. To underline the importance of the geometry in
Figure 4 Two-dimensional section of an ApoE(-/-) aortic arch obtained by computed tomography.
Notes: The high-resolution details obtained for the plaque in the ascending aorta can be seen on the right of the figure. Dark zones correspond to lung tissue.
Dovepress Evolution and rupture of vulnerable plaques
ChronoPhysiology and Therapy downloaded from https://www.dovepress.com/ by 147.127.33.113 on 27-Apr-2018
the plaque development process, Tomita et al,74 continuing
from the work of Zhu et al,38 studied the plaque development
in ApoE-null mice of different genetic backgrounds (29S6/ SvEvTac and C57BL/6J). They found that the geometric differences (broader inner curvature for the first, and larger vessel diameter for the second) resulted in a huge difference in the size of the developed plaques in the different mouse strains.
Fluid physical properties
The fluid density ρf is quite independent of the species and of the age considered, and is equal to 1060 kg/m3 in most of the
studies reviewed in the present paper.75 For the viscosity, the
question of non-Newtonian effects has been raised,76,77 and a
Carreau viscosity model78–81 or a power-law model82 are often
preferred to treat non-Newtonian effects in large arteries. In Liu et al,81 the authors indicate that the non-Newtonian
effects can be significant in the study of mass transport, in particular in the atherogenic-prone areas where luminal surface LDL concentration is high. In Johnston et al,82 five
non-Newtonian models were compared and the use of the generalized power-law model advised to capture the physics of the problem in zone of low shear stress; however, most of the studies reported in the present paper consider the blood as Newtonian, a reasonable assumption provided the shear rate ∂U/ ∂r is greater than 150 s-1.83 This condition is expected to
be fulfilled in large arteries under normal activity.
In respect of the numerical model for the fluid, the question of the transition to turbulence is raised, as specific numerical methods need to be used to treat the complexity of the flow in a reasonable computational time. In order to determine the critical Reynolds number at which the flow becomes turbulent under physiologically realistic conditions, Peacock et al84 investigated steady and oscillating flow in
glass tubes of different diameters. As expected, they found a critical Reynolds number for steady flow of around 2000. For the oscillating flow, they found an empirical law that relates the critical Reynolds number and the Womersley (pulsatile flow forces versus viscous forces) and Strouhal numbers (oscillatory inertial forces versus convective inertial force). They found that the critical Reynolds number increases when the Womersley number increases. According to this study, the critical Reynolds numbers related to physio logically realistic conditions are: in the human aortic arch, 5500 (rest), 9800 (exercise); and in the human left coronary 1650 (rest), 2650 (exercise). However, these experiments have been undertaken in rigid tubes, so the turbulence transition in an elastic vessel is still a question under debate. In a recent study, Stalder et al64
investigated the turbulence of the blood flow in the aortic arch of 30 volunteers under rest condition. It was found that flow instabilities of the laminar flow are likely in ascending and descending aorta but unlikely in the arch, and that this transition is also sex-dependent.
In the case of the numerical methods implemented for tur-bulent situations, Lantz and Karlsson73 and Lantz et al85 used
large-eddy simulation methods to study the blood flow in the human aortic arch. This method is generally more accurate than the commonly used Reynolds-averaged Navier–Stokes methods in the field of turbulence. For small animals such as mice, the characteristic mean Reynolds number involved is much smaller than in humans (,100),31 and transition to
turbulence is not expected, so direct numerical simulation methods can be used.
Solid physical properties
Tissue and lipid-core density have been measured by Shinohara et al86 for male ApoE-/- mouse atherosclerosis.
The mass density of the lipid area was found to be lower (1.011 ± 0.001766 g/mL) than that of smooth-muscle area or collagen area (1.057 ± 0.001407 and 1.080 ± 0.001794 g/mL, respectively). To our knowledge, numerical calculations tak-ing into account these variations have not yet been conducted, so the influence of this physical parameter on hemodynamic or structural stresses has not yet been identified.
A more complex question concerns the determination of the elastic properties of the vessels. Indeed, the tissue is an anisotropic hyperelastic material, so the parameters that define elastic properties depend not only on the type of tissue considered (intima, media, adventitia, fibrous cap, or lipid core)87 but also on the direction considered (radial,
circumferential, or axial)88, on the area of interest in the
arterial tree and on the loading applied. In addition, vessels are preconstrained structures, a fact observed by the reduc-tion of the length and of the perimeter of the vessel during excision. This effect must be taken into account, in addition to the previously cited ones, during the modeling of arterial elastic properties. In his book Biomechanics: Mechanical
Properties of Living Tissues,89 Fung gives a good description
of these different aspects.
On the question of the preconstraints, two parameters must be determined: the stretch ratio in the longitudinal direction obtained measuring the shrinkage during the dissection of the vessel, and the opening angle obtained when a section (ring) of vessel is cut. Fung89 underlines that attention must be paid
in the determination of these parameters, as they depend on the location in the arterial tree. In Fung,90 it is indicated that
Dovepress
Assemat and Hourigan
ChronoPhysiology and Therapy downloaded from https://www.dovepress.com/ by 147.127.33.113 on 27-Apr-2018
the stretch ratio in rabbit arteries varies from 1.6 in the carotid to 1.4 for the upper abdominal aorta, whereas Fung and Liu91
showed that the opening angle in normal rats varies from 160° in the ascending aorta and 90° in the arch to 60° in the thoracic region. Details of the use of these parameters for the modeling of the vessel properties are not discussed here, but the reader can refer to Lee et al,92 Holzapfel et al,93 or Raghavan et al94
for additional information on this issue.
Concerning the variation of the elastic properties as a function of the load applied (pressure, tension, and flow, for instance), one can refer to Martinez et al95 and Lee et al.92
In these papers, the authors measure the evolution of the longitudinal and circumferential stretch ratio as a function of internal pressure during an inflation test. This procedure enables them to approximate the stress–strain evolution, characteristic of the elastic properties of a material, by a math-ematical hyperelastic model. In the literature, different types of mathematical models are used. The most popular ones are the Fung model92,96 and the Mooney–Rivlin model.97–99 The
models can be of exponential (Fung), polynomial (Mooney– Rivlin), or logarithmic form.100 An extended review of these
models is given in Humphrey101 and Holzapfel et al.93 More
elaborate models that take into account the morphologi-cal structure of the artery, ie, wherein the collagen fibrils are embedded in concentrically arranged elastin/smooth-muscle membranes,102,103 have been also developed. For
the most recent models, the aim is to take into account a higher degree of complexity. For instance, in Zulliger and Stergiopulos,104 the stiffening of the aorta with progressing
age is investigated. On the question of the stiffening of the arteries due to age, Astrand et al105 used an in vivo technique
to study the stiffening of elastin and collagen. They found that the stiffness of elastin increased despite the decrease in elastin content and that at high physiological pressure, there was a stiffening of collagen. They also put forward a sex difference with far fewer age-related effects for women. In Valentin et al,106 the authors suggest that the loss of elastin and
vasoactive function and collagen stiffening are fundamental for the description of aortic aging processes. Unfortunately, most of the constitutive models treat the arterial wall as a single layer, and as described in Fung’s book,89 the elastic
vessel properties depend on the location in the constitutive layers of the vessel wall (intima, media, adventitia). In a study of rat arteries,107 the Young modulus E was measured
in the ascending aorta and found to be E = 447 kPa for the intima-media layer and E = 112 kPa for the adventitia layer. The same multiplying factor was found in the descending aorta, with E = 248 kPa for the intima-media and E = 69 kPa
for the adventitia layers. According to this observation, some researchers developed two-layer constitutive anisotropic models to describe the elasticity of the variety of material found in vessel walls.93,108,109 Unfortunately, none of these
models adapted for healthy arteries can be applied directly to more complex situations, such as arteries with atherosclerotic plaques. As a consequence, in the last few years, different devices have been used to measure elastic properties of ath-erosclerotic plaques, such as compressive cyclic loading and stress–relaxation testing,110 and torsional rheometer testing
of synthesized lipid pools.111 These techniques require
mov-ing the plaques from their natural environment and treatmov-ing them as a homogeneous material. Hence, they do not account for the fact that the close proximity of stiff and compliant materials can lead to stress concentrations where rupture may occur.112 To overcome this restriction, Matsumoto et al113
used a scanning microindentation tester to measure the radial stiffness of the smooth-muscle cell layer and elastic laminae of a porcine aorta. Also, Oie et al114 used a tactile mapping
system to measure the axial stiffness of the media and of the elastin. More recently, atomic force microscopy has been used on ApoE-/- mouse aorta samples115,116 to undertake mapping
of the elasticity properties of the different material present in the artery wall and in the atherosclerotic plaques. This method is of particular interest in determining the elastic properties of the lipid core (1.5 ± 2 kPa115 and 5.5 ± 3.5 kPa116).
The interest in determining precisely the physical para-meters involved in the numerical model presented previously is to calculate accurately the blood velocity field, the pres-sure distribution in the lumen, and the deformation of the vessel walls. The knowledge of these quantities permits the calculation of parameters used to define criteria for plaque formation, development, and rupture processes. An overview of these parameters and their relation to the plaque evolution is presented in the following section.
Plaque formation
Atherosclerotic plaques are found at particular sites in the arterial tree and their location depends largely on hemody-namic factors such as wall shear stress (WSS).2,117 Here,
the literature on the distribution of the plaque in the arterial tree and its dependence on the hemodynamic factors will be reviewed. Most of the studies reported are related to plaques in the carotid or aortic arch.
Atherosclerotic plaques are commonly found on the inner curvatures of arteries and near bifurcations. To explain this phenomenon, numerous studies have investigated hemody-namic parameters.
Dovepress Evolution and rupture of vulnerable plaques
ChronoPhysiology and Therapy downloaded from https://www.dovepress.com/ by 147.127.33.113 on 27-Apr-2018
Hemodynamic parameters are influenced by the geomet-ric irregularities of the arteries, with low WSS (unidirectional WSS with a low time average), commonly observed on inner curvatures of arteries and oscillatory WSS (bidirectional WSS with a low time average) in regions of bifurcations.118 WSS is
defined as the product of the viscosity and the normal deriva-tive of the blood velocity at the wall (WSS = µ∂ U/∂r w), an equation that underlines the importance of the calculation of the blood velocity field. In the literature, however, due to the oscillatory nature of the blood flow, the calculation of time averaged wall shear stress ( TAWSS= 1
∫
0
T w dt T
|τ | , where T is a cardiac cycle period, τw is the instantaneous WSS vector and t is time) is often preferred and used to calculate the oscillatory shear index (OSI), discussed later in the present article, which describes the cyclic departure of the WSS vector from its predominant axial alignment. Caro et al119 suggested that the distribution of
atheroscle-rotic lesions corresponds to regions of the arterial wall that experience low shear rate, and proposed that low WSS leads to atherosclerosis development through altering cholesterol transport. A significant correlation between low WSS and an increased rate of atherosclerosis progression was shown in humans using quantitative angiographic analysis and computer simulations.120 Stone et al121 performed an in vivo
study involving humans with stable coronary artery disease and demonstrated that plaque progression occurs in regions of low WSS and may be accompanied by either expansive or constrictive remodeling. The association between low WSS and atherosclerosis is now widely accepted, and efforts are being made to provide imaging techniques that enable it to be measured in vivo.122 Low WSS has been shown to
upregulate both adhesion molecules that attract leukocytes and growth factors that promote smooth-muscle cells to proliferate and migrate.2 Using porcine culture endothelial
cells, Warboys et al123 showed that acute application (1 hour)
of shear stress increases the permeability of the endothelial monolayer, whereas chronic application (1 week) induces the opposite phenomenon, reducing the permeability and therefore the infiltration of macromolecules responsible for plaque formation. This provides a molecular explanation for the role of hemodynamics in atherosclerosis, since both of these processes are critical in plaque formation.
Other hemodynamic factors are also thought to play a role in plaque development, including the OSI,
OSI= − ∫ ∫
12 1 T1 0Tτwdt /T1 0T|τw|dt ,which describes the
alignment of instantaneous WSS vector with average WSS vector, and the WSS gradient (WSSG), corresponding to spatial WSS variation. Concerning the oscillatory shear, the
correlation between low WSS, high OSI, and plaque forma-tion site is still under debate. A laser Doppler velocimetry study involving pulsatile flow through a model human carotid bifurcation revealed that while plaques grow in regions of low WSS, atherosclerosis development is enhanced by oscilla-tions in WSS.124 These findings have been supported by
oth-ers, with Huo et al36 demonstrating that regions of low WSS
and high OSI correlate with regions prone to atherosclerosis development in a numerical study involving the mouse aorta and with Liu et al81 for a human aorta. Recently, Thim et al125
showed that both low WSS and oscillatory shear stress seem to be necessary for plaque formation, a conclusion supported by the results of Rikhtegar et al.126 In a numerical study of
human aortic arch, Lantz et al85 report an inverse relation
between OSI and time- average WSS, sustaining the theory of the correlation between low WSS and high OSI zones; however, the authors report additional situations where both the OSI and time-average are high in sites prone to athero-sclerotic formation. The question of the necessity of low WSS to generate plaques is also raised in Hoi et al,58 where
zones of high OSI are shown to be in qualitative agreement with plaque spatial distribution in LDLR-/- mouse aortic arches. However, plaques have been found in zones where time-average WSS is not necessarily low. In this study, the authors suggest that oscillatory flow could be an atherogenic stimulus independent of the low WSS. This correlation is also questioned in Van Doormaal et al.37 In Harloff et al,60
the authors performed a study of the WSS and the OSI in the aortic arches of 62 stroke patients. They found that high OSI was not directly correlated with complex plaque sites, whereas a better correlation was found with regions of low WSS; this result is in apparent contradiction with previous ones, but was obtained on a larger cohort.
Furthermore, the phenotype of the developing plaque has been shown to depend on the combination of these hemodynamic factors. In an in vivo study in mouse carotid arteries, stable plaques were shown to develop in regions of oscillatory WSS and vulnerable plaques in regions of low WSS.118 In an in vitro experiment
investigating the responses of vascular endothelium to disturbed flow, low WSS and large WSSG were found near reattachment sites. By observing the responses of the endothelial cells, it was proposed that WSSG may induce changes in endothelial cell function and con-tribute to atherosclerosis development.127 A review of
the endothelial layer behavior with shear stress is given in Chiu and Chien.128 Lei et al129 suggested that WSSG
may be the best indicator of atherosclerosis, according
Dovepress
Assemat and Hourigan
ChronoPhysiology and Therapy downloaded from https://www.dovepress.com/ by 147.127.33.113 on 27-Apr-2018
to a numerical study involving branching arteries in rab-bits. Farmakis et al55 also suggested the use of WSSG
as a criterion for plaque localization, as even if spatial distribution of WSSG is similar to WSS spatial dis-tribution, WSSG regions are extended to larger areas, in agreement with observations of lesions reported in previous studies.55 Recently, Michell et al130 showed that
high pressure is related to leukocyte adhesion along the endothelium, a phenomenon related to an early stage of the plaque-formation process. This result underlines the difficulty of determining the exact contributions of various hemodynamic parameters, such as WSS, OSI, WSSG, and pressure forces.
In addition, the computational studies reported so far con-sider the artery as a rigid wall. This assumption is discussed by Lantz et al,43 who showed that the wall motion had a low
influence on the time-average WSS but could have a more visible influence on instantaneous WSS values. Lawrence-Brown et al131 suggested that stress in the structure could also
be a potential mechanism responsible for plaque-formation processes.
Thus, whilst it is largely agreed that atherosclerotic devel-opment occurs in regions of disturbed flow, the influence of the different mechanical effects on plaque formation and their relative participation in the process is still a question under debate.
Plaque development
While there have been many computational studies in healthy arteries associating the development of plaque with regions of low WSS and other hemodynamic parameters, the hemodynamics in the presence of atherosclerotic plaques are less well understood. Most of the studies conducted on this problem consider rigid stenosis;132–137 however,
even under this restriction, the blood flow is shown to be complex. Figure 5 indicates such a behavior for a model of axisymmetric stenosis in a perspex tube.134 The
trajec-tories in the flow are observed by fluorescein dye. This
complexity observed in a simple model indicates the more complex flow change expected in real arteries with plaques. Growing efforts are being made to enable the measurement of flow characteristics in vivo. Particular attention has been paid to develop techniques that permit the measurement of WSS.138,139
From the numerical point of view, Chaichana et al140
performed a computational fluid-dynamics analysis involv-ing model plaque in left coronary arteries to investigate the effect of plaque on the hemodynamics of flow. The presence of plaque was found to alter the pressure gradient, with higher gradients in the stenotic regions that may contribute to plaque rupture. Furthermore, the plaque was found to induce low velocity in the region surrounding the plaque. These low-flow regions are associated with low WSS, and may contribute to plaque progression.140 In another similar
study, plaques at the coronary bifurcation were found to induce low WSS in coronary side branches.141 Lee et al56
studied the flow around a plaque grown in a human carotid bifurcation. They found, in addition to vortex formation downstream of the stenosis, high WSS on the stenosis during the systole, and high spatial gradient of WSS in the region of flow separation. Similar peaks of WSS in ApoE-/- mouse stenosis were found by Hough et al142 during the systole.
Figure 6 reproduces this result for a healthy and pathological brachiocephalic artery.142 In a separate study, Olgac at al143
investigated LDL transport from blood into arterial walls and showed that during the plaque-growing process, the loca-tion of high LDL concentraloca-tion is shifted from the plaque area in the downstream direction. This result is related to the preferential direction in which the plaque will expand. Finally, Samady et al144 studied the relationship between
WSS and the vulnerability of the plaque in the coronary artery. They concluded that low WSS was associated with a constrictive remodeling of the vessel, with plaque having a stable phenotype. However, high WSS was associated with an expansive remodeling, suggesting the transformation to a more vulnerable phenotype.
Figure 5 Experimental visualization of a turbulent flow in a perspex tube.
Notes: The trajectories are visualized downstream of an axisymmetric model stenosis by fluorescein dye.
Reproduction from Griffith et al.134
Dovepress Evolution and rupture of vulnerable plaques
ChronoPhysiology and Therapy downloaded from https://www.dovepress.com/ by 147.127.33.113 on 27-Apr-2018
Plaque rupture
Structural stress
Most of the computational studies that model the plaque for-mation discussed so far have considered the vessels as rigid walls41 and have not taken into account the effects of vessel
elasticity. In reality, the vessel wall expands and contracts as the pulsatile blood passes through the arteries. Interactions between the fluid and the vessel wall and plaque play an important role in understanding plaque vulnerability. Most biomechanical models of plaque vulnerability are based on the theory that plaque rupture will occur when the tissue stress reaches a particular threshold, around 300 kPa.50,145 Whilst
several studies indicate a link between high WSS and plaque rupture,146 structural stresses are thought to play a more
important role, being several orders of magnitude higher than WSS induced by blood flow.99,145,147,148 Belzacq et al47
showed that the structural stress generated by the coupled artery wall motion and blood flow depended on the dimen-sions of the plaque, so that the stress and potentially the rupture are dependent on the remodeling. Local variation in plaque material properties can also contribute to plaque rupture, with disruption commonly observed at sites where the fibrous cap is thin.149 Teng et al150 demonstrated that the
location of critical stress on the plaque surface depends on both fibrous cap thickness and arterial luminal curvature. A 3-D FSI model has revealed an association between regions of high plaque critical stress and fibrous cap disruption in human carotid plaques.50 Furthermore, maximum principal
stresses were identified on shoulder regions of the fibrous caps of carotid plaques, according to the simulations of Kock et al.151 A histology-based finite element analysis was
used by Vengrenyuk et al152 to investigate the peak
circum-ferential stresses in aortic and brachiocephalic plaques of
ApoE-/- mice. Both peak and circumferential stresses in the aortic lesions were found to be significantly less than in the brachiocephalic lesions, despite only modestly larger cap thickness. They proposed that the biomechanical stresses in the brachiocephalic artery resemble human vulnerable plaques, whilst those in the aorta resemble stable lesions.152
Recently, Liu et al153 developed an approach that combines
intravascular ultrasound imaging, biaxial mechanical test-ing, and computational modeling to study the impact of the pre-shrink–stretch process, vessel curvature and high blood pressure on stress, strain, flow velocity, and flow maximum principal shear stress. Hoskins and Hardman154 reviewed the
available techniques for the estimation of structural stress in arterial diseases. To define more accurately a structural stress threshold for rupture, some studies have investigated the frac-ture properties of artery wall. For example, Holzapfel et al155
conducted ultimate tensile tests on iliac arteries from human subjects. They found that the lowest fracture stress occurred in the circumferential direction of the fibrous cap (254.8 ± 79.8 kPa at stretch 1.182 ± 0.1). In Teng et al,156 the authors
investigate the ultimate strength of the adventitia and media of six human atherosclerotic carotid arteries in circumferential and axial directions. The lowest ultimate strength was found for the circumferential media with a value of 150 kPa. In a different study, Versluis et al157 considered that plaque rupture
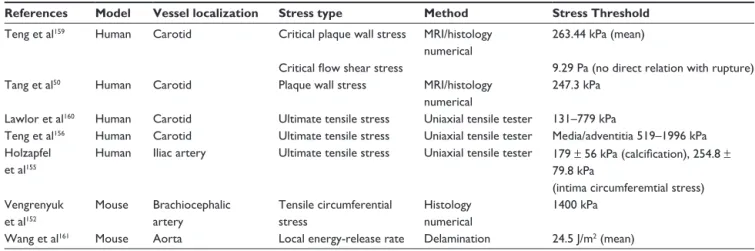
could come from a fatigue process, ie, as the culmination of a chronic injury. Finally, Hallow et al158 reported that in
addition to these pure mechanical effects that describe and eventually predict plaque-rupture processes, the mechanical stress was also related to inflammatory marker expression in atherosclerotic plaques, and so could have an influence of the vulnerability of the plaque. Table 1 reports the rupture thresh-olds of the mechanical stresses found in the literature. 3.569e+001 3.314e+001 3.059e+001 2.804e+001 2.549e+001 2.294e+001 2.040e+001 1.785e+001 1.530e+001 1.275e+001 1.020e+001 7.648e+000 5.099e+000 2.549e+000 0.000e+000 6.184e+001 5.742e+001 5.300e+001 4.859e+001 4.417e+001 3.975e+001 3.533e+001 3.092e+001 2.650e+001 2.208e+001 1.767e+001 1.325e+001 8.834e+000 4.417e+000 0.000e+000 [Pa] [Pa] (i) (ii) A B D C A B D a b c d
∗
∗ ∗
∗
C (iii)Figure 6 WSS distribution on the brachiocephalic artery at four stages during the cardiac cycle as indicated on the volumetric flow rate diagram (iii); (a) systolic acceleration,
(b) peak systole and (c and d) systolic deceleration. The vessel without plaque is presented above (i), and the vessel with plaque in the lower part of the figure (ii).
Reproduction from Hough et al.142
Dovepress
Assemat and Hourigan
ChronoPhysiology and Therapy downloaded from https://www.dovepress.com/ by 147.127.33.113 on 27-Apr-2018
Table 1 Critical rupture values for the stresses extracted from the literature
References Model Vessel localization Stress type Method Stress Threshold
Teng et al159 Human Carotid Critical plaque wall stress MRI/histology
numerical
263.44 kPa (mean)
Critical flow shear stress 9.29 Pa (no direct relation with rupture)
Tang et al50 Human Carotid Plaque wall stress MRI/histology
numerical
247.3 kPa Lawlor et al160 Human Carotid Ultimate tensile stress Uniaxial tensile tester 131–779 kPa
Teng et al156 Human Carotid Ultimate tensile stress Uniaxial tensile tester Media/adventitia 519–1996 kPa
Holzapfel et al155
Human Iliac artery Ultimate tensile stress Uniaxial tensile tester 179 ± 56 kPa (calcification), 254.8 ± 79.8 kPa
(intima circumferemtial stress) Vengrenyuk et al152 Mouse Brachiocephalic artery Tensile circumferential stress Histology numerical 1400 kPa
Wang et al161 Mouse Aorta Local energy-release rate Delamination 24.5 J/m2 (mean)
Abbreviation: MRI, magnetic resonance imaging. Microcalcification
In addition to the structural stress and various phenomena described in the previous section, microcalcifications are believed to play a role in rupture processes. A new hypoth-esis for vulnerable plaque rupture due to stress-induced debonding around cellular microcalcifications embedded in thin fibrous caps was proposed by Vengrenyuk et al.112
The mathematical model used in this study indicates that the amplitude of the structural stress found in some zones of the fibrous cap can be intensified (up to two times) in the presence of spherical inclusions. Following this work, Bluestein et al162 implemented an FSI numerical model and
found that the stresses increased locally upstream of the cal-cification, with stress propagating in the surrounding deform-able structure. This study has been completed by the recent work of Rambhia et al,163 where a coupled microcomputed
tomography imaging and FSI method is used to show the increase of stresses in the fibrous cap due to calcifications. In Hoshino et al,164 a numerical and a theoretical approach
is used to study the effect of rigid (calcifications) and liquid (lipid core) inclusions in a distensible material. They found that the presence of calcification can increase or decrease the structural stresses, and so have a stabilizing or destabilizing effect on the plaque, depending on their relative position to the lipid core. A similar conclusion about the ambigu-ous effect of calcifications was obtained by Wong et al165
in a numerical simulation of calcifications in the carotid bifurcation. Nicoll and Henein166 went further and proposed
the viewing of the arterial calcification and atherosclerosis as two distinct pathologies, underlining that the reasons for their frequent coexistence are not yet well understood. In a numerical study applying FSI methods, Wenk et al167 showed
that the circumferential stress in the fibrous tissue increases as
the volume fraction of microcalcifications is increased. The local stress can reach a critical threshold when the fibrous cap is thin. Furthermore, they reported that the presence of micro-calcifications significantly influences the distribution of stress by shifting the maximum circumferential stress away from the cap shoulders, where failure is most common. One of the most recent studies on microcalcifications in atherosclerosis was conducted by Maldonado et al,168 and consisted of an
extension of the study conducted by Vengrenyuk et al,112 with
an expanded number of samples. The new results included the definition of criteria for plaque vulnerability, such as the variation of the Young’s modulus of the microcalcification and the surrounding tissue, threshold for stresses that induce rupture, microcalcification size, and clustering. In addition, they indicated that rupture is not associated with debonding around calcification, as previously proposed, but seems to be more related to the explosive growth of the small voids in the tissue in the vicinity of small microcalcification clusters.
Finally, calcifications are commonly found in athero-sclerosis, but their distribution depends on their position in the arterial tree. In a recent study, Heymann et al,169 using
endarterectomy material from human subjects, showed that calcifications are more prone to appear in femoral than in carotid plaques.
Altogether, these studies underline the complex relation between plaque rupture and microcalcifications. Further investigations seem to be necessary to elucidate this relationship.
Soft plaques: hemorrhage and stress
It was shown a few years ago that intraplaque hemorrhages played a role in the destabilization and the progression of atherosclerotic plaques.170,171 Concerning the mechanical
Dovepress Evolution and rupture of vulnerable plaques
ChronoPhysiology and Therapy downloaded from https://www.dovepress.com/ by 147.127.33.113 on 27-Apr-2018