O
pen
A
rchive
T
OULOUSE
A
rchive
O
uverte (
OATAO
)
OATAO is an open access repository that collects the work of Toulouse researchers and
makes it freely available over the web where possible.
This is an author-deposited version published in :
http://oatao.univ-toulouse.fr/
Eprints ID : 10196
To link to this article : DOI:10.1007/s10841-012-9489-9
URL :
http://dx.doi.org/10.1007/s10841-012-9489-9
To cite this version : Ricouart, Francine and Céréghino, Régis and Gers, Charles and Winterton,
Peter and Legal, Luc Influence of fire prevention management strategies on the diversity of butterfly
fauna in the eastern Pyrenees. (2013) Journal of Insect Conservation, vol. 17 (n° 1). pp. 95-111.
ISSN 1366-638X
Any correspondance concerning this service should be sent to the repository
administrator:
[email protected]
Influence of fire prevention management strategies
on the diversity of butterfly fauna in the eastern Pyrenees
Francine Ricouart • Regis Cereghino · Charles Gers • Peter Winterton • Luc Legal
Abstract Fire prevention management is becoming a necessity in many Mediterranean locations to regulate fire of natural or human origin. However, very few studies have determined the real effects of the strategies adopted on local fauna. Butterfties are sensitive to local changes and they can thus serve as indicators of environmental changes. Three different types of fire prevention management approaches in three different localities in the Eastern Pyrenees (France) were performed and the butterfly community composition was investigated. We show that of the 80 species of but-terflies observed, 36 % can be considered as biological markers. An original objective treatment of data using hierarchical distance analysis combined with a neural network analysis (Self-Organizing Maps) was applied in this study. Our conclusions are that the overall number of species is maintained independently of the fire prevention type but that sorne important changes are observed among butterfly communities, with a clear reduction of the nom-bers of endemic/specialized species in favour of generalist ones for the two most drastic fire prevention management approaches studied here. The influence of such approaches is
F. Ricouart
Laboratoire GEODE UMR 5602, CNRS-Université Toulouse Il, Maison de la Recherche, 5 allee Antonio Machado, 31058 Toulouse Cedex 9, France
e-mail: [email protected]
R. Cereghino · C. Gers · L. Legal (1:8J)
ECOLAB UMR 5245., Bâtiment IVR3., CNRS-Université Paul Sabatier, 118, Route de Narbonne, 31062 Toulouse Cedex 9, France
e-mail: legal @cict.fr
P. Winterton
Université Paul Sabatier, 118, Route de Narbonne, 31062 Toulouse Cedex 9, France
discussed on the basis of the conservation of Mediterranean species of Lepidoptera.
Keywords Lepidoptera · Biological indicators · Fire cuts management · Pyrenees
Introduction
A major risk for Mediterranean forests is fires of human origin. On average, 30,000 ha/year hum in the Mediterra-nean region of France. For instance, 45,600 ha have bumed during the last 30 years in the Département of Pyrenées Orientales alone (0.8 % of the total surface area; from Promethee database: www.promethee.com).
Many management policies have been applied to protect endangered biota from fire, among which partial or undergrowth clearing is currently the preferred technique, and is chosen for most slope orientations, and prevailing winds, etc. Depending on how drastic the clearing is, such policies result in changes in flora and the thus in the associated fauna, but have been proved to reduce the risk of complete destruction of vast areas (Ricouart 2005; Quartau 2009).
Many insects have already been used as ecological indi-cators (Kimberling et al. 2001; Paoletti 1999) including Coleoptera (Bohac 1999), ants (King et al. 1998; Labry de Bruyn 1999), grasshoppers (Andersen et al. 2001; Zschokke et al. 2000), Diptera (Frouz 1999) and Syrphidae (Som-maggio 1999; Speight et al. 2002). Resilience of the various insects to fire events (whether natural or provoked) is notably variable, but most can rebuild their initial population levels a few years after a total hum of the area (Braby 2010; Warren et al. 1987). In sorne specifie cases, fires can even be a necessity to maintain populations of endangered species by
renewing the host-plant population (Warren et al. 1987). Anyway, most of time, the effects are deleterious for the specialized species but neutra! to beneficiai for generalists (Powell et al. 2007; Swengel and Schicht 2011).
Lepidoptera were not included among the insects first used as indicators. lt was generally considered, as a first approximation, that due to their ability to fly, they are not sufficiently specifie to act as indicators of perturbations. However, many field studies (Erhardt 1985; Oostermeijer and van Swaay 1998; Thomas and Hanski 1997; Thomas and Harrison 1992) oppose this view, showing a high specificity of these insects for certain micro-habitats or anthropogenically disturbed areas (Luque et al. 2007, 2009; Van Halder et al. 2011). Furthermore, butterflies and moths have one of the highest sensitivities to rapidly changing environmental conditions (New 1997). Anyway as recently demonstrated by Rosin et al. (2011), this sensitivity and specificity is highly variable among Lepidoptera species even belonging to the same genus.
In order to provide a critical appraisal of the use of adult Lepidoptera as biological indicators in the special context of fire prevention management in the Eastern Pyrenees, we used a novel strategy. First, we determined whether, among the species encountered in this region, sorne possess a specificity to a certain type of habitat. An original approach based on a hierarchical distance analysis was tested. Then, we checked the specificity of distribution among the study sites and for different types of tire prevention managements on the Lepidoptera. To do this, a neural network model was applied. Finally, we determined whether Lepidoptera spe-cies groupings occurred, depending on the type of fire prevention management. Distance treatment was used for this step. Based on these three conditions, we discuss the relevance of the use of adult butterflies as markers of an-thropogenically disturbed areas to evaluate the effects of fire prevention management strategies on the Lepidopteran fauna. In conclusion, we measured the balance between fire prevention management and the impact on the diversity of Lepidoptera.
Materials and methods Localities studied
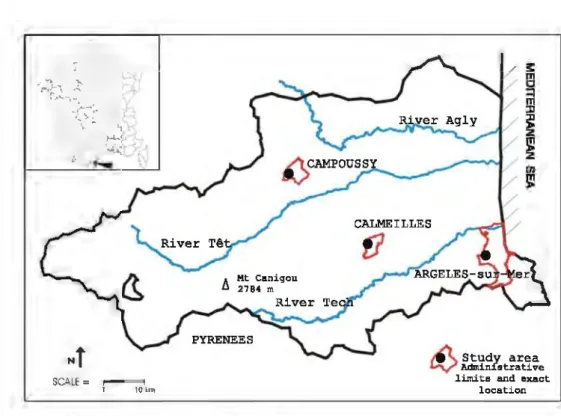
The three study sites were situated in the Département of
Pyrénées Orientales (Southem France; Fig. 1). The local-ities (Argeles-sur-mer ARG, Calmeilles CAL, Campoussy CAM) were chosen to compare different types of Medi-terranean habitat (Table 1).
Argeles and Calmeilles are typically Mediterranean locations, but the former (ARG) is composed more of open fieldlshrubs while the latter is dominated by shrubs/maquis
and therefore does not experience the same extremes of beat. The third locality (CAM) is an open field in a Med-iterranean mountainous location much cooler than the other two locations.
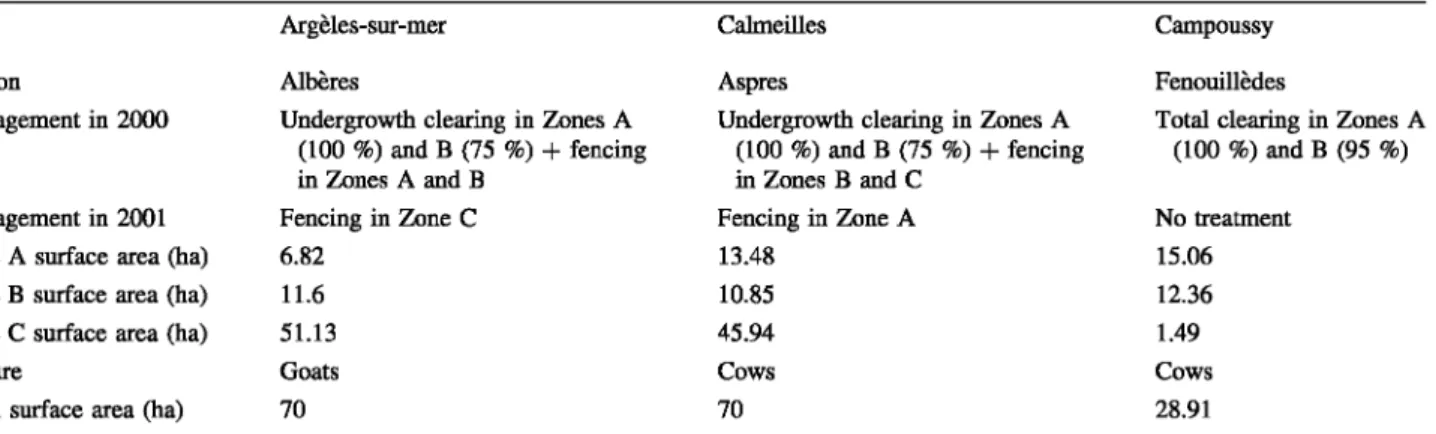
Each locality was divided into three sub-localities depending on the type of tire protection management sys-tem adopted (Table 2). The management actions were carried out during the winter of 1999/2000. Our study then started the tirst year after implementation of the new management approaches. Note that for CAM, virtually no trees were present before the management strategy, meaning that no, or few differences, existed between Zone A and Zone B (Zone C was also accidentally subjected to this management strategy). Fences were placed around the study zones to avoid cattle from biasing the protocol.
Zone A: This zone class was totally cleared of vegeta-tion with on1y the herbaceous level remaining. The goal of this drastic treatment was to ensure that no bumable material is present and to provide safe refuges for firemen if a tire does occur.
Zone B: The treatment of this type of zone consists main1y in removing bushes (minimum: 2/3 of the zone) while the trees are kept. As bushes represent the main source of combustible material, this treatment is assumed to limit tires in such zones.
Zone C: The treatment of type C zones consists only of placing grazing animais in the area (goats or cows, depending on the location). Zones C are thus considered as "sub natural" but with herbivory over-pressure. As live-stock will eat mainly the herbaceous and shrub level, the expectation is that any tires will be slowed.
Butterfly sampling
Samples were collected 5 times a year: once a month from May to September. The study covered two successive years: 2000 and 2001. Butterflies were collected with standard Lepidoptera band nets (Sticks 1.5 rn, diameter 40 cm) in a single plot per zone and per site of 1 ha (the largest area available in ali the studied zones without approaching the edge). The three locations were sampled during the same week, taking care that weather conditions were similar. Two people performed the sampling for 90 min at every location and sub-location. For each loca-tion, samples were collected on the same day, to avoid variations due to weather conditions. Except for a few species, none bad a strict circadian rhythm that would make their densities and occurrences vary within the day. The insects were then released, or killed for identification using KCN jars (mainly for Lycaenidae and Hesperiidae) and/or for further molecular analysis studies. Identification was performed using various field guides (Geiger 1987; Leraut 1992; Tolman and Lewington 1999). For a
Fig. 1 Map of the studied
locaticms includiDg main rivers
SCALE
=
10tm CALMEILLESfJ
~
Studv areaV!\?
Admin!strativelimita and exact location
Table 1 Geograpbical, climatological and ecological tœitll of the tine stwiy sites Argelês-sur-mer
CoordiDales
Latitude 42°3l'N
Longitude 3°318
Altitude (in m) 200-SOO
Geology Graaitoi.des, gneiss
Average 8DilWil temperature 13 "C Precipitaticmlyear (in mm) 800-900
DomiDant trees QueTCUI su#Hr Q. ilex Dominant sbrubs EricCI œboreQ
Cisttu monspelien~is Ulex ptiTVijlorwr
few species such as Melitaeini and
Leptidea reali,
identi.ty was confirmed by preparing genitalia. For this Iast tribe, we based our nomenclature on that of Zimmermann et al.(1999). Naming follows the proposais of www.Ieps.it.
Data analysis
Distance method
An original approach of lùerarchical classiication was performed. By using the different ecological traits of each of the species found. we assimilated them to characters to
achieve
a
network. of inter-relationships between taxa.Beiog convinced that such rough groupings (even though
Calmeilles Campoussy
42"32'N 42°4l'N
2°42'8 2~18
400-600 800-900
Schist Graniœs, prolÙlDity of limestoae 12 "C 10
oc
900-1,000 1,000-1.100
Qwrctd Ua l'nl1lus spltuna
Q. pubescetf8 Qwrctd pubescetf8 Erial cvborea Cist#s lmmfoliu
CalJma 'IIUlgtJris Rubuasp
Genista pilo.sa SQrot/rt.mmu ICOJXITÎUS
we checked for the presence of a potential host-plant) are
often invalid (Shreeve et al. 2001; Soberon and Townsend-Peterson
2005
),
this preiiminary analysis should detect if,due to local conditions in our sampling zones, some species are miss-placed when analysing distribution patterns.
The species were classified according to two main eoological criteria: the openness of the terrain and humidity factors. For both these main criteria three sub-categories
were defined.
For terrain openness,
a
lùerarchical gradient wasdefined:
1.
Orassland, open
fieldwithout
shrubsover 30 cm.
2. Shrub
areas,
up to the forestzone,
where treesTable 2 Description and treatment characteristics of the three study sites
Argèles-sur-mer
Region Albères
Management in 2000 Undergrowth clearing in Zones A (100 %) and B (75 %)
+
fencing in Zones A and BManagement in 2001 Fencing in Zone C Zone A surface area (ha) 6.82
Zone B surface area (ha) 11.6 Zone C surface area (ha) 51.13
Pasture Goats
Total surface area (ha) 70
See text to explain the srnall surface of Zone C Campoussy
3. Forest zones including edges (mainly composed of shrubs).
Humidity conditions were divided into the three fol-lowing categories: xeric, mesophilic and hydrophilic.
Many species have a potential habitat covering two or more of our categories (according to various field guides and our own experience). However, most are observed to occur preferentially in one habitat type. Note that, sorne species which live strictly in dry habitats in Northem Europe prefer relatively cool damp conditions in Mediter-ranean areas. In our ecological matrix, we coded: 0 for absent or very rare, 1 for regular occurrence in a biota and 2 for a clear preference.
Distance trees were dealt with using the same principle except that we took into account the presence (1)/absence (0) of species in each location studied. Only species forming a potential population were included in the final analysis (at least two specimens sampled and the presence of a potential host plant, data not shown).
All analyses were performed using Paup* 4.0b10 soft-ware (Swofford 2002). All heuristic searches for optimal trees were carried out by TBR (tree-bisection-reconnec-tion) branch swapping. Negative branch lengths were allowed, but set to zero for tree-score calculations. The steepest descent option was not in effect. Distance mea-surement used mean character difference. Starting tree(s) were obtained by neighbour joining.
As our intention was not to perform a phylogenetic clas-sification, we decided not to include any outgroups in our data set. The distance trees obtained are represented umooted. When multiple sub-equal trees were found, a Majority Rule (50 %) consensus tree was calculated. Bootstrap values were not calculated as no information was available from the lit-erature to judge if such treatment was relevant using ecolog-ical characters and furthermore because we did not perform a character-state treatment (parsimony). A pattern code was attributed to each species depending on distribution type and
Calmeilles Campoussy
Aspres Fenouillèdes
Undergrowth clearing in Zones A Total clearing in Zones A (100 %) and B (75 %)
+
fencing (100 %) and B (95 %) in Zones B and CFencing in Zone A No treatment
13.48 15.06
10.85 12.36
45.94 1.49
Cows Cows
70 28.91
place on the distance trees. The code was determined from the neural network results.
Considering the specificity per zone inside locations, we checked if specialized species were more represented in conserved areas ( corresponding to Zones C) rather than in managed areas (Zones A and B). Species specifie to one zone or mainly found in one zone are expected to be in the same clade. Species encountered in Zone C are circled.
Modelling species assemblages
Inspired by the structure and the mechanism of the human brain, Artificial Neural Networks (ANNs) provide conve-nient tools to maximize the information extracted from "simple" presence-absence data (Lek and Guégan 2000). The Self-Organizing Map (SOM, unsupervised neural network, Kohonen 2001) performs a topology-preserving projection of the input data onto regular two-dimensional space. In the output layer of the network the neurons act as virtual samples and approximate the probability density function of the input data. Therefore, using a binary dataset of species occurrences, the SOM calculates continuous quantitative values which vary between 0 and 1, so that the occurrence probability of any species in a given area, in the form of a connection intensity (visualized in gray shades), can be visualized on a virtual map. Additionally, the SOM algorithm averages the input dataset using weight vectors and thus removes noise. These features were relevant in our study because we analysed a binary dataset with many zeroes. The SOM Toolbox (version 2) for Matlab® devel-oped by the Laboratory of Information and Computer Science at the Helsinki University of Technology (http:// www.cis.hut.fi/projects/somtoolboxl) was used (see Vesanto et al. 1999 for practical instructions).
The structure of the SOM for our study consisted of two layers of neurons connected by weights (i.e., connection intensities): the input layer was composed of 80 neurons
(one per species) connected to the 18 samples (3 sites x 3 zones x 2 years), the output layer was made up of 21 neurons (visualized as hexagonal cells) organized in an array with 7 rows and 3 columns. In the output layer, the neurons act as virtual sites and approximate the probability density function of the input data. The occurrence proba-bility of each species in a given area in the form of the connection intensity was visualized on the SOM map in grey scale, and therefore allowed us to predict the occur-rence probability of each species in the various geographie areas. The SOM algorithm is an unsupervised learning procedure which can be summarised as follows:
• The virtual sites are initialised with random samples drawn from the input data set.
• They are updated in an iterative way:
• A sample unit is randomly chosen as an input unit. • The Euclidean distance between this sample unit
and every virtual site is computed.
• The virtual site closest to the input is selected and called 'best matching unit' (BMU).
• The BMU and its neighbours are moved a bit towards the input unit.
• Training was broken down into two parts previously defined in Lek and Guégan (2000):
• Ordering phase (the 2,000 first steps): when this first phase takes place, the sites are highly modified in a wide neighbourhood of the BMU.
• Tuning phase (75,000 steps): during this phase, only the virtual sites adjacent to the BMU are slightly modified. The network was trained with different map sizes (from 10 to 200 units), and the optimum map size was chosen based on local minimum values for quantization and topographie errors (see Céréghino and Park (2009) for practical considerations). Quantization error (QE) is the average distance between each data vector and its BMU and, thus, measures map resolution (Kohonen 2001). Topographie error (TE) measures map quality (i.e., to assess whether the map has been properly trained), it rep-resents the proportion of a11 data vectors for which 1st and 2nd BMUs are not adjacent, and is thus used for the measurement of topology preservation. The total of 21 output neurons retained for this study fits the heuristic rule proposed by Vesanto and Alhoniemi (2000) who reported that the optimal number of map units is close toC =
5-Jn,
where n is the number of samples. 18 samples were clas-sified on the basis of eight environmental variables. At the end of the learning process, each sample was set in the corresponding hexagon of the SOM. Neurons that are neighbours on the grid are expected to represent neigh-bouring clusters of samples; consequently, samples sepa-rated by a large distance from each other, according tospecies assemblages, are expected to be distant in the output space.
Ward's algorithm was applied to the weight vectors of the 21 neurons in order to divide the SOM units (hexagons) into clusters.
Analysis and interpretation
The occurrence probability of each species in a given area in the form of the connection intensity was visualized on the SOM map (in gray scale), and therefore allowed us to predict the occurrence probability of each species in areas (i.e., subsets of sites, or clusters) where they were not consistently collected during the sampling. In other words, the patterns of distribution for each Lepidoptera species among the various sites become apparent by superimposing the various species maps on the clustering of sites observed in the SOM map. This treatment allowed us to determine qualitatively and quantitatively (see Fig. 3b) the specificity of distribution of each species among the three Mediterranean locations studied (Arg: dry and low elevation, Cal: cooler and low elevation, CAM: cooler and higher elevation). A completely gen-eralist species will occupy ail the Kohonen map and with an almost regular probability of presence (scale of grays), and for example a specialized species for low elevation open field Mediterranean biota (Type Argeles) will show only a few hexagons filled with a high probability (black) on the bottom right of the SOM grid. These two extreme situations never strictly occurred, but sorne dominant patterns are visible which allowed us to qualify the specificity of each species sampled, see Fig. 3c where a few examples of the different situations are shown.
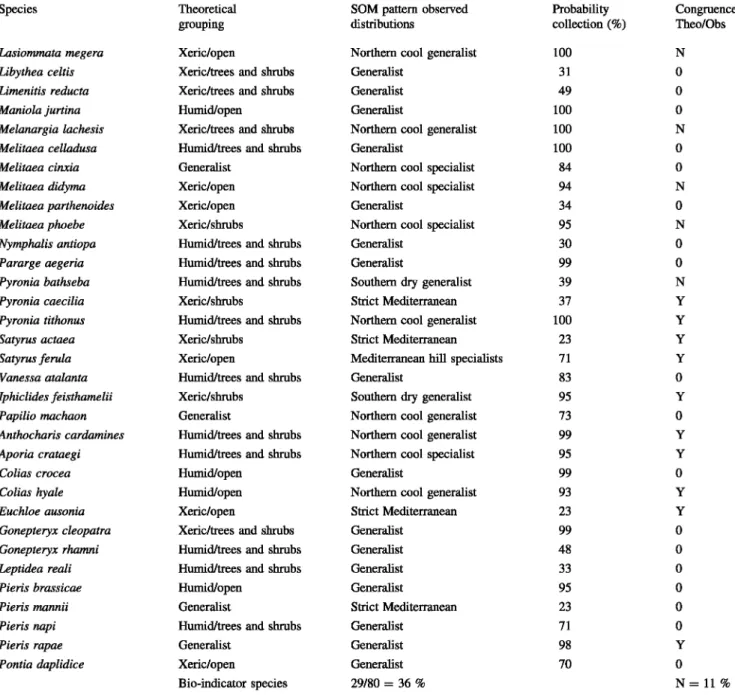
A comparison was performed between the theoretical habitat of each species and results obtained using the SOM approach in order to test our a priori hypothesise. When congruence was found: we noted Y; when congruence was not found: N and finally, when a species is considered as generalist for one approach (theoretical or observed) and considered as specialist for the other, we noted: O.
Results
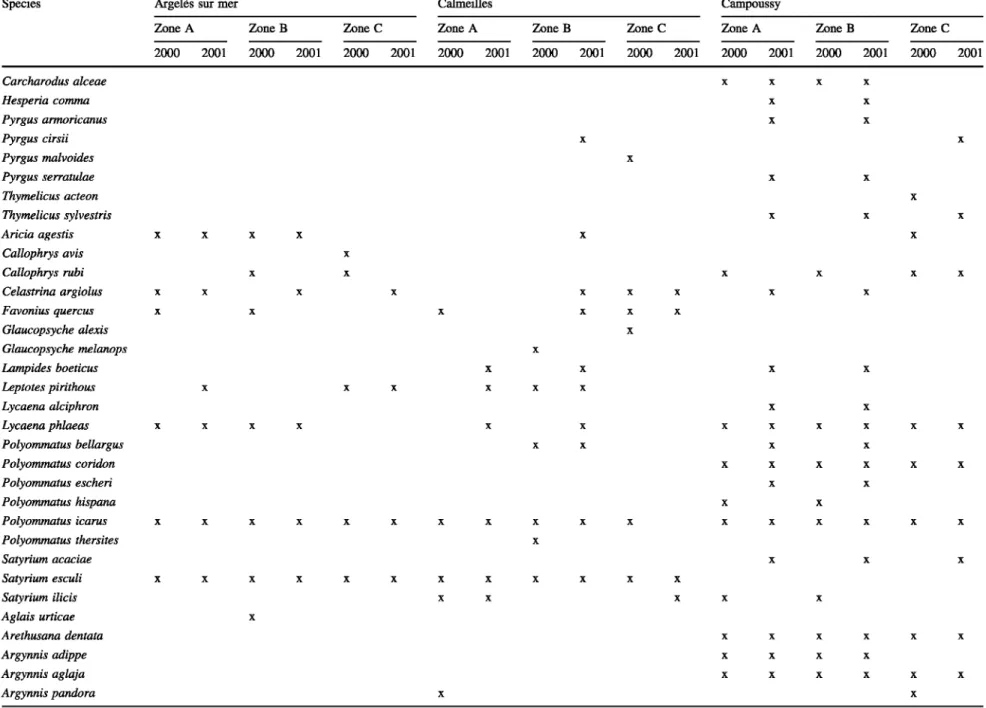
The species of Rhopalocera (including Hesperiidae) col-lected in 2000 and in 2001 are presented in Table 3 with their respective occurrences by zone.
The three localities were not equivalent in numbers of species: we recorded 37 species in Argelès (ARG); 47 in Calmeilles (CAL) and 57 in Campoussy (CAM) i.e. there were large differences between the three study zones.
Using data from the literature (Geiger 1987; Lafranchis 2000) and persona! observations in other regions, a first
Table 3 Samples collected at the three study sites
Species Argelès sur mer Calmeilles Campoussy
Zone A ZoneB Zonee Zone A ZoneB Zone C Zone A Zone B Zone C
2000 2001 2000 2001 2000 2001 2000 2001 2000 2001 2000 2001 2000 2001 2000 2001 2000 2001 Carcharodus alceae x x x x Hesperia comma x x Pyrgus armoricanus x x Pyrgus cirsii x x Pyrgus malvoides x Pyrgus serratulae x x Thymelicus acteon x Thymelicus sylvestris x x x Aricia agestis x x x x x x Callophrys avis x Callophrys rubi x x x x x x Celastrina argiolus x x x x x x x x x Favonius quercus x x x x x x Glaucopsyche alexis x Glaucopsyche melanops x Lampides boeticus x x x x Leptotes pirithous x x x x x x Lycaena alciphron x x Lycaena phlaeas x x x x x x x x x x x x Polyommatus bellargus x x x x Polyommatus coridon x x x x x x Polyommatus escheri x x Polyommatus hispana x x Polyommatus icarus x x x x x x x x x x x x x x x x x Polyommatus thersites x Satyrium acaciae x x x Satyrium esculi x x x x x x x x x x x x Satyrium ilicis x x x x x Aglais urticae x Arethusana dentata x x x x x x Argynnis adippe x x x x Argynnis aglaja x x x x x x Argynnis pandora x x
Table 3 continued Species Argynnis paphia Brintesia ciree Charaxes jasius Chazara briseis Clossiana dia Coenonympha arcania Coenonympha dorus Coenonympha pamphilus Cynthia cardui Hipparchia alcyone Hipparchia fidia Hipparchia semele Hipparchia statilinus Issoria lathonia Lasiommata megera Libythea celtis Limenitis reducta Maniola jurtina Melanargia lachesis Melitaea celladusa Melitaea cinxia Melitaea didyma Melitaea parthenoides Melitaea phoebe Nymphalis antiopa Pararge aegeria Pyronia bathseba Pyronia caecilia Pyronia tithonus Satyrus actaea Satyrus ferula Vanessa atalanta lphiclides feisthamelii
Argelès sur mer Zone A 2000 2001 x x x x x x x x x x x x x x Calmeilles ZoneB Zonee Zone A 2000 2001 2000 2001 2000 2001 x x x x x x x x x x x x x x x x x x x x x x x x x x x x x x x x x x x x x x x x x x x x x x x Campoussy
ZoneB Zone C Zone A Zone B Zone C 2000 2001 2000 2001 2000 2001 2000 2001 2000 2001 x x x x x x x x x x x x x x x x x x x x x x x x x x x x x x x x x x x x x x x x x x x x x x x x x x x x x x x x x x x x x x x x x x x x x x x x x x x x x x x x x x x x x x x x x x x x x x x x x x x x x x x x x x x x x x x x x x x x x x x x x x x x x x x x x x x x x x x x x x x x x x x x x x x x x
Table 3 continued
Species Argelès sur mer Calmeilles Campoussy
Zone A ZoneB Zonee Zone A ZoneB Zone C Zone A Zone B Zone C 2000 2001 2000 2001 2000 2001 2000 2001 2000 2001 2000 2001 2000 2001 2000 2001 2000 2001 Papilio machaon x x x x x x Anthocharis cardamines x x x x x x x Aporia crataegi x x x x x Colias crocea x x x x x x x x x x x x x Colias hyale x x x x Euchloe ausonia x Gonepteryx cleopatra x x x x x x x x x x x x x x Gonepteryx rhamni x x Leptidea reali x x Pieris brassicae x x x x x x x x x x x x x x Pieris mannii x Pieris napi x x x x x x x Pieris rapae x x x x x x x x x x x x x Pontia daplidice x x x x x Number of species 23 18 25 30 31 31 50 50 41
Occurrences d.epending on treatment zone and year
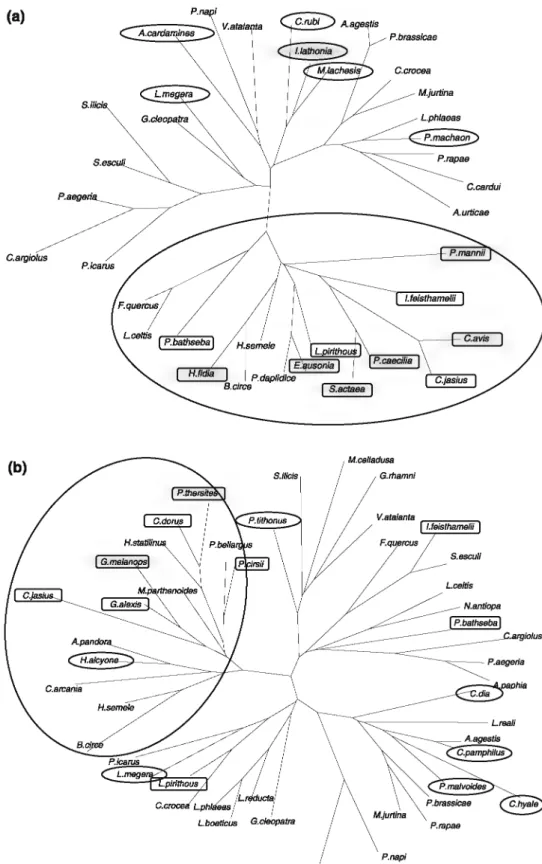
F1g. 2 Distance tree (Hcuristic search): Tbooretical functionaJ. groups and clusiftcation depending on preference of biota of Lepidoptera according to the litentuœ (see text) and persona]. observations.
D
xericlopen rather than shrubs,D
xrric/shrubs,D
xericltrees and shrubs,D
gem:ralist.
D
lwmidltrees and sbrubs,D
bumidlopengrouping of species was performed and some functional groups were defined independently of coll.ection locations.
The 80 species collected were classified depending on their theoretical ocological constraints (Fig. 2; Table 4).
Func-tional groups are defincd and no species were found to be
outside or isolated from their respective theoretical group.
In particular, there is a clear separation between xeric and
mesolbydrophilic species.
Study by site
Using the SOM, we checlœd what the groupings were for
the sampling sites independently of years, on the basis of
Lepidoptera species occurrences.
A fust result i.s that main associations are by site, but not
by fire prevention management treabnent (Fig. 3a). The
locality of Campoussy (CAM) is notably different from the two others. Moreover, except for calBOl (Calmeilles, Zone B, year 2001) the two sites Calmeilles and Argeles are not mixed.. These last two sites are warmer and are also situated at lower elevations than Campoussy (Table 1).
We may group CAL
+
CAM in terms of coolness,CAL
+
ARG for low elevation Mediterranean biota andCAM
+
ARG for being more open fields (Fig. 3a). Except for Campoussy, but due to local conditions andbecause the local farmer was not applying the fire
pre..
vention procedure strictly (see "Materials and methods" section) no groupings by zones or year emerged.
Distribution specificity of Lepidoptera
The SOM treatment shows the levet of specificity of each
species for a type of location and/or a specifie type of fire
prevention management (Fig. 3b). In our study, 36% (29 out of 80) of the butterllies encountered showed habitat
specificity in the field and additively 23 % (18 out of 80) of
species tended to occupy just one type of habitat. Finally, for 41 % (33 out of 80) we were unable to assign a special type of habitat in the limited context of the locations studied and considering the resolution of our treatment.
A selection of the different patterns encountered is given
in Fig. 3b.
The first line of Fig. 3b represents generalist species, the
Table 4 Theoretical versus observed distributions (SOM analysis) of the 80 species contacted
Species Theoretical SOM pattern observed Probability Congruence
grouping distributions collection(%) Theo/Obs
Carcharodus alceae Humid/open Northem cool specialist 73 y
Hesperia comma Humid/open Northem cool specialist 63 y
Pyrgus armoricanus Humid/open Northem cool specialist 63 y
Pyrgus cirsii Xeric/open Southem dry generalist 23 y
Pyrgus malvoides Humid/open Northem cool generalist 34 y
Pyrgus serratulae Humid/open Northem cool specialist 63 y
Thymelicus acteon Humid/open Northem cool specialist 34 y
Thymelicus sylvestris Humid/open Northem cool specialist 78 y
Aricia agestis Humid/open Generalist 81 0
Callophrys avis Xeric/shrubs Strict Mediterranean 23 y
Callophrys rubi Xeric/trees and shrubs Northem cool generalist 97 N
Celastrina argiolus Humid/trees and shrubs Generalist 77 0
Favonius quercus Xeric/trees and shrubs Generalist 71 0
Glaucopsyche alexis Xeric/shrubs Southem dry generalist 30 y
Glaucopsyche melanops Xeric/shrubs Strict Mediterranean 24 y
Lampides boeticus Generalist Generalist 70 y
Leptotes pirithous Xeric/open Southem dry generalist 71 y
Lycaena alciphron Xeric/open Mediterranean hill specialists 63 y
Lycaena phlaeas Generalist Generalist 100 y
Polyommatus bellargus Xeric/open Generalist 70 0
Polyommatus coridon Xeric/open Northem cool specialist 99 N
Polyommatus escheri Generalist Mediterranean hill specialists 63 0
Polyommatus hispana Xeric/open Mediterranean hill specialists 71 y
Polyommatus icarus Humid/open Generalist 100 y
Polyommatus thersites Xeric/open Strict Mediterranean 24 y
Satyrium acaciae Humid/trees and shrubs Northem cool specialist 78 y
Satyrium esculi Xeric/shrubs Generalist 100 0
Satyrium ilicis Humid/trees and shrubs Generalist 71 0
Aglais urticae Generalist Generalist 23 0
Arethusana dentata Xeric/open Mediterranean hill specialists 99 y
Argynnis adippe Humid/trees and shrubs Northem cool specialist 73 y
Argynnis aglaja Humid/trees and shrubs Northem cool specialist 99 y
Argynnis pandora Xeric/trees and shrubs Generalist 34 0
Argynnis paphia Humid/trees and shrubs Generalist 90 0
Brintesia ciree Xeric/trees and shrubs Generalist 99 0
Charaxes jasius Xeric/shrubs Southem dry generalist 53 y
Chazara briseis Xeric/open Mediterranean hill specialists 63 y
Clossiana dia Humid/open Northem cool generalist 99 y
Coenonympha arcania Xeric/trees and shrubs Generalist 43 0
Coenonympha dorus Xeric/open Southem dry generalist 60 y
Coenonympha pamphilus Humid/open Northem cool generalist 99 y
Cynthia cardui Generalist Generalist 95 y
Hipparchia alcyone Xeric/trees and shrubs Northem cool generalist 99 N
Hipparchia fidia Xeric/trees and shrubs Strict Mediterranean 23 y
Hipparchia semele Xeric/trees and shrubs Generalist 95 0
Hipparchia statilinus Xeric/open Generalist 95 0
Table 4 continued
Species Theoretical SOM pattern observed Probability Congruence
grouping distributions collection (%) Theo/Obs
Lasiommata megera Xeric/open Northem cool generalist 100 N
Libythea celtis Xeric/trees and sbrubs Generalist 31 0
Limenitis reducta Xeric/trees and sbrubs Generalist 49 0
Maniola jurtina Humid/open Generalist 100 0
Melanargia lachesis Xeric/trees and sbrubs Northem cool generalist 100 N
Melitaea celladusa Humid/trees and sbrubs Generalist 100 0
Melitaea cinxia Generalist Northem cool specialist 84 0
Melitaea didyma Xeric/open Northem cool specialist 94 N
Melitaea parthenoides Xeric/open Generalist 34 0
Melitaea phoebe Xeric/sbrubs Northem cool specialist 95 N
Nymphalis antiopa Humid/trees and sbrubs Generalist 30 0
Pararge aegeria Humid/trees and sbrubs Generalist 99 0
Pyronia bathseba Humid/trees and sbrubs Southem dry generalist 39 N
Pyronia caecilia Xeric/sbrubs Strict Mediterranean 37 y
Pyronia tithonus Humid/trees and sbrubs Northem cool generalist 100 y
Satyrus actaea Xeric/sbrubs Strict Mediterranean 23 y
Satyrus ferula Xeric/open Mediterranean hill specialists 71 y
Vanessa atalanta Humid/trees and sbrubs Generalist 83 0
lphiclides feisthamelii Xeric/sbrubs Southem dry generalist 95 y
Papilio machaon Generalist Northem cool generalist 73 0
Anthocharis cardamines Humid/trees and sbrubs Northem cool generalist 99 y
Aporia crataegi Humid/trees and sbrubs Northem cool specialist 95 y
Colias crocea Humid/open Generalist 99 0
Colias hyale Humid/open Northem cool generalist 93 y
Euchloe ausonia Xeric/open Strict Mediterranean 23 y
Gonepteryx cleopatra Xeric/trees and sbrubs Generalist 99 0
Gonepteryx rhamni Humid/trees and sbrubs Generalist 48 0
Leptidea reali Humid/trees and sbrubs Generalist 33 0
Pieris brassicae Humid/open Generalist 95 0
Pieris mannii Generalist Strict Mediterranean 23 0
Pieris napi Humid/trees and sbrubs Generalist 71 0
Pieris rapae Generalist Generalist 98 y
Pontia daplidice Xeric/open Generalist 70 0
Bio-indicator species 29/80 = 36% N=ll%
Probabilities of collection given in %. Evaluation of the congruence theoreticallobserved
Evaluation of the congruence: Y (yes), N (no) 9/80 species, 0: compatible but not positive or negative (see also "Results" section)
napi and Pieris rapae). Note that the maximum probability of presence of collection for P. napi was lower than P. rapae (71 vs. 98 %, respectively). The third, Antho-charis cardamines, occurred dominantly in the cooler area which is logical knowing that this species possesses its main distribution in Northem Europe. In opposition, the fourth species Leptotes pirithous is a Mediterranean species which is less common in cool areas even though it is widely distributed in the region studied (partially migratory species).
The second line of Fig. 3b can be separated into two groups. Species whose main distribution is in the North of Europe (species at the southem limit of their distribution e.g. Aporia crataegi and Carcharodus alceae) and species highly specialized for hills/mountainous Mediterranean biota (Satyrus feru/a and Polyommatus hispana). The pat-tern of the Kohonen map is of the same type in both these cases (only the upper part of the grid filled) but the spe-cialized Mediterranean mountain species show less cover-ing of the SOM map.
(a)
(c)
!'~MD nep/ Pilllflll~m
0.713 0.88 0.402 0.853 o.oeœ 0.32i ~ 0.73o3 0.474 0.388 0 0The third line of Fig. 3b is composed of strictly Mecli-terranean species (Giaucopsyche melanops, Euchloe
ausonia, Satyrus actea. Pieris mannii).
ltiB
notable tbat the probability of collection was much lower tban for gener-alist species indicative of the endangered status of these species (average= 23.3 %). (b)!
}
... A 16 8 9 15c
3 10 17 11 18w
~:
}
... D 13 21 _ E 6 7 4 5 121
,._
,...,_. 1
1
0.701 0.366 01»:
w ,_ w
'"'1&~
OOY 0 0--&'11188
l.t31
0-23li
0.115 0.115 0 0 0.38 7 0Finally the fourth line shows the speci.ficities of the three
European
Pyronia
species (P.titlwnus,
P.bathseba
andP.
caecilia). Pyronia tithonus
presents an ample distribu-tion in nœtbem Europe and was mainly found in the coolest location.Pyronia bathseba
is a southern species but prefers coole.r humid zones. Finally P.caecilia
is a strictFig. 3 a Kohonen (SOM) map of the three fire prevention manage-ments for the three studied sites for 2 years depending on occurrences of Lepidoptera species and variations of abiotic conditions. Gradients:
vertical; from white (hot) to dark gray (cooler), horizontal from dotted (fresh/humid) to no dots (dry). Circled in white are numbers
corresponding to those indicated in b (see also Table 3 for more details). b Clustering of the 21 SOM neurons using Ward's algorithms. Numbers as in a (circled in white). Biota specificity of each butterfly species (c) is determined by checking occurrences in the various clusters defined here: A: Mediterranean hill specialist (Neurons 1, 2, 8); B: Northem cool specialist species (Neurons 1, 2, 8, 9, 15, 16); C: Northem cool generalist species (Neurons 1, 2, 8, 9, 15, 16, 3, 10, 17, 11, 18); D: strict Mediterranean species (Neurons 20, 19, 14, 13, 21); E: Southem dry generalist species (Neurons 20, 19, 14, 13, 21, 6, 7, 4, 5, 12). Generalist species are deterrnined when SOM patterns are almost equally distributed between C and E. c Gra-dient analysis of the probability of occurrence of 15 selected butterfly species on the trained SOM, with visualization in shading scale (dark high probability of occurrence, light low probability of occurrence). Each little map is to be compared, or superimposed on the map in a for location. Species name above the map highlighted using symbols: No symbols: generalist species, circled
+
white: Northemcool generalist species, rectangular
+
white: Southem dry generalistspecies, circled
+
gray: Northem cool specialist species, trapezoï-dal+
gray: Mediterranean hill specialists and rectangular+
gray:strict Mediterranean species
Mediterranean species, which occurs only in the driest and warmest locations. This last example illustrates the speci-ficity and the resolution level of our treatment. The prob-ability of collection of the two most restricted species (average
=
37.9 %) was notably lower than for the gen-eralist species (99.8 %).Complete results are given in Table 4 and an evaluation of the congruence between theoretical (results of Fig. 2) and SOM treatment (Fig. 3) was provided.
Note that probability of collection was notably different between generalist and specialized species (Table 4) 80
±
20 versus 63±
35 % even though SD values are high. The values became really low when considering only the strict Mediterranean species with 25±
5 %.Search for functional groups of species
In order to check if species can be grouped depending on their specificity, we built distance trees using the method-ology described in "Materials and methods" section. This original approach provides a per-site image of the associ-ation of species in each locassoci-ation. The trees are a super-imposition of ecological factors (same matrix as the one used to construct Fig. 2) and local occurrences (presence/ absence by zone/year and location; Fig. 3b ).
Except for very few species, separation between cooV
humid areas and hot/dry areas is visible. Grouping by level of openness of the area was also observed.
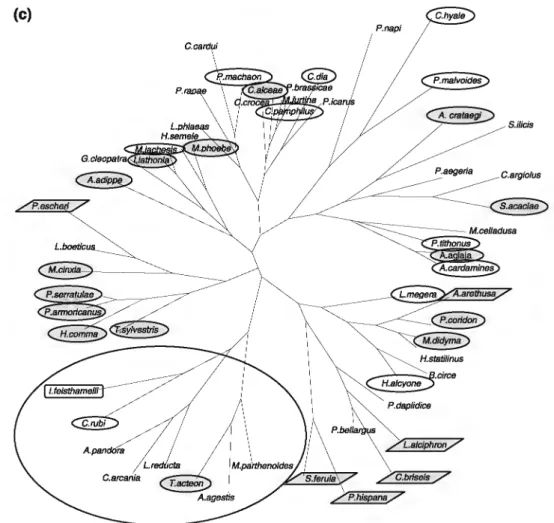
Considering fire prevention management treatments, the only clear results were for the locality of Argelès, most species specialized for dry Mediterranean areas are
grouped in Zone C (circled; Fig. 4a). For the locality of Calmeilles, species encountered in Zone C were mainly thermophilic preferring open or bushy areas but included species with a wide geographical distribution (Fig. 4b ). Finally, even though it is the most diverse location in terms of species number, the locality of Campoussy did not give any significant results and, furthermore, most of the spe-cialized species of mountainous Mediterranean areas (in purple) were absent from Zone C (Fig. 4c).
Discussion
Specificity of Lepidoptera habitat
Sorne Lepidoptera species have been shown to possess high habitat specificity (Geiger 1992; Luque et al. 2007). Cat-erpillars are much more reliable to prove the presence of a population but as one of the aims of our study was to design an approach that non-specialists would be able to follow i.e. the dynamics of butterfly communities and the influence of fire cuts, we preferred to use adults. In any case, the presence of at least one potential host plant was checked for every species (data not shown). Caterpillars possess the main disadvantage of being more difficult to find (sorne live in trees, others are mainly nocturnal) and are, most of time, much more difficult to identify.
Sorne Lepidoptera species were found in the field in full accordance with their theoretical habitat but a certain number were found to be in discordance with it, similar results were pointed out in the South West of France (V an Halder et al. 2011). This was especially true for species found strictly in or on the edge of "maquis" (dense Medi-terranean scrub/woodland in granitic areas) as these species were assumed to be open-field specialists (Glaucopsyche. melanops, Glaucopsyche alexis, Pyrgus cirsii, Euchloe ausonia, and Satyrus actaea). Our interpretation is that these species are the most sensitive to the management of their biota and may survive only in the few open areas close to or in this type of Mediterranean forest. Sorne theoretically open-field species were also found preferentially in the "maquis" such as Thymelicus acteon, Polyommatus ther-sites, Pyrgus malvoides or even Coenonympha arcania, but a more plausible explanation is that these species, widely distributed in Northem Europe, prefer cool refuges in more bushy/forest areas when living in sometimes extremely hot Mediterranean locations (Stefanescu et al. 2004). When comparing species with rather similar ecological demands such as the big Satyrinae (Chazara briseis, Satyrus ferula, Satyrus actaea and Hipparchiafidia), we found that the two with the widest ranges (in France, C. briseis and S. ferula are present in many xeric locations outside the Mediterranean area (Lafranchis 2000)) are less sensitive to management.
Fig. 4 Heuristic distance trees {a) for each of the sites studied
depending on occurrences of species on the three fire prevention management types. a Argelès, b Calmeilles,
c Campoussy. Circled species occurring with preference in Zones "C" when relevant. Each species is highlighted with the corresponding pattern deduced from the SOM treatment
C.argiolus
On the other band, the two strictly Mediterranean species (S. actaea and H. fidia) seem to need the stability of their original biota (none or a type C fire prevention management) to maintain a population.
L.boeffcus G.cleopatra
P.napi C. ui
The total number of species collected in the various zones for each site was fairly stable. Maximum stability was found in Calmeilles where, surprisingly, for both years of collection, we found exactly 30, 31 and 31 species for
Fig. 4 continued {c)
Zones A, B and C respectively. The endemie fauna is perturbed and new, so-called "anthropomorphic" species appear. Most are strictly open field species and live on host-plants favoured by human activity such as Urtica or Brassicaceae.
In the South West of France, Van Halder et al. (2011) found that, for a limited number of butterfly species (23) 12 showed habitat specificity (7 for edges, 5 for inner forest), while 11 were not specifie. Moreover, sorne species which were defined as generalists in our study can become spe-cifie when changing sampling scale (a good example is S. esculi, which was present and common in our three loca-tions, therefore: generalist in our study, but which could be specifie if sorne of our sampling sites were situated outside the Mediterranean region).
Impact of fire prevention management on Lepidoptera
Our distance approach allowed us to present a possible grouping of species. These distance approaches (phenetic) are designed for phylogenetic studies and more recently have been applied to the study of populations using cuticular markers (Roux et al. 2006) but have never been
P.napi
S.ilicis C.argiolus
/L.alciphron/
used with ecological constraints. We attempted to compare our approach with more classical ACP and canonical approaches, but the resolution obtained with such methods was very poor.
Our analysis shows us that on1y when experimental conditions are strictly applied by field managers is it pos-sible to reach interpretable results. In the case of Argelès, fire prevention management was strictly applied under our proposed specifications. In Calmeilles, treatment was well done but Zone B was not in direct contact with the two other zones (500 m away). Finally Zone B of Campoussy was totally cleared (Zone A type treatment) and we man-aged to stop field managers before Zone C was heavily damaged too. A special mention in this locality, as many specialized Mediterranean species prefer open field con-ditions, they are naturally absent from type C Zones.
Such management problems are finally very informative as they show the high sensitivity of our statistical treat-ments to define functional groups. Anyway, there is sorne serious support for the functional groups as our results for the locality of Argelès clearly show that specialized species prefer conserved habitats when available. In the two other locations, sorne specialized species were able to survive
and were found flying in disturbed areas as long as sorne patches of host plants remain.
Fire prevention management therefore favoured sorne generalist species but damaged populations of specifie/ endemie Lepidoptera but also other insects (Fowles et al. 2004, Quartau 2009). However, it seems that the resilience of these insects is high (Fowles et al. 2004; Luque et al. 2007) as shown between our 2 years of collection ( espe-cially clear for CAM). That is why a balance must be drawn between the efficiency of complete cuts ("Zone A" type) to protect Mediterranean forest and long-term dam-age to populations of specialized Lepidoptera (y./ arren et al. 1987) even if such policies show a high level of efficiency in comparable areas (Collins and Stephens 2007). Our approach therefore clearly shows for the first time that, in choosing between the degrees of fire protec-tion afforded by the different types of measure studied here, the degree of disturbance to native fauna should also be taken into account. Although treatments A and B, do not change people's global perception (Ricouart 2005) of the landscape, maintaining the same number of butterflies species in each type of treatment area, they significantly reduce populations of specialized and endemie insects of the zone to be protected from tires. The present results involving granitic areas are furthermore congruent with sorne studies done in calcareous areas where persistence of sheltered areas (our type C) favoured endemic/specialized species while opening of the forest and colonization by grasses (our types A and B) represents a negative factor which favoured generalistlmigrating species (Rosin et al. 2011). Therefore, from an angle of conservation of ende-mie/specifie species our results indicate that the type C management approach should be favoured whenever pos-sible mainly for species naturally living in shrub/forest bi ota.
Acknowledgments Many thanks to the two laboratories in which this study was done: GEODE directed by Jean-Paul Métailié and ECOLAB directed during this study by Eric Chauvet.
References
Andersen AN, Ludwig JA, Lowe LM, Rentz DCF (2001) Grasshop-per biodiversity and bioindicators in Australian tropical savan-nas: Responses to disturbance in Kakadu National Park. Aus Ecol 26:213-222
Bohac J (1999) Staphylinid beetles as bioindicators. Invertebrate biodiversity as bioindicators of sustainable landscapes. Agric Ecosyst Env 74:357-372
Braby MF (2010) Conservation status and management of the Gove Cow Euploea alcathoe enastri (Lepidoptera: Nymphalidae), a threatened tropical butterfly from indigenous Aboriginallands of north-easter, Arnhem Land, Australia. J lnsect Conserv 14:535--554
Céréghino R, Park YS (2009) Review of the self-organizing map (SOM) approach in water resources: commentary. Environ Modell Softw 24:945-947
Collins BM, Stephens SL (2007) Managing natural wildfires in Sierra Nevada wildemess areas. Front Ecol Environ 5:523-527 Erhardt A (1985) Diurnal Lepidoptera: sensitive indicators of
cultivated and abandoned grassland. J App Ecol 22:849-861 Fowles AP, Bailey MP, Hale AD (2004) Trends in the recovery of a
rosy marsh moth, Coenophila suhrosea (Lepidotera, Noctuidae) population in response to tire and conservation management on a lowland raised mire. J Insect Conserv 8:149-158
Frouz J (1999) Use of soil dwelling Diptera (lnsecta, Diptera) as bioindicators: a review of ecological requirements and response to disturbance. Agric Ecosyst Environ 74:167-186
Geiger W (1987) Les Papillons de jour et leurs biotopes. Ed. Ligue Suisse pour la protection de la Nature, Bâle, Switzerland Geiger W (1992) Insekten und Naturschutz. Überlegungen aus der
Schweiz. Mitt dt Ges allg angew Ent 8:19-22
Kimberling DN, Karr JR, Fore LS (2001) Measuring human disturbance using terrestrial invertebrates in the shrub--steppe of eastern Washington (USA). Ecol Ind 1:63-137
King JR, Andersen AN, Cutter AD (1998) Ants as bioindicators of habitat disturbance: validation of the functional group model for Australia's hurnid tropics. Biodiv Cons 7:1627-1638
Kohonen T (2001) Self-organizing maps, 3rd edn. Springer, Heidelberg
Lafranchis T (2000) Les papillons de jour de France, Belgique et Luxembourg et leurs chenilles. Coll. Parthénope, Ed. Biotope, Mèze, France
Lek S, Guégan JF (2000) Neuronal networks, application to ecology and evolution. Springer, Heidelberg
Leraut P (1992) Les Papillons dans leur milieu. Coll. Ecoguides, Ed. Bordas, Paris, France
Lobry de Bruyn LA (1999) Ants as bioindicators of soil function in rural environments. Agric Ecosyst Env 74:425-441
Luque C, Gers C, Lauga J, Mariano NA, Wink M, Legal L (2007) Analysis of forestry impacts and Biodiversity in two Pyrenean Forests through a Comparison of moth communities (Lepidop-tera, Heterocera). lns Sei 14:323-338
Luque C, Legal L, Machkour M'Rabet S, Winterton P, Gers C, Wink M (2009) Apparent influences of host plant distribution on the structure and the genetic variability of local populations of the Purple Clay (Diarsia brunnea). Bioch Sys Ecol 37:6-15 New TR (1997) Are Lepidoptera an effective 'umbrella group' for
biodiversity conservation? J Insect Conserv 1:5-12
Oostermeijer JGB, Van Swaay CAM (1998) The relationship between butterflies and environmental indicator values: a tool for conservation in a changing landscape. Biol Cons 86:271-280 Paoletti MG (1999) Practical use of invertebrates to assess sustainable
land use. Agric Ecosyst Environ 74:9-11
Powell AFLA, Busby WH, Kindscher K (2007) Status of the regal fritillary (Speyeria idalia) and effects of fire management on its abundance in northeastem Kansas, USA. J Insect Conserv 11: 281-285
Quartau JA (2009) Preventative tire procedures in mediterranean woods are destroying their insect Biodiversity: a plea to the EU Govemments. J Insect Conserv 13:267-270
Ricouart F (2005) La gestion de l'espace et la prevention des incendies de forêt dans les Pyrénées méditerranéenes. Ph.D. dissertation, University of Toulouse Il, France
Rosin ZM, Mysczko L, Skorka P, Lenda M, Moron D, Sparks TH and Tryjanowski P (2011) Butterfly responses to environmental factors in fragmented calcareous grasslands. J lnsect Conserv.
Roux 0, Gers C, Legal L (2006) When, among variations during ontogeny, cuticular compounds of Calliphoridae may be used as phylogenetic markers. Bioch Sys Ecol 34:406-416
Shreeve TG, Dennis RLH, Roy DB, Moss D (2001) An ecological classification of British butterflies: ecological attributes and biotope occupancy. J lnsect Conserv 5:145-161
Soberon J, Townsend-Peterson A (2005) Interpretation of models of fundamental ecological niches and species' distributional areas. Biodiv Inform 2:1-10
Sommaggio D (1999) Syrphidae: can they be used as environmental bioindicators. Agric Ecosyst Environ 74:343-356
Speight MCD, Good JA, Castella E (2002) Predicting the changes in farm syrphid faunas that could be caused by changes in farm management regimes (Diptera, Syrphidae). Volucella 6:125-137 Stefanescu C, Herrando S, Paramo F (2004) Butterfly species richness in the north-west Mediterranean Basin: the role of the natural and human-factors. J Biogeo 31:905-915
Swengel SR, Schicht D (2011) Declines of prairie butterflies in the Midwestem USA. J Insect Conserv 15:327-339
Swofford DL (2002) P AUP: phylogenetic analysis using parsimony (*and other methods), version 4.0. Sinauer Associates, Sunderland Thomas CD, Hanski I (1997) Butterfly metapopulations. In: Hanski I, Gilpin ME (eds) Metapopulation biology. Academie Press, San Diego, pp 359-386
Thomas CD, Harrison S (1992) Spatial dynarnics of a patchily distributed butterfly species. J Ani Ecol 61:437-446
Tolman T, Lewington R (1999) Guide des Papillons d'Europe et d'Afrique du Nord. Coll. Les guides du Naturaliste, Ed. Delachaux et Niestlé, Lausanne, Switzerland
Van Halder I, Barbaro L, Jactel H (2011) Conserving butterflies in fragmented plantation forests: are edge and interior habitats equally important? J Insect Conserv 15:591--601
Vesanto J, Alhoniemi E (2000) Clustering of the self-organizing map. Neural Netw IEEE Trans 11:586--600
Vesanto J, Himberg J, Alhoniemi E and Parhankangas J (1999) Self-organizing map in Matlab: the SOM Toolbox. In: Proceedings of the Matlab DSP Conference, Espoo, Finland, pp 35-40 Warren SD, Scifres CJ, Teel PD (1987) Response of grassland
arthropods to burning: a review. Agric Ecosyst Env 19:105-130 Zimmermann M, Aubert J, Descimon H (1999) Systématique moléculaire des Mélités-molecular systernatics of the Meli-taeinae. CRAS Biologie 322:429-439
Zschokke S, Doit C, Rusterholz HP, Oggier P, Braschler B, Thommen H, Lüdin E, Erhardt A, Baur B (2000) Short-term responses of plants and invertebrates to experimental small-scale grassland fragmentation. Oecologia 125:559-572