Département de génie civil
NUMERICAL SIMULATION OF FRESH SCC FLOW
IN WALL AND BEAM ELEMENTS USING FLOW
DYNAMICS MODELS
Simulation numérique de l'écoulement du BAP dans des éléments de mur et de poutre en utilisant des modèles dynamiques d'écoulement
Thèse de doctorat Spécialité : génie civil
Masoud HOSSEINPOOR
Jury : Kamal H. KHAYAT (directeur) Ammar YAHIA (co-directeur) Jay LACEY (rapporteur)
Olafur H. WALLEVIK (évaluateur) Pierre PROULX (évaluateur)
i
ABSTRACT
Recently, there is a great interest to study the flow characteristics of suspensions in different environmental and industrial applications, such as snow avalanches, debris flows, hydrotransport systems, and material casting processes. Regarding rheological aspects, the majority of these suspensions, such as fresh concrete, behave mostly as non-Newtonian fluids. Concrete is the most widely used construction material in the world. Due to the limitations that exist in terms of workability and formwork filling abilities of normal concrete, a new class of concrete that is able to flow under its own weight, especially through narrow gaps in the congested areas of the formwork was developed. Accordingly, self-consolidating concrete (SCC) is a novel construction material that is gaining market acceptance in various applications. Higher fluidity characteristics of SCC enable it to be used in a number of special applications, such as densely reinforced sections. However, higher flowability of SCC makes it more sensitive to segregation of coarse particles during flow (i.e., dynamic segregation) and thereafter at rest (i.e., static segregation). Dynamic segregation can increase when SCC flows over a long distance or in the presence of obstacles. Therefore, there is always a need to establish a trade-off between the flowability, passing ability, and stability properties of SCC suspensions. This should be taken into consideration to design the casting process and the mixture proportioning of SCC. This is called “workability design” of SCC.
An efficient and non-expensive workability design approach consists of the prediction and optimization of the workability of the concrete mixtures for the selected construction processes, such as transportation, pumping, casting, compaction, and finishing. Indeed, the mixture proportioning of SCC should ensure the construction quality demands, such as demanded levels of flowability, passing ability, filling ability, and stability (dynamic and static). This is necessary to develop some theoretical tools to assess under what conditions the construction quality demands are satisfied. Accordingly, this thesis is dedicated to carry out analytical and numerical simulations to predict flow performance of SCC under different casting processes, such as pumping and tremie applications, or casting using buckets.
The L-Box and T-Box set-ups can evaluate flow performance properties of SCC (e.g., flowability, passing ability, filling ability, shear-induced and gravitational dynamic segregation) in casting process of wall and beam elements. The specific objective of the study consists of relating numerical results of flow simulation of SCC in L-Box and T-Box test set-ups, reported in this thesis, to the flow performance properties of SCC during casting. Accordingly, the SCC is modeled as a heterogeneous material. Furthermore, an analytical model is proposed to predict flow performance of SCC in L-Box set-up using the Dam Break Theory. On the other hand, results of the numerical simulation of SCC casting in a reinforced beam are verified by experimental free surface profiles. The results of numerical simulations of SCC casting (modeled as a single homogeneous fluid), are used to determine the critical zones corresponding to the higher risks of segregation and blocking. The effects of rheological parameters, density, particle contents, distribution of reinforcing bars, and particle-bar interactions on flow performance of SCC are evaluated using CFD simulations of SCC flow in L-Box and T-box test set-ups (modeled as a heterogeneous material). Two new approaches are proposed to classify
Keywords : Computational fluid dynamics, Dynamic stability, Flowability, Homogeneous and
Heterogeneous analysis, Numerical simulation, Passing ability, Rheology, Segregation, Self-consolidating concrete.
iii
RÉSUMÉ
Récemment, il y a un grand intérêt à étudier les caractéristiques d'écoulement des suspensions dans différentes applications environnementales et industrielles, telles que les avalanches des neiges, les coulées de débris, les systèmes de transport et les processus d’écoulement des matériaux. En ce qui concerne les aspects rhéologiques, la plupart des suspensions, comme le béton frais, se comportent comme un fluide non-Newtonien.
Le béton est le matériau de construction le plus largement utilisé dans le monde. En raison de limites qui caractérisent le béton normal en termes de maniabilité et de capacité de remplissage de coffrage, il était nécessaire de développer une nouvelle classe de béton qui peut couler sous son propre poids, en particulier à travers les zones congestionnées du coffrage. Par conséquent, le béton autoplaçant (BAP) est un nouveau matériau de construction qui est de plus en plus utilisé dans les différentes applications. Étant donné sa fluidité élevée de BAP peut être utilisé dans certaines applications particulières, notamment dans la section densément renforcée. Cependant, la fluidité élevée rend le béton plus sensible à la ségrégation des gros granulats pendant l'écoulement (la ségrégation dynamique) et ensuite au repos (ségrégation statique). La ségrégation dynamique peut augmenter lorsque le BAP est coulé sur une longue distance ou en présence d'obstacles. Par conséquent, il est toujours nécessaire d'établir un compromis entre la fluidité, la capacité de passage, et la stabilité du BAP. Ceci doit être pris en considération afin de concevoir le processus de coulée et dosage des mélanges du BAP. Ceci est appelé la conception d'ouvrabilité du BAP.
Une conception de maniabilité efficace et non coûteuse peut être achevée à travers la e prévision et l'optimisation de l'ouvrabilité des mélanges de béton pour les procédés de construction sélectionnés, notamment le transport, le pompage, la mise en place, le compactage, la finition, etc. En effet, les formulations de mélange doivent se confirmer à la qualité de la construction demandée, par exemple les niveaux exigés de fluidité, la capacité de passage, la capacité de remplissage, et la stabilité (statique et dynamique). Celui est nécessaire pour développer des outils théoriques afin d’évaluer dans quelles conditions les exigences de qualité de la construction sont satisfaites. Cette thèse est consacrée à la réaliser des simulations analytiques et numériques pour prédire la performance d'écoulement du BAP dans différents procédés de la mise en place du béton.
L'objectif spécifique de cette étude consiste à simuler l'écoulement du BAP dans essais empiriques, notamment la boite en L et la boite en T pour évaluer la performance du BAP pendent la mise en place (la fluidité, la capacité de passage, la capacité de remplissage, et la ségrégation dynamique induite par cisaillement ou par gravité). Par conséquent, le BAP est modélisé comme matériau hétérogène. En outre, un modèle analytique est proposé pour prédire la performance à l'écoulement du BAP dans la boite en L en utilisant la théorie de Dam Break. D'autre part, les résultats des simulations numériques de l’écoulement du BAP dans une poutre renforcée sont comparés aux résultats expérimentaux par des profils de surface libres. Les résultats des simulations numériques de BAP coulée (modélisée comme un fluide homogène unique), sont utilisés pour déterminer les zones critiques correspondant à des risques plus élevés de ségrégation et de blocage. Les effets des paramètres rhéologiques, la masse volumique, le contenu des particules, la distribution de barres d'armature, et les interactions particule-barres
hétérogène). Deux nouvelles approches sont proposées pour classifier les mélanges du BAP sur la base de la capacité de remplissage, et les propriétés de performabilité, en fonction de la fluidité, la capacité de passage et de la stabilité dynamique du BAP.
Mots-clés : La mécanique des fluides numérique (MFN), La stabilité dynamique, La fluidité,
L’analyse homogène et hétérogène, Le simulation numérique, La capacité de passage, Rhéologie, Ségrégation, Béton autoplaçant.
v
ACKNOWLEDGEMENTS
Firstly, I would like to express my sincere gratitude to my supervisor Professor Kamal H. Khayat for accepting me into his research group, for the continuous support of my Ph.D. study and related research, for his patience, motivation, and immense knowledge. His guidance helped me in all the time of research and writing of this thesis. I could not have imagined having a better advisor and mentor for my Ph.D. study.
My sincere thanks also goes to Professor Ammar Yahia who has been extremely helpful to me during the entire period of my studies in Université de Sherbrooke. As my advisor, he worked closely with me during the conduction of this research, the proposal writing and during the period of my dissertation. Without his helps and encouragement this dissertation would not have been written (or ever finished!).
I would like to thank all the professors of Civil Engineering Department and all the faculty staff I have interacted with. The kind cooperation of all the research assistants, technicians, and graduate students of the Cement and Concrete Research Group at the Université de Sherbrooke are also acknowledged. My special thanks goes to Mr. Behrouz Esmailkhanian for his friendly companionship during this memorable period of my life. I would also like to thanks Mr. Daddy Kabagire for his generous help to translate some parts of this thesis manuscript in French.
I am very much thankful to the members of the dissertation committee Professor Wallevik, Professor Proulx, and Professor Lacey for their valuable comments and advices.
I also wish to thank the financial support of the National Science and Engineering Research Council of Canada (NSERC) and the 16 industrial partners participating in the NSERC Chair on High Performance Flowable Concrete with Adapted Rheology, held by Professor Kamal H. Khayat of the Université de Sherbrooke.
vi
Last but certainly not least, would like to acknowledge my family: My mother, Masoumeh, my father, Mahmoud, and my lovely sisters, Maryam and Marjan, who patiently encouraged and supported me spiritually over the period of my Ph.D. study and my life in general.
vii
TABLE OF CONTENTS
ABSTRACT ... i
RÉSUMÉ ... iii
ACKNOWLEDGEMENTS ... v
LIST OF FIGURES ... xiii
LIST OF TABLES ... xix
NOTATIONS ... xxi
LIST OF ABBREVIATIONS ... xxv
CHAPTER 1 INTRODUCTION ... 1
1.1 Heterogeneous behavior of multiphase suspensions ... 1
1.2 Workability of fresh conventional concrete ... 2
1.3 Self-consolidating concrete (SCC) ... 2
1.4 Workability design ... 3
1.5 Theoretical flow analysis of SCC ... 4
1.6 Originality of this study ... 5
1.7 Outline of the thesis ... 6
CHAPTER 2 STATE OF THE ART ... 9
2.1 Rheology of non-Newtonian materials ... 9
2.2 Rheological models of cement based materials ... 12
2.2.1 Bingham model ... 13
2.2.2 Herschel-Bulkley model ... 14
2.3 Rheology of different cementitious materials ... 15
2.3.1 Rheology of cement paste ... 16
2.3.2 Rheology of cement mortar ... 16
2.3.3 Rheology of concrete ... 17
2.4 Self-consolidating concrete (SCC) ... 18
2.4.1 Rheology of SCC ... 18
2.4.2 Workability of self-consolidating concrete ... 19
2.5 Workability design ... 39
2.6 Theoretical flow analysis ... 43
2.6.1 Analytical flow analysis of fresh concrete ... 44
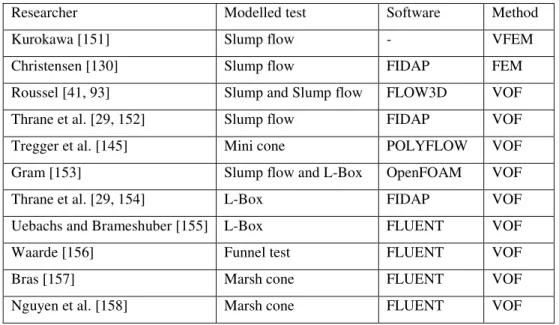
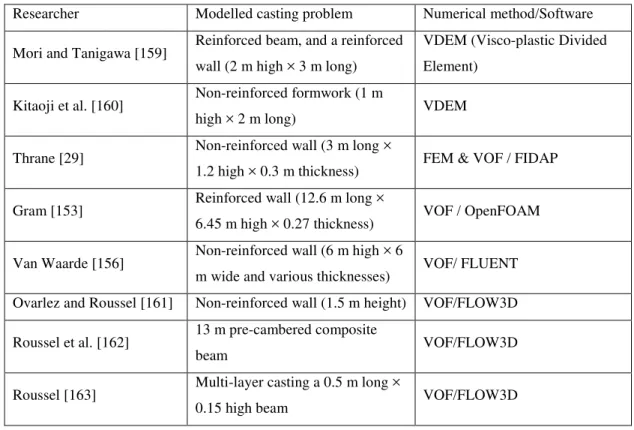
2.6.2 Numerical flow simulations of fresh concrete ... 48
CHAPTER 3 ORIGINALITY AND OBJECTIVES ... 67
3.1 Homogeneous analysis of flow of SCC as a single fluid ... 67
3.2 Heterogeneous analysis of flow of SCC as a suspension of coarse aggregates and suspending fluids ... 69 3.3 Workability design ... 69 3.4 Summary ... 74 3.4.1 Homogeneous analysis ... 74 3.4.2 Heterogeneous analysis ... 74 3.5 Objectives ... 75
3.5.1 Analytical modelling of flow of fresh SCC in the L-Box test set-up (Homogeneous analysis) ... 75
3.5.2 Numerical simulation of SCC casting of a reinforced L-Shaped beam using CFD (Homogeneous analysis) ... 75
3.5.3 Numerical simulation of flow of SCC in L-Box test set-up as a heterogeneous suspension of coarse aggregate and a non-Newtonian suspending fluid – Effect of rheological
parameters on flow performance ... 76
3.5.4 Numerical simulation of coupled effect of reinforcing bars and coarse aggregate content on flow characteristics of SCC in horizontal and vertical directions (Heterogeneous analysis) ... 76
3.5.5 Numerical simulation of flow performance of SCC in T-Box test set-up using CFD (Heterogeneous analysis) ... 77
CHAPTER 4 THESIS METHODOLOGY ... 79
4.1 Analytical approach ... 79
4.2 Numerical approach ... 80
4.2.1 FLOW3D® software ... 80
4.2.2 General Moving Objects (GMO) technique ... 83
4.2.3 Inputs of the numerical models ... 84
4.3 Feasibility study of application of single fluid assumption in numerical simulation of flow of SCC as a homogeneous material ... 85
4.3.1 Wall casting simulation ... 85
4.3.2 Numerical simulation of workability tests... 89
4.3.3 Relationship between results of numerical simulations of wall casting and workability tests ... 90
CHAPTER 5 ANALYTICAL AND NUMERICAL MODELING OF FLOW PERFORMANCE OF SELF-CONSOLIDATING CONCERETE USING THE DAM BREAK THEORY AND CFD ... 93
5.1 Introduction ... 94
5.2 Mathematical formulation ... 97
5.3 Proposed model ... 101
5.4 Experimental program ... 104
5.4.1 Test procedure ... 105
5.5 Test results and discussion ... 106
5.5.1 Effect of rheological properties, initial casting head, and waiting time on experimental flow profiles ... 107
5.5.2 Analytical Dam Break Theory analysis using the Bingham rheological model ... 109
5.5.3 Analytical Dam Break Theory analysis using the Herschel-Bulkley rheological model ... 111
5.5.4 Numerical simulation of SCC flow in the modified L-box set-up using computational fluid dynamics (CFD) ... 113
5.5.5 Effect of waiting time on the accuracy of predicting models ... 117
5.6 Conclusions ... 120
CHAPTER 6 HOMOGENEOUS ANALYSIS OF SELF-CONSOLIDATING CONCRETE (SCC) CASTING IN REINFORCED BEAM USING COMPUTATIONAL FLUID DYNAMICS (CFD)... 123
6.1 Introduction ... 124
6.2 Materials and experimental program ... 125
6.3 Numerical simulation and boundary conditions ... 128
6.4 Results and discussions ... 129
6.4.1 Effect of the plastic viscosity of the investigated mixtures on flow performance of SCC in the horizontal direction ... 129
ix
6.4.2 Effect of the plastic viscosity of the investigated mixtures on flow performance of
SCC in the vertical direction ... 134
6.4.3 Calculation of the flow rate magnitudes of the investigated mixtures, provided by the L-beam set-up ... 139
6.4.4 Estimation of the critical thickness of segregation ... 140
6.5 Conclusions ... 142
CHAPTER 7 NUMERICAL SIMULATION OF SELF-CONSOLIDATING CONCRETE FLOW AS A HETEROGENEOUS MATERIAL IN L-BOX SET-UP – EFFECT OF RHEOLOGICAL PARAMETERS ON FLOW PERFORMANCE ... 145
7.1 Introduction ... 146
7.2 Properties of modelled materials... 149
7.3 Numerical simulations and boundary conditions ... 150
7.3.1 Sampling methods and anticipated results ... 150
7.4 Results and discussion ... 152
7.4.1 Effect of viscosity and yield Stress of the suspending fluid on flowability of the suspension ... 152
7.4.2 Effect of viscosity and yield stress of the suspending fluid on passing ability of the suspension ... 156
7.4.3 Effect of viscosity and yield stress of the suspending fluid on dynamic stability of the suspension ... 158
7.4.4 Effect of density of the suspending fluid on flowability of the suspension ... 161
7.4.5 Effect of density of the suspending fluid on passing ability of the suspension ... 163
7.4.6 Effect of density of the suspending fluid on dynamic stability of the suspension ... 164
7.4.7 Effect of shear elasticity modulus of the suspending fluid on flowability of the suspension ... 166
7.4.8 Effect of shear elasticity modulus of the suspending fluid on dynamic stability of the suspension ... 168
7.4.9 Proposed approach to evaluate filling ability of suspension ... 170
7.5 Conclusions ... 174
7.5.1 Effect of the plastic viscosity and yield stress of the suspending fluid on flow performance of the investigated suspensions ... 174
7.5.2 Effect of the density of the suspending fluid on flow performance of the investigated suspensions ... 175
7.5.3 Effect of the shear elasticity modulus of the suspending fluid on flow performance of the investigated suspensions ... 176
7.5.4 Proposed approach to evaluate filling ability of suspension ... 176
CHAPTER 8 NUMERICAL SIMULATION OF SELF-CONSOLIDATING CONCRETE FLOW AS A HETEROGENEOUS MATERIAL IN L-BOX SET-UP – COUPLED EFFECT OF REINFORCING BARS AND AGGREGATE CONTENT ON FLOW CHARACTERISTICS ... 177
8.1 Introduction ... 178
8.2 Properties of modelled materials... 181
8.3 Numerical simulation and boundary conditions ... 182
8.3.1 Sampling methods and anticipated results ... 183
8.4 Results and discussion ... 184
8.4.1 Effect of particle contents on passing ability and dynamic stability of suspensions in horizontal direction ... 184
8.4.2 Effect of reinforcement bars on passing ability and dynamic stability of suspensions
in the horizontal direction ... 190
8.4.3 Bar-particles coupled effect on flow performance of suspensions in the horizontal direction ... 193
8.4.4 Bar-particles coupled effect on dynamic stability of suspensions in the vertical direction ... 198
8.5 Conclusions ... 200
CHAPTER 9 NUMERICAL SIMULATION OF DYNAMIC SEGREGATION OF SELF-CONSOLIDATING CONCRETE IN T-BOX SET-UP ... 203
9.1 Introduction ... 204
9.2 T-Box test set-up ... 207
9.3 Properties of modelled materials and T-Box test procedure ... 208
9.4 Numerical simulation and boundary conditions ... 210
9.4.1 Sampling methods and anticipated results ... 210
9.5 Results and discussions ... 211
9.5.1 Evaluation of flowability of modeled suspensions in T-Box test set-up ... 211
9.5.2 Evaluation of dynamic stability of suspensions in the horizontal direction ... 214
9.5.3 Tracking of particles ... 219
9.5.4 Evaluation of dynamic stability of the suspensions in the vertical direction ... 222
9.5.5 Comparison between horizontal and dynamic segregation indices (H.D.SI. vs V.D.S.I) ... 226
9.5.6 Effect of yield stress of suspending fluid on flow performance of suspensions in T-Box set-up ... 226
9.5.7 Proposed approach to evaluate “Performability” of suspensions ... 228
9.6 Conclusions ... 231
CHAPTER 10 COMPARISON BETWEEN FLOW PERFORMANCE OF SCC IN THE L-BOX AND T-BOX SET-UPS ... 233
10.1 Comparison between flowability of SCC in the L-Box and T-Box set-ups ... 233
10.1.1 Flow velocity ... 233
10.1.2 Flow strain rate ... 235
10.1.3 Flow energy ... 236
10.2 Comparison between dynamic stability of SCC in L-Box and T-Box set-ups ... 237
10.2.1 Horizontal dynamic segregation ... 237
10.2.2 Ratio of vertical dynamic segregation to horizontal dynamic segregation ... 239
CHAPTER 11 SUMMARY AND CONCLUSIONS ... 241
11.1 Flow analysis of SCC as a homogeneous material ... 241
11.1.1 Analytical modelling of flow of SCC in the L-Box test set-up ... 241
11.1.2 Numerical modelling of flow of SCC in the L-Box test set-up ... 242
11.1.3 Numerical modelling of SCC casting of a full-scale reinforced L-shaped beam .... 243
11.2 Flow analysis of SCC as a heterogeneous material ... 244
11.2.1 Numerical simulation of heterogeneous flow of SCC in the L-Box test ... 244
11.2.2 Numerical simulation of heterogeneous flow of SCC in the T-Box test ... 246
11.2.3 Comparison between flow performance of SCC in L-Box and T-Box set-ups ... 247
11.3 CONCLUSIONS (EN FRANÇAIS) ... 249
11.3.1 Analyse d’écoulement du BAP comme un matériau homogène ... 249
11.3.2 Analyse d’écoulement du BAP comme un matériau hétérogène ... 251
xi
12.1 Homogeneous flow analysis of SCC ... 257
12.1.1 Analytical predictions using Dam Break Theory ... 257 12.1.2 Numerical simulation of SCC as a homogeneous single fluid ... 257
12.2 “Homo-Hetero”-geneous analysis of SCC flow: A transitional combination of homogeneous and heterogeneous analyses ... 259 12.3 Heterogeneous flow analysis of SCC ... 259 12.4. Numerical simulation of flow performance of fiber reinforced SCC (FRSCC) 262 REFERENCES ... 263
xiii
LIST OF FIGURES
Figure 2. 1 Schematic of shearing flow ... 9
Figure 2. 2 Different rheological behaviors of the fluid ... 11
Figure 2. 3 The direction of the change in rheology of a typical concrete caused by an increase in the amount of the parameter noted is shown by the arrows [76] ... 17
Figure 2. 4 Recommended rheograph: proposed limits of rheological values of SCC [77]... 19
Figure 2. 5 Increasing effect of presence of aggregates on local shear rate values in the suspending matrix (cement paste or mortar) [29] ... 22
Figure 2. 6 Schematics of slump flow test for evaluating flowability of SCC [80] ... 23
Figure 2. 7 Schematics of V-funnel test for evaluating flowability of SCC [23-25] ... 25
Figure 2. 8 Accumulation of coarse particles behind the obstacles (i.e. blocking) resulting in poor form filling and honey combing ... 27
Figure 2. 9 Schematics of J-ring test for evaluating passing ability of SCC [82] ... 29
Figure 2. 10 Schematics of U-box test for evaluating passing ability of SCC. (all dimensions are in mm) [25] ... 30
Figure 2. 11 Schematics of L-box test set-up and reinforcement bars details [23-25. 78] ... 31
Figure 2. 12 Static segregation: migration of aggregates towards bottom layers ... 32
Figure 2. 13 Schematics of column of segregation test [84] ... 34
Figure 2. 14 Schematics of penetration test (all dimensions are in mm) [87] ... 35
Figure 2. 15 Homogeneous flow versus vertical dynamic segregation in a) horizontal flow, and b) vertical flow... 36
Figure 2. 16 Homogeneous flow versus horizontal dynamic segregation ... 37
Figure 2. 17 Schematics of the T-Box test set-up [36-38] ... 38
Figure 2. 18 Workability design procedure of SCC ... 42
Figure 2. 19 Stoppage profile shape in LCPC-Box [147] ... 47
Figure 2. 20 Euler grid-based fluid structure in 2D ... 53
Figure 2. 21 Description of a Bingham fluid by DEM ... 59
Figure 2. 22 Schematics of a typical SPH particle and its adjacent particles [173] ... 61
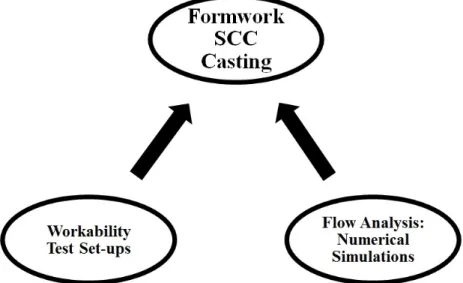
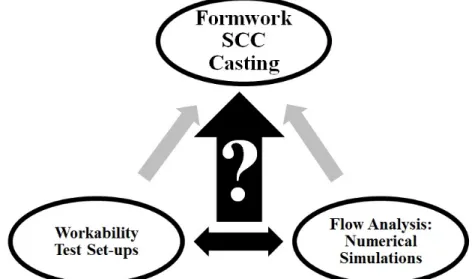
Figure 3. 1 Current status of the workability confirmation step in workability design procedure ... 70
Figure 3. 2 Making relation between the numerical outputs of the theoretical flow analyses and experimental/theoretical results of the workability tests ... 71
Figure 4. 1 Meshing capabilities provided by FLOW3D: a) linked meshes, b) conforming meshes, c) nested mesh block, d) partially overlapping mesh, e) finite element mesh [198] ... 81
Figure 4. 2 a) Schematics of the wall to be cast by 20 L/s pumping, and b) reinforcing bars spacing and distributions ... 86
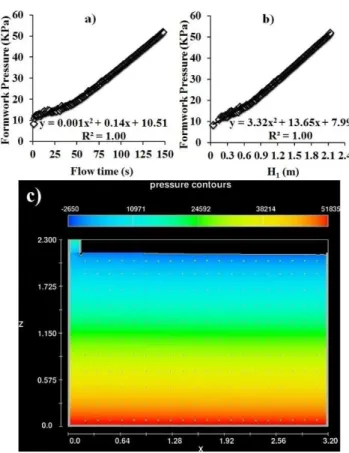
Figure 4. 3 Screen shots of numerical simulation of the evolution of free surface flow profile of the concrete in the wall formwork in flow times t = a) 10 s, b) 30 s, c) 100 s, and d) 149 s 87 Figure 4. 4 a) Position of flow front (Xfront) and b) H2/H1 values, versus flow time ... 88
Figure 4. 5 Maximum formwork pressure versus a) flow time, b) H1, and c) final pressure distribution ... 88
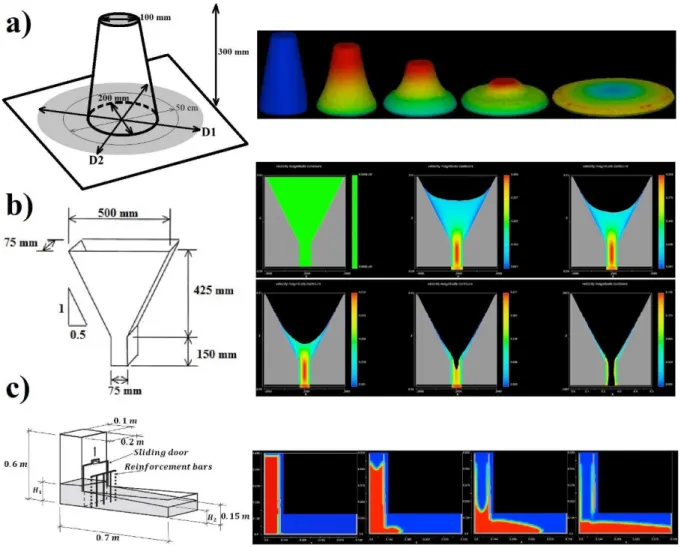
Figure 4. 6 Numerical simulation of workability tests: a) slump flow, b) V-funnel, and c) L-Box set-ups ... 89
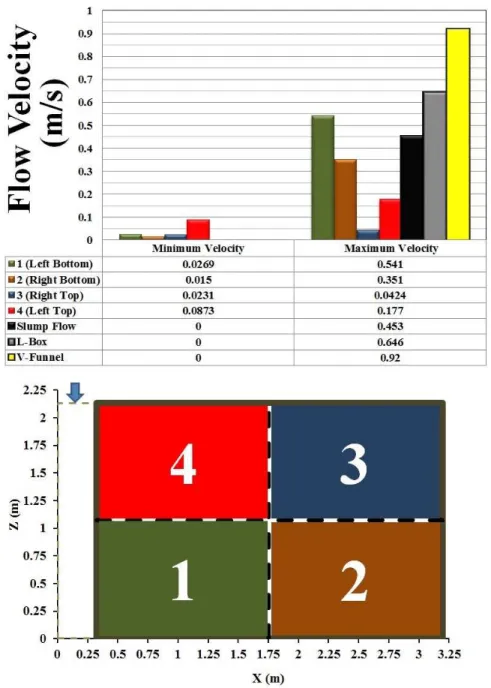
Figure 4. 7 Comparison between the range of flow velocity in workability tests and 4 different
zones of the cast wall ... 90
Figure 4. 8 Comparison between the range of flow strain rate in workability tests and 4 different zones in the cast wall ... 91
Figure 5. 1 The perturbation E(ξ) as a function of re-scaled distance ξ, when B < 1/3 for n = 1 (the Bingham model) [193] ... 103
Figure 5. 2 Schematics of the modified L-box set-up used to evaluate restricted flow profile of SCC (all dimensions are in mm) [204] ... 106
Figure 5. 3 Comparison between experimental (thicknesses at different locations along the horizontal channel) and theoretical results predicted by Dam Break Theory analysis using the Bingham model ... 110
Figure 5. 4 Comparison between experimental and theoretical results predicted by Dam Break Theory analysis using the Herschel-Bulkley model ... 112
Figure 5. 5 Schematics of the applied boundary conditions in the numerical simulations ... 114
Figure 5. 6 Comparison between experimental and theoretical results predicted by numerical simulations (CFD) using the Bingham rheological parameters ... 115
Figure 5. 7 Critical flow thickness of segregation of the investigated mixtures for different initial head ... 116
Figure 5. 8 Experimental and theoretical flow profiles obtained for SCC1, SCC2, and SCC3 after 1, 5, and 15-min waiting times, respectively (all RMSE values are in cm) ... 118
Figure 5. 9 Comparison between experimental results and theoretical predictions by Dam Break Theory analysis, using the Herschel-Bulkley model, for different waiting times of 1, 5, and 15 min ... 120
Figure 6. 1 a) Schematics of the L-shaped beam and reinforcement bars arrangement, b) formwork of the beam, and c) cage of the reinforcement bars ... 127
Figure 6. 2 Experimental results of horizontal displacement of flow front versus flow time . 128 Figure 6. 3 Flow front displacement, a comparison between numerical simulation and experimental results: a) SCC 1, b) SCC 2, and c) SCC 3 ... 130
Figure 6. 4 Predicted flow front displacements in horizontal beam versus flow time ... 131
Figure 6. 5 Flow front velocity versus a) flow time, b) viscosity ... 133
Figure 6. 6 Maximum flow strain rate magnitude versus a) flow time, b) viscosity ... 133
Figure 6. 7 Mass-averaged kinetic energy versus a) flow time, b) viscosity ... 134
Figure 6. 8 Vertical motion of the flow surface versus flow time for the investigated mixtures with different plastic viscosity values ... 135
Figure 6. 9 Maximum flow surface velocity at vertical part versus plastic viscosity ... 136
Figure 6. 10 Velocity of flow surface versus vertical motion of flow surface in different sections of the vertical part of the formwork, examined for the investigated mixtures with different plastic viscosities ... 137
Figure 6. 11 Variation of velocity with surface motion in different parts of the vertical section: a) upper rectangular part, b) V-shaped funnel part, c) transition zone between V-shaped funnel and lower rectangular parts, and d) lower rectangular part ... 138
Figure 6. 12 a) Flow rate versus time, and b) maximum flow rate versus viscosity ... 140
xv
Figure 7. 1 a) Schematics of L-Box set-up and obstacle configuration, b) horizontal sampling
sections, and boundary conditions, and c) vertical sampling sections ... 151
Figure 7. 2 L-Box ratio for different mixtures versus plastic viscosity of the suspending fluid ... 152
Figure 7. 3 Flow height and front position of the flow at vertical and horizontal parts ... 153
Figure 7. 4 Vertical flow displacement versus horizontal flow motion ... 154
Figure 7. 5 T40 cm versus plastic viscosity of the suspending fluid ... 155
Figure 7. 6 a) Maximum velocity and b) strain rate magnitudes versus plastic viscosity of the suspending fluid ... 155
Figure 7. 7 Blocking index versus flow time ... 156
Figure 7. 8 Maximum blocking index versus plastic viscosity of the suspending fluid ... 157
Figure 7. 9 COV values of particle contents in horizontal sections versus flow time... 158
Figure 7. 10 The ratio of particle content in different vertical layers of a) top, b) middle, and c) bottom to initial particle content versus plastic viscosity of the suspending fluid ... 159
Figure 7. 11 Vertical dynamic segregation index versus plastic viscosity of the suspending fluid ... 160
Figure 7. 12 Opposite effect of the plastic viscosity of the suspending fluid on passing ability and vertical dynamic segregation: values of B.I.max and V.D.S.I. versus plastic viscosity of the suspending fluid ... 161
Figure 7. 13 Vertical flow displacement versus horizontal flow motion for modeled SCC mixtures with different rheological properties ... 162
Figure 7. 14 a) Final profile angle and b) T40 cm values versus plastic viscosity of the suspending fluid ... 162
Figure 7. 15 Maximum a) velocity, b) strain rate, and c) mass-averaged kinetic energy magnitudes versus plastic viscosity of the suspending fluid ... 163
Figure 7. 16 Maximum blocking index versus plastic viscosity of the suspending fluid ... 164
Figure 7. 17 COV values of particle content in horizontal sections versus flow time ... 165
Figure 7. 18 Vertical dynamic segregation index versus plastic viscosity of the suspending fluid ... 166
Figure 7. 19 a) Maximum velocity and b) strain rate magnitudes versus plastic viscosity of the suspending fluid ... 167
Figure 7. 20 Maximum blocking index versus plastic viscosity of the suspending fluid ... 168
Figure 7. 21 COV values of particle content in horizontal sections versus flow time ... 169
Figure 7. 22 Opposite effect of shear elasticity modulus of suspending fluid on passing ability and vertical dynamic segregation ... 170
Figure 7. 23 Classification of modelled suspensions based on filling ability properties: B.I.max versus maximum flow velocity ... 171
Figure 7. 24 Classification of modelled suspensions based on filling ability properties: B.I.max versus maximum flow strain rate... 172
Figure 7. 25 Classification of modelled suspensions based on filling ability properties: B.I.max versus maximum flow mass-averaged kinetic energy ... 172
Figure 8. 1 a) Schematics of the L-Box set-up and configuration of standard 3 bars after the sliding door, b) 18 bars ... 182
Figure 8. 2 Boundary conditions and horizontal sampling sections ... 183
Figure 8. 4 Variations of E.H.D.S.I index values with flow time determined at 0.1 s intervals ... 185 Figure 8. 5 Variations of I.H.D.S.I. index values with horizontal sampling part number (L-Box with no obstacles) ... 187 Figure 8. 6 Particles effect: values of I.H.D.S.I. for suspensions with different particle contents versus horizontal sampling location along the L-Box with a) 3 and b) 18 reinforcing bars in the horizontal channel ... 189 Figure 8. 7 Bar effect: variation of I.H.D.S.I. values in different horizontal sampling parts for different configurations of obstacles, obtained for values of particle content of a) 4.6% and b) 8.7% ... 192 Figure 8. 8 Bar-particles coupled effect on flow performance of the investigated suspensions in different horizontal sampling parts i = 1 to 6: a) variation of particle content effect (P.C.E.) for two different number of obstacles j = 3 and 18, and b) variation of bar effect (B.E.) for two different particle contents k = 4.6% and 8.7% ... 195 Figure 8. 9 Variation of Bar-Particles coupled effect with dynamic stability of investigated mixtures ... 197 Figure 9. 1 Schematics of T-Box set-up [36-38] ... 207 Figure 9. 2 Angular velocity versus time for a single flow cycle ... 209 Figure 9. 3 a-1) Boundary conditions and positions of horizontal sampling parts, a-2)
horizontal sampling parts, b-1) positions of vertical sampling sections, and b-2) vertical sampling sections ... 211 Figure 9. 4 a) Flow profile angle and b) the maximum flow mass-averaged kinetic energy in each flow cycle versus number of flow cycles ... 213 Figure 9. 5 Maximum overall flow a) displacement, b) velocity, and c) mass-averaged kinetic energy versus suspending fluid plastic viscosity... 213 Figure 9. 6 The variation of COV of particle contents in five horizontal sections versus a) number of flow cycles for different suspending fluid plastic viscosity, and b) suspending fluid plastic viscosity for 1 and 6 flow cycles ... 215 Figure 9. 7 Maximum typical inertia stress values in each flow cycles for different values of suspending fluid viscosity ... 216 Figure 9. 8 Variation of the horizontal dynamic segregation index (H.D.S.I.) with, a) number of flow cycles and different suspending fluid plastic viscosity, and b) suspending fluid plastic viscosity for 1 and 6 flow cycles ... 218 Figure 9. 9 Initial positions of nine representative 20-mm diameter particles, colored in black ... 219 Figure 9. 10 The variation of the maximum displacement of suspending fluid and typical particles located in three horizontal sections (tilt up, middle, and tilt down) and three vertical layers a) top, b) middle, and c) bottom with the plastic viscosity of suspending fluid ... 221 Figure 9. 11 Maximum flow velocity versus maximum flow strain rate ... 223 Figure 9. 12 Vertical dynamic segregation index (V.D.S.I.) versus the number of flow cycles ... 225 Figure 9. 13 Vertical dynamic segregation index after 6 flow cycles (V.D.S.I.final) versus plastic viscosity of suspending fluid ... 225 Figure 9. 14 H.D.S.I.final versus V.D.S.I.final ... 226
xvii
Figure 9. 15 Classification of modelled suspensions based on “performability” properties: the maximum dynamic stability indices in both horizontal and vertical directions versus the maximum magnitudes of a) flow velocity and b) mass-averaged kinetic energy ... 229 Figure 10. 1 Maximum flow velocity versus a) plastic viscosity (where τ0 = 75 Pa), and b) yield stress (where µp = 10 Pa.s) of suspending fluid in L-Box and T-Box test set-ups ... 234 Figure 10. 2 Maximum flow strain rate versus a) plastic viscosity (where τ0 = 75 Pa), and b) yield stress (where µp = 10 Pa.s) of suspending fluid in L-Box and T-Box test set-ups ... 235 Figure 10. 3 Maximum mass-averaged kinetic energy magnitudes versus a) plastic viscosity (where τ0 = 75 Pa), and b) yield stress (where µp = 10 Pa.s) of suspending fluid in L-Box and T-Box test set-ups ... 237 Figure 10. 4 Horizontal dynamic segregation index versus a) plastic viscosity (where τ0 = 75 Pa), and b) yield stress (where µp = 10 Pa.s) of suspending fluid in L-Box and T-Box test set-ups ... 238 Figure 10. 5 The ratio of vertical dynamic segregation index to horizontal dynamic segregation index versus a) plastic viscosity (where τ0 = 75 Pa), and b) yield stress (where µp = 10 Pa.s) of suspending fluid in L-Box and T-Box test set-ups ... 239
xix
LIST OF TABLES
Table 2. 1 Equations relating shear stress and shear rate, proposed for cement based materials suspensions ... 14 Table 2. 2 Slump flow and T50 parameter determination, dark cells indicates risk of problem zones [78] ... 24 Table 2. 3 V-funnel time parameter determination, dark cells indicates risk of problem zones [78] ... 26 Table 2. 4 Blocking assessment, based on the difference between slump flow and J-ring flow [82] ... 28 Table 2. 5 Degree of static segregation resistance [87] ... 35 Table 2. 6 Analytical and empirical models relating yield stress, slump and slum flow spread ... 46 Table 2. 7 Analytical and empirical models relating yield stress and slump flow ... 46 Table 2. 8 Single fluid CFD numerical simulations of workability tests, software, and
numerical methods used by the researchers ... 56 Table 2. 9 Numerical simulations of casting of SCC as a single fluid, homogeneous material 57 Table 2. 10 Numerical simulations of SCC flow using DEM ... 60 Table 2. 11 Numerical simulations of SCC flow using SPH method... 63 Table 5. 1 Values of the constant k for different power law indices ... 101 Table 5. 2 SCC mixtures proportioning ... 104 Table 5. 3 Workability results of investigated SCC mixtures ... 106 Table 5. 4 Experimental results of L-box tests and rheological parameters of the investigated SCC mixtures, approximated by the Bingham and Herschel-Bulkley models... 107 Table 5. 5 Ranges of estimation coefficients of the theoretical models for different waiting time values ... 119 Table 6. 1 SCC mixtures proportioning and rheological properties ... 126 Table 7. 1 Classification of modelled mixtures according to filling ability aspects ... 173 Table 8. 1 Vertical dynamic segregation indexes of 4.6% and 8.7% particle contents and numbers of obstacles (3 and 18 bars) ... 199 Table 9. 1 Flowability properties and dynamic segregation for different yield stress values of the suspending fluid with constant viscosity of 10 Pa.s (µp is the plastic viscosity and τ0 is the yield stress of the suspending fluid) ... 227
xxi
NOTATIONS
Symbol Definition
γ Maximum shear rate
h(ξ, t) and x (t) Positive perturbation variables in Dam Break theory formulation Characteristic flow time to indicate flowability
Characteristic flow time to indicate gravitational segregation Characteristic flow time to indicate shear-induced segregation Shear rate
Viscosity at very high shear rate
∗ Apparent Bingham yield stress
µapp Apparent viscosity
µp Bingham plastic viscosity
A Surface area
A(t) Cross-sectional area in the flow time t
B Bingham number
CAT and CAB Mass of coarse aggregate in the top and bottom sections of the column of segregation, respectively
D Typical dimension of the flow
D1 and D2 Final diameters of the spread concrete in two perpendicular directions in slump flow test
d2 and d1 Final and initial reading of the probe head positions Displmax(i) The maximum total displacement of the particle i DisplX(i) Displacements of particle i in x direction
DisplY(i) Displacements of particle i in y direction DisplZ(i) Displacements of particle i in z direction E(ξ) Perturbation function
F Force
g Gravitational acceleration
G Shear elasticity modulus
h Fluid thickness
H Characteristic fluid depth in the Dam Break Theory formulation
h(x,t) Dimensionless profile thickness at dimensionless location x and flow time t h0 Maximum profile thickness at the casting point in LCPC Box
H1 and H2 Thickness of the final profile at the back wall and end of L-Box set-up, respectively
H10 cm Depth of concrete at the entrance of the horizontal channel of L-Box h∞(x) Final profile function at static state
hcritical The critical flow thickness of segregation
hinitial Initial head in vertical compartment of L-Box
Hparticles Distance between two particles Hplates Distance between two parallel plates
i Horizontal sampling part in L-Box
I30 cm Initial average inertia stress in the first 30 cm in L-Box set-up
j Number of reinforcing bars in L-Box set-up
K Consistency
k Initial coarse particle content of modelled concrete suspension Ki The stiffness factor of spring i in Hooke’s law
L Fluid spread length in LCPC Box
L Characteristic length in the Dam Break Theory formulation
l0 Width of LCPC Box channel
Lmax The maximum flow distance in the horizontal leg of the L-Box
m Mass
n Power index
N The number of measurements at different locations from the opening gate in L-Box test
P Pressure
Pd Penetration depth
Q(t) Flow rate of the mixture in the flow time t
R and R’ Radius of the bottom surface before and after the slump test R1 and R2 Heights of SCC in both columns of U-Box set-up
Re Reynolds number
S Static segregation, measured in column of segregation
Sf Slump flow spread
Sl Vertical slump value
t Time
T30 cm The flow time needed to the front of profile reaches 30 cm after the opening gate in L-Box test
T40 cm Time values taken by the flow front to reach 40 cm after the sliding door in L-Box test
T50cm Flow time needed for the concrete to reach a spread value of 50 cm in slump flow test
U Velocity scale toward the positive x′ direction
V Velocity
V30 cm Average flow velocity of the mixtures in the first 30 cm in L-Box set-up Vf(t) Estimated velocity of the flow front at the end of each ∆t = 1-s time step Vi Velocity made by the displacement of the spring i
Vinitial Initial velocity
Vmax Maximum flow velocity
Vs(t) Estimated velocity of the flow surface at the vertical part, and at the end of each ∆t = 1-s time step
W SPH kernel function
w/p Ratio of water to powder materials xa (t) Active length
xf (t) Dimensionless front position of flow
xf (t) and xy (t) Instantaneous positions of the front of the flow and yield point, respectively Xf(t) Horizontal positions of the flow front in the horizontal channel at the end of
the 1-s time step after passing flow time t
Xf(t-1) Horizontal positions of the flow front in the horizontal channel at beginning of the 1-s time step after passing flow time t
Xfront Front position of the flow
Z Flow thickness
Zs(t) The vertical levels of the flow front in the horizontal channel at the end of the 1-s time step after passing flow time t
Zs(t-1) The vertical levels of the flow front in the horizontal channel at beginning of the 1-s time step after passing flow time t
γ Shear strain
δ Strain
∆xi Displacement of spring i
∆ρ Density gradient between the particles and the suspending fluid
η Newtonian viscosity
µ0 Tangential viscosity of the suspending fluid in a given shear rate
ρ Density
τ Shear stress
τ0 Bingham yield stress
τapp Apparent yield stress
τH The maximum shear stress acting on the bottom surface of slump test
ϕ Volume fraction of particles
Ω Volume of fluid
xxv
LIST OF ABBREVIATIONS
Abbreviation Definition
B.E. Bar effect
B.I. Blocking index
B.I.max Maximum blocking index CFD Computational fluid dynamics COV Coefficient of variation DEM Discrete elements method
E.H.D.S.I. Extremity horizontal dynamic segregation index E.R. Estimation ratio
FD Finite difference
FEM Finite elements method
FV Finite volume
GMO General moving object technique H.D.S.I. Horizontal dynamic segregation index HRWR High-range water-reducer
I.H.D.S.I. (i) Individual horizontal dynamic segregation index, obtained in the horizontal sampling part i
MSA Maximum size of aggregates P.C.E. Particle content effect
RMSE Root-mean-square error SCC Self-consolidating concrete
SPH Smoothed particles hydrodynamics V.D.S.I. Vertical dynamic segregation index VEA Viscosity enhancing admixture VMA Viscosity modifying agent
1
CHAPTER 1
INTRODUCTION
1.1 Heterogeneous behavior of multiphase suspensions
Heterogeneous properties of multiphase suspensions have significant effects on their flow behavior in various domains, such as debris flows, snow avalanches, hydraulics and hydrology, wastewater engineering, polymers, casting, and other industrial applications [1-8]. On the other hand, separation of solid particles from the fluid part of the suspension has negative effects on quality and performance of the suspensions in the production and transportation procedures, and the destination where they are supposed to be transported or placed. Therefore, flow performance of suspension materials has a wide concern to study in environmental and industrial applications, as well as heterogeneous migration of solid phase through the fluid medium [9-13]. In macro scale, studying the evolution of flow profiles in a given application, from the flow origin till the desired destination such as a formwork to be cast, or environmental domains, can give an insight to modify the flow conditions, designing of the domain, selecting ingredients of the fluid, and optimizing the rheology and workability of the fluid materials. This can lead to save time and the energy needed to perform that application process. The problems in macro scale flowability of the materials can be effected by the potential problems in the micro scales interactions of different phases of the suspensions. For example, segregation of solid particles from the suspension, which is transported by a pipe, can change the rheology of the material, or lead to block the flow section in some local zones. This may affect the flowability of the suspension in macro scale, increase the flow time, and reduce the quality of the material in the destination.
Segregation of solid particles can be due to the gravitational and shear induced particle migrations. Gravitational segregation occurs when there is a gradient in gravitational forces between the coarse particles and the suspending fluid due to a difference of density of the materials [14]. On the other hand, shear-induced segregation is defined as the migration of particles from regions of higher shear rates to the regions of lower shear. This results in a decrease in the viscosity of suspensions after a given shearing period even though the viscosity
of the homogeneous suspending fluid remains constant under a given shear history applied on the suspension [9, 15-17]. Most of the common industrial and environmental suspensions behave as a non-Newtonian fluid. Recently, there is a great interest to study shear-induced migration and gravitational settlement of solid particles suspended in Non-Newtonian suspending fluids [18-21].
1.2 Workability of fresh conventional concrete
Fresh concrete is one of the most complex suspensions of solid particles (i.e., fine and coarse aggregates) in a non-Newtonian suspending fluid (i.e., cement paste or mortar matrix). Concrete is the most widely used construction material in the world [22]. Concrete is produced in over than 2 billion tons per year. By 2050, concrete use is expected to reach four times the volume of concrete produced in 1990 level. However, due to low flowability of conventional concrete, its use is limited in the case of special applications, such as high rise buildings, casting of thin and complicated shape sections in architectural applications, placing concrete in narrow gaps in highly dense reinforced zones in the formwork, repairing applications in the zones with difficult access, and under water concreting. Because of low fluidity properties of fresh conventional concrete, high amount of energy is needed to consolidate the concrete in the formwork. Application of vibrations can result in high noise pollution, construction period, and cost. Even in presence of vibrators, there is still high risks of segregation and blocking of the concrete during placement process. Therefore, due to the low stability and consequently low durability, long placement time, high number of labor needed to place the concrete, and expensive casting process of conventional concrete, a novel type of concrete with higher fluidity was necessary to be developed [23].
1.3 Self-consolidating concrete (SCC)
Self-consolidating concrete (SCC) is a novel type of concrete which can flow and consolidate into every corner of a formwork, purely by means of its own weight and without the need for vibration. SCC was developed in 1980s in Japan and then widely used in several applications, such as precast industry, high rise building constructions, casting tunnel linings, and under water
3
concreting. SCC has pushed back traditional limits concerning the casting of densely reinforced and complex structural elements in concrete construction. SCC can flow through narrow gaps in the formwork, between reinforcing bars obstacles or the formwork walls, which are not reachable for conventional concrete, while it maintains its homogeneity [23-26].
SCC behaves as a visco-elastoplastic material with yield stress. The existence of yield stress introduces a certain discontinuity between the flowing and stationary SCC. The evolution of the flow and the shape of free-surface profile are therefore dependent on the rheological behavior of SCC mixtures. In order to achieve higher flowability and passing ability, the rheological parameters of SCC, such as yield stress and plastic viscosity, should be significantly less than conventional concrete [27].
Higher fluidity of SCC (i.e., flowability) compared to the conventional concrete makes it more sensitive to segregation during flow (i.e., dynamic segregation) and thereafter at rest (i.e., static segregation) [28-30]. Dynamic segregation can be even more critical in presence of reinforcing bars obstacles, when concrete mixtures flows in narrow spaces between the bars (i.e., passing ability), especially for highly congested sections [30-32]. Therefore, there is always a need to establish a trade-off between flowability, passing ability, and stability properties of SCC given the mixture proportioning, formwork design, and configuration of casting procedure [24]. This is called workability design [33-35].
1.4 Workability design
An efficient and inexpensive workability design consists in predicting and optimizing the workability of the concrete mixtures for the selected construction processes, such as transportation, pumping, casting, compaction, finishing, etc [35]. Indeed, the mixture proportions should ensure the construction quality demands, such as demanded levels of flowability, passing ability, filling ability, and stability (dynamic and static). Therefore, the casting quality demands, construction conditions and methods, geometry of the formwork, and reinforcing bars configurations are the inputs of the workability design process. The workability of the mixtures should be examined experimentally or theoretically to confirm that the
demanded flow performance conditions are satisfied. Otherwise, the mixture proportions or the construction conditions should be optimized. The workability experimental tests are often carried out (i.e., empirical tools) to simulate experimentally the workability of the investigated SCC mixtures in a smaller scale to establish the workability design. For example, slump flow and V-Funnel tests can be used to examine flowability of SCC. L-Box and J-Ring tests can evaluate passing ability of SCC mixtures between reinforcing bars obstacles [23-25]. On the other hand, T-Box test set-up can be used to measure dynamic stability of fresh SCC [36-38]. However, experimental tests can be time consuming and inaccurate due to possible human errors. Therefore, theoretical tools can be used as an alternative to simulate flow performance of SCC in various empirical tests and casting processes and facilitate workability design process.
1.5 Theoretical flow analysis of SCC
Theoretical tools are useful to assess under what conditions the construction quality demands are satisfied. Accordingly, the analytical [39-41] and numerical models [29, 42-48] have been carried out to predict flow performance of SCC in workability tests and casting processes. Regarding the complexity of the SCC flow in the formworks, analytical models were mostly developed to predict the final profile of SCC in workability tests, such as slump flow and L-Box tests using dimensional analysis and 2nd Newton’s law. On the other hand, the numerical modeling of the flow of concrete presents a great challenge because of the necessity to take into account the complex interactions between the various solid particles in the system, solid obstacles and formwork walls, while simultaneously solving the Navier-Stokes equations for the incompressible liquid phase in which they are immersed. Therefore, it is necessary to consider some simplifying assumptions to convert the physical points, materials, and geometry information to the computational nodes, numbers, matrixes, and boundary conditions. According to the literature, the material and geometry can be discretized by the mesh cells or mesh-less particle based methods. On the other hand, the concrete mixture can be assumed as a single homogeneous fluid, discrete elements, or distinct particles. Recently, there is a great interest to carry out numerical simulations to predict flow characteristics of SCC as a homogeneous or heterogeneous material. An extensive comprehensive review regarding numerical simulation of fresh concrete flow can be found in [48].
5
1.6 Originality of this study
There is always an understanding conceptual gap between the theoretical predictions, which were obtained using computational simplifications, and physical/empirical results of workability of SCC mixtures. This is due to the lack in understanding the clear physical meaning of the numerical results. On the other hand, due to the limits in calculation capacity of the current computers, numerical simulation of whole casting process of SCC as a heterogeneous material in full size elements is impossible. Moreover, for the huge flow problems, plenty of simplifications and assumption can lead to accumulated computational errors. This can affect the accuracy of the predicting models to properly describe the physical phenomena.
Therefore, this research is dedicated to relate computational fluid dynamics (CFD) simulations of two main workability tests (i.e., L-Box and T-Box set-ups) of SCC, simulated as a heterogeneous material, to the construction quality demands, such as flowability, passing ability, filling ability, shear-induced and gravitational dynamic stability. On the other hand, the results of numerical simulations of SCC casting, where SCC is modeled as a single homogeneous fluid, are used to determine the critical zones corresponding to the higher risks of segregation and blocking. Moreover, the effects of rheological parameters, density, and particle contents of SCC, as well as configuration of reinforcing bars, and particle-bar interactions on flow performance of SCC are evaluated using CFD simulations.
The core of the study is statistic evaluation of the results obtained by numerical simulations of L-box and T-Box tests. The main novelty of the paper is the methodology of estimating the degree of segregation and blocking depending on the parameters under investigation, including particle content and number of reinforcing bars. On the other hand, a new analytical approach is proposed to predict flow surface profile of SCC as a homogeneous material, in a modified L-Box set-up, using Dam Break Theory, for Bingham and Herschel-Bulkley rheological models.
1.7 Outline of the thesis
According to the state of the art of the studies carried out on numerical simulations on the flow of SCC (presented in Chapter 2), the originality and objectives of this study are presented in
Chapter 3. The Dam Break Theory and a CFD software (FLOW3D® using Volume of Fluid,
VOF method) are employed in order to develop analytical and numerical simulations, respectively. The specifications of the applied theoretical models and methods are presented in
Chapter 4. The main objectives and the remaining chapters of this thesis are as follows:
• Chapter 5: Analytical and numerical modeling of flow performance of self-consolidating concrete using the Dam Break Theory and CFD. In this chapter, a new analytical model is proposed to predict the evolution of free surface profile of various SCC mixtures in a modified L-Box set-up using the Dam Break Theory. The results of the analytical models are compared for both Bingham and Herschel-Bulkley rheological models. A CFD software (FLOW3D®) is also employed to simulate numerically the flow performance of SCC in the modified L-Box apparatus. The results of this chapter were submitted as a journal paper to the journal of “Computers and Concrete”.
• Chapter 6: Homogeneous analysis of self-Consolidating Concrete (SCC) casting in reinforced beam using computational fluid dynamics (CFD). In this chapter, the flow is simulated to predict flow behavior of various SCC mixtures in a reinforced beam. The effect of rheological parameters on flow performance of the investigated mixtures are also evaluated using numerical results. The results of this chapter were submitted as a journal paper to the journal of “Construction and Building Materials”.
• Chapter 7: Numerical simulation of self-consolidating concrete flow as a heterogeneous material in L-Box set-up - Effect of rheological parameters on flow performance. In this chapter, the effect of rheological parameters and density of suspending fluid of the concrete mixtures on flowability, passing ability, and dynamic stability of SCC in L-Box test are evaluated. SCC mixtures are simulated as heterogeneous materials. The results of
7
this chapter were submitted as a journal paper to the journal of “Cement and Concrete Composites”.
• Chapter 8: Numerical Simulation of self-Consolidating concrete flow as a heterogeneous material in L-Box set-up - Coupled effect of reinforcing bars and aggregate content on flow characteristics: The interaction of different contents of coarse aggregate in presence of different configuration of reinforcing bar obstacles and their coupled effect on flow characteristics of SCC as a heterogeneous suspension are evaluated by CFD simulations in this chapter. The results of this chapter were submitted as a journal paper to the journal of “Materials and Structures”.
• Chapter 9: Numerical simulation of dynamic segregation of self-consolidating concrete in T-Box set-up. The Effect of rheological parameters on flowability and dynamic stability of SCC in absence of reinforcing bars is simulated and analyzed using T-Box test set-up. The results of this chapter were submitted as a journal paper to the journal of “Computers and Concrete”.
• Chapter 10: Comparison between flow performance of SCC as a heterogeneous material in L-Box and T-Box set-ups using numerical simulations. The effect of rheological parameters on flow behavior of SCC in L-Box and T-Box set-ups, i.e., in presence and in absence of reinforcing bars are simulated and the obtained results are compared.
According to each phase of this study, the main conclusions and recommendations for future researches are presented in Chapters 11 and 12, respectively.
9
CHAPTER 2
STATE OF THE ART
2.1 Rheology of non-Newtonian materials
Rheology is defined as the science of deformation and flow of matter. It describes the relationship between forces, deformations, and time. It is applied to more or less fluid materials, or materials that exhibit a time-dependent response to stress. An important issue of rheology is the definition and classification of materials [49-51]. The rheological behavior of fluids can be expressed by the shear stress-shear strain rate relationship. As can be observed in Fig. 2.1, a thin layer of a fluid contained between two parallel planes with a distance of h, having surface area of A, and subjected to a shear force F is considered. Applying this shear force can result in a relative displacement of the planes with a velocity of Vx, and consequently, displacements of δ and γ of the fluid, in the direction of the relative velocity Vx and angular rotation, respectively. Accordingly, corresponded shear stress, shear strain, and shear rate magnitudes can be calculated using Eq. 2.1, 2.2, and 2.3, respectively.
Figure 2. 1 Schematic of shearing flow
= / (2.1)
= /ℎ (2.2)
where τ is the resulted shear stress due to the application of force F on the surface area of A, γ is the shear strain, h is the fluid layer thickness, and is the corresponding shear rate.
Correlating the values of shear stress to shear rate magnitudes (i.e., flow curve) can lead to classifying the materials based on their rheological behavior. Accordingly, the materials under steady shear flow conditions (equilibrium state), may exhibit certain behaviors over a limited range of shear rates. Additionally, some materials may exhibit more than one distinct behavior over different shear rate regions of the flow curve. Therefore, several types of behavior can be classified according to their characteristic shape (Fig. 2.2). The following classification system covers the most frequently encountered flow types, divided in terms of Newtonian, general non- Newtonian, and visco-elastoplastic non-Newtonian fluids. It must be noted that derivation of the fitted curves at each shear rate is called plastic viscosity (µp) as follows:
= (2.4)
On the other hand, the apparent viscosity is defined by the ratio of the shear stress value to its corresponding shear rate, as follows:
= (2.5)
11
Figure 2. 2 Different rheological behaviors of the fluid
1. Newtonian fluid: In the simplest type of flow, termed Newtonian, the material’s viscosity is
constant and independent of the shear rate [49-51]. When shear stress (τ) is plotted against shear rate ( ) at a given temperature, the plot shows a straight line with a constant slope (curve no. 1 in Fig. 2.2). This slope is called the Newtonian viscosity (η) of the fluid. On the other hand, no yield shear stress is necessary for the fluid to start the flow in plastic state (i.e., ℎ = 0 ⇒ = 0). The simplest constitutive equation is Newton’s law of viscosity:
= . (2.6)
In the case of this model, a single point measurement, with a corresponding pair of values of τ and , would serve to rheologically define a Newtonian fluid. All gases and common liquids such as ethanol, water and most oils are Newtonian. Also, liquids and solutions of substances with low molecular weight materials in liquids, e.g. solutions of sugar or salt, are usually Newtonian.
2. General non-Newtonian: Any fluids that do not obey the Newtonian relationship between
shear stress and shear rate are non-Newtonian. Rheology is generally devoted to the study the behavior of such fluids. Suspensions of fine particles are usually non-Newtonian [49-51]. In the case of general non-Newtonian fluids, the slope of the shear stress versus shear rate plot is not constant. In this case, the material shows a non-linear rheological behavior. However, the
material does not need any critical shear stress to initiate the flow. Two different types of non-Newtonian behavior include:
a) Shear-thickening: In this case, the plastic viscosity of the fluid increases continuously with
shear rate.
b) Shear-thinning: This corresponds to the behavior where plastic viscosity decreases
continuously with shear rate.
3. Visco-elastoplastic non-Newtonian fluids: In order to initiate the flow of a
visco-elastoplastic material, the yield stress value is necessary to be exceeded. Therefore, before reaching this value of shear stress, the material behaves like an elastic solid. Once the applied shear stress exceeds the yield stress (τ > τapp), the visco-elastoplastic fluid flows just like a normal fluid in the plastic state, as follows:
a, b) Shear-thickening and shear-thinning with yield-response: The plastic viscosity
increases and decreases, respectively, with shear rate once the apparent yield stress (τapp) has been exceeded.
c) Bingham plastic (ideal): Above the Bingham yield stress (τ0) the plastic viscosity is constant and is called the Bingham plastic viscosity.
4. Bingham plastic (non-ideal): Above the apparent yield stress, the plastic viscosity decreases
continuously and approaches a constant value with increasing shear rate. Extrapolation of the flow curve from the linear region (plastic region) to the stress axis gives the apparent Bingham yield stress ( ∗ ) and the plastic viscosity (µp).
2.2 Rheological models of cement based materials
By using a mathematical relationship, a fluid can be rheologically characterized by viscosity and yield stress. The models that are presented in this section are used to characterize the
non-13
Newtonian behavior of fluids in equilibrium, under steady shear flow conditions at constant pressure and temperature. Table 2.1 gives the most commonly used equations to describe the flow of cement based materials as a non-Newtonian fluid. The most frequently used fundamental models for cement based suspensions are Bingham and Herschel-Bulkley models.
2.2.1 Bingham model
Some materials exhibit an infinite viscosity until a sufficiently high stress is applied to initiate flow. Above this stress (i.e. yield stress) the material then shows simple Newtonian flow. The simplest model covering these types of viscoplastic fluids with a yield response is the ideal Bingham model, and is expressed by the following two-parameters model:
= + . (2.7)
Where, τ0 and µp are the Bingham yield stress and plastic viscosity parameters, respectively. The Bingham model can describe the viscosity characteristics of a fluid with yield stress whose viscosity is independent of shear rate. Therefore, the Bingham plastic model does not have the ability to handle the shear-thinning characteristics of general non-Newtonian fluids. Many concentrated particle suspensions and colloidal systems, such as mortar and concrete, exhibit Bingham behavior at limited ranges of shear rate.
Table 2. 1 Equations relating shear stress and shear rate, proposed for cement based materials suspensions
Model Analytical equation
Newtonian [52] = . (2.6) Bingham [53] = + . (2.7) Modified Bingham [54] = + . + . (2.8) Power law equations [55] = . (2.9)
= 1 ⇒
< 1 ⇒ ℎ ℎ > 1 ⇒ ℎ ℎ
Herschel Bulkley [56] = + . (2.10) Vom Berg, and Ostwald-De Waele [57] = + sinh ( / ) (2.11) Robertson-Stiff [58] = ( + ) (2.12) Atzeni et al. [59] = . + . + (2.13)
Casson [60] = + . + 2 . (2.14)
De Kee [54] = + . . (2.15) Yahia, and Khayat [61] = + 2 . . . (2.16) Variable definitions: ∶ ℎ ∶ , ∶ , , , , , , , ∶ ∶ ℎ ∶ ∶ − ∶ ℎ ℎ ℎ
2.2.2 Herschel-Bulkley model
Herschel-Bulkley model is a three-parameters model used to describe viscoplastic materials exhibiting a yield response with a shear-thinning/shear-thickening behavior above the yield stress. It is a combination of Power-law and Bingham, and is expressed as:
15
Where, K is the consistency and n index indicates the degree of non-Newtonian behavior of the material (the greater the departure from unity, the more pronounced the non-Newtonian properties of the material). When n = 1, Herschel-Bulkley is reduced to the equation for the Bingham. The Herschel-Bulkley model provides a more realistic prediction of flow over a wider range of conditions than the Bingham model. It is often applied to industrial fluids (e.g. biological fluids, food and cosmetics), where it is used for specifying conditions in the design of process plants.
2.3 Rheology of different cementitious materials
The satisfactory performance of cement-based materials depends on their facility to transport and cast in fresh state. The most important processes using cementitious materials are transportation, pumping, pouring, injection, spraying (shotcreteing), self-leveling, hand troweling, casting, consolidating, and finishing. All of these practical applications depend on the rheology of the mixtures, according to various aspects:
• Flowability on the surfaces, considering frictional resistance. • Adhesion.
• Resistance against water bleeding, as a result of settlement of the coarser particles. • Resistance against shear-induced heterogeneity of coarser particles during flow. • Resistance against blocking of the coarse particles in narrow gaps of the formwork. • Lower water contents, in order to obtain higher mechanical strength, as well as less
porosity and, consequently, higher durability properties. • Low lateral pressure exerted on the formwork.
Accordingly, this section discusses on the rheology of cement-based materials, including cement paste, mortar, and concrete in fresh state.
![Figure 2. 6 Schematics of slump flow test for evaluating flowability of SCC [80]](https://thumb-eu.123doks.com/thumbv2/123doknet/3574904.104757/53.918.132.810.292.544/figure-schematics-slump-flow-test-evaluating-flowability-scc.webp)
![Figure 2. 7 Schematics of V-funnel test for evaluating flowability of SCC [23-25]](https://thumb-eu.123doks.com/thumbv2/123doknet/3574904.104757/55.918.224.719.197.591/figure-schematics-v-funnel-test-evaluating-flowability-scc.webp)
![Figure 2. 11 Schematics of L-box test set-up and reinforcement bars details [23-25. 78]](https://thumb-eu.123doks.com/thumbv2/123doknet/3574904.104757/61.918.134.808.106.369/figure-schematics-box-test-set-reinforcement-bars-details.webp)