DISSOCIATIVE IONIZATION BY LOW ENERGY ELECTRON
IMPACT. ENERGY DISTRIBUTION AND APPEARANCE ENERGY OF
DOUBLY IONIZED FRAGMENTS FROM N
2AND O
2R. LOCHT and J. MOMΓGNY
Département de Chimie Générale et de Chimie-Physique, Institut de Chimie, Université de Liège, B-4000 Liège I, Belgium
Ion energy distributions and threshold energies are measured for the appearance of N2+ from N2.To our
knowledge the same data are measured for the first time on O2+ from O2. For both ions a thermal peak is
observed in the ion energy distribution having an onset at (61.1 ± 0.5) eV and (60.5 ± 0.8) eV for the N2+ ion and the O2+ ion respectively. The appearance energy of higher energetic ions is measured and interpreted.
Since the paper of Hagstrum [1] in 1941 only a few studies were concerned with the formation of doubly ionized species. After a large time gap of about two decades, Kieffer and van Brunt [2] observed N2+ ions formed by electron impact on N2. The appearance energy as well as the kinetic energy distribution of this ion
have been measured. Crowe and McConkey [3] and Deleanu et al. [4] revised the N2+ ion formation by electron impact on N2 and measured the angular dependence of the ion energy distribution. However a large discrepancy
exists between the appearance energy for N2+ measured by these authors. Furthermore, though the authors have purposely searched for [3], no thermal ions have been observed in the N2+ ion energy distribution. Recently Edwards et al. [5] measured N2+ ion energy distributions formed by 1 MeV H+ and He+ ion impact on N2. Hurley
[6] made theoretical predictions of potential energy curves for doubly positive diatomic ions such as N22+,O22+
and NO2+.
To our knowledge, no data obtained in comparable experimental conditions have been published about O2+ formation from O2. We investigated N
2+
from N2 and O 2+
from O2 for three reasons: (i) to try to elucidate the
existing discrepancy between the measured appearance energies, (ii) to find out whether N2+ thermal ions are formed or not and finally (iii) to measure the same data for O2+ from molecular oxygen.
The instrument used as well as the experimental conditions have extensively been described elsewhere [7,8]. To avoid a too quick burn-out of the filament due to the presence of oxygen, all the data reported here were obtained with an electron beam intensity of 1 µA and at a total pressure of 2 x 10⁻⁷- 4 x 10⁻⁷ Torr of air dried in a liquid nitrogen trap. Previous experiments [3,4] were performed at pressures of two orders of magnitude higher. Because of the low intensity of the N2+ and O2+ signals, (i) the ion accelerating voltage has been set at 4 V or 5 V at the expense of the kinetic energy resolution and (ii) the signals stored in a multichannel analyser have been averaged during 48—80 h and all critical energies are obtained from at least 5 independent measurements.
For the N2+ ions formed by dissociative ionization of N
2, fig. 1 shows the ion energy distribution as
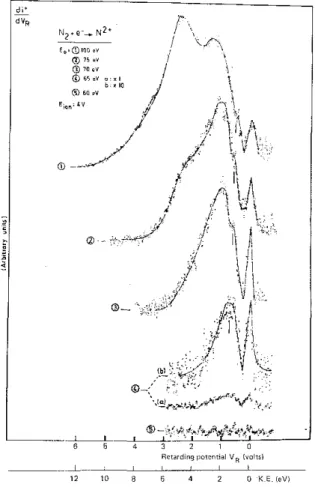
observed for different electron energies ranging from 60—100 eV. Peak maxima are measured at thermal energy with low intensity at high electron energy, at (1.2 ± 0.1) eV, (3.0 ± 0.1) eV, (4.1 ± 0.1) eV and around 7 eV. The peak observed at 4.1 eV for 75 eV and 80 eV electron energy shifts to 4.8 eV at 100 eV electron energy. Crowe et al. [3] mention peak maxima at 2.9 eV, 5.1 eV and 7.9 eV. Edwards et al. [5] using a 1 MeV H+ ion beam found structures at (2.3 ± 0.5) eV, (5.3 ± 0.3) eV and (10.2 ± 0.5) eV in the N2+ ion energy distribution. With a He+ beam [5] the distribution is modified and peak maxima were measured at (4.2 ± 0.5) eV, (6.6 ± 0.3) eV, (12.1 ± 0.5) eV and at (16.0 ± 0.6) eV.
In the present experiment the existence of thermal N2+ ions is confirmed at all electron energies and their relative intensity increases from 100 eV to an energy close to threshold (see fig. 1). The peak at 1.2 eV, only slightly visible as a shoulder at high electron energies in the 3.0 eV peak, is well resolved and isolated at 65 eV electron energy. The second important feature is that the N2+ signal is not observed at 60 eV electron energy.
Fig. 1. N2+/N2 ion energy distributions observed for 100, 75, 70, 65, and 60 eV electron energy.
The baseline reproduced in fig. 1 and recorded for 60 eV electron energy, as well as the signal at 65 eV are obtained after 80 h of accumulation in the multichannel analyser. No doubt remains about the position of the appearance potential of N2+ from N2 between 60 and 65 eV, in drastic disagreement with Deleanu et al. [4] who
measured the threshold at (54 ± 2) eV. However,Kieffer et al. [2] and Crowe et al. [3] measured the appearance energy for the same ion at 61 eV and (60.3 ± 2) eV respectively.
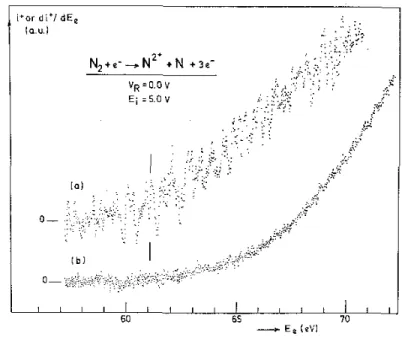
We measured the N2+ electron ionization efficiency curve as well as its first derivative as shown in fig. 2. The energy scale is calibrated with the appearance energy of N+ from N2 at 24.3 eV [8], The lowest threshold
energy, measured by the vanishing current method in the direct curve and the linear extrapolation in the first differentiated curve, is (61.1 ± 0.5) eV. This energy corresponds fairly well to the onset calculated for the process at 60.985 eV, using D00 (N2) = 9.759 eV [9], IP(NI, 4S°)= 14.534eV [10],IP(NII, 3P) = 29.601 eV [10]
and the excitation energy of N2+(4P←2P°)=7.091 eV[ll]. N2+e
→N(4S°)+N2+(4P) + 3e- (1)
This appearance energy characterizes the formation of thermal N2+ ions. The 4S° and 4P terms correlate with singlet, triplet, quintet and septet ∑u,g+ and Πu,g states. Information about the symmetry of the final N22+ state
involved at 61.1 eV could not be provided by the angular distribution measurements of Crowe [3] for the following reasons: (i) no thermal ions are observed and angular distributions are recorded for 2.9 eV ions at electron energies of at least 80 eV and (ii) the validity of Dunn's selection rules is questionable for an excitation process involving three outgoing electrons [12]. The potential curves of N22+ calculated by Hurley [6] are below
the energy range of 60 eV and concern only doubly ionized molecular states converging to dissociation limits giving rise to N+ + N+.
Fig. 2. First differentiated (a) and direct (b) ionization efficiency curve of N2+ obtained at VR= 0 V and ion
accelerating voltage Eion=5V.
maximum observed in the ion energy distribution. The results are summarized in fig. 3. The only comparison which could be made with previous results is the appearance energy measured for the 3.8 eV N2+ ions at around 69 eV by Kieffer et al. [2]. This value has to be compared with our value of (68.7 ± 0.5) eV for 4 eV N2+ ions.
From these measurements we could deduce that probably three ion groups are formed by the same process (1), i.e. those ions carrying a minimum transjational energy of 0.0, 1,2 and 4.0 eV. At 64.7 eV, involving 3.0 eV kinetic energy N2+ ions, a lower lying dissociation limit is probably concerned, e.g.
N2 + e
→ N(2P°) + N2+(2P°) + 3e- , (2) which is calculated at 56.973 eV, using N(2P° ← 4S°) = 3.079 eV [11].
The high energetic N2+ ions (7 eV) appearing at 78.7 eV could be ascribed to one of the processes N2 + e
→ N(2P°/4P) + N2+(4P/2P°) + 3e- , (3)
which lies in the range of 64.064-64.818 eV. In this energy range four dissociation limits exist where the neutral N atom is excited in the 2P°, 4P, 2P and 4P levels and the doubly ionized N2+ is in the 4P or 2P° level. The uncertainty in our measurements does not allow a more precise assignment in the present case.
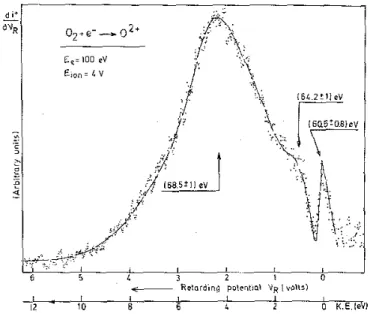
For O2+ ions produced by dissociative electron ionization of O2, fig. 4 shows a typical ion energy
distribution obtained with 100 eV electrons. Three groups of ions are observed at (0.0 ±0.1) eV, (1.4 ± 0.2) eV and (4.4 + 0.1) eV. Down to 70 eV this distribution does not show any appreciable alteration, except a decrease in intensity. The O2+ ion current being five times lower than that of N2+ at 100 eV electron energy, such an intensity made impossible the recording of the first differentiated retarding curve near threshold in a reasonable time.
The direct as well as the first differentiated ionization efficiency curves of O2+ from O2 have been
analyzed as shown in fig. 5. The lowest onset measured by the methods described above, is (60.5 ± 0.8) eV. This energy agrees fairly well with the onset calculated for the process
at 60.552 eV using D00 (O2) = 5.115 eV [9], IP(OI, 3P2) = 13.618eV [10],IP(OI,4S°) = 35.116eV [10] and O(1S
←3P) = 4.190 eV [11] and O2+(1D ←4S°) = 2.513 eV [11]. This onset is related to the formation of thermal energy O2+ ions.
Fig. 3. Onset energy values for the four groups of ions observed in the ion energy distribution recorded for 100 eV electron energy.
Fig. 4. O2+/O2 ion energy distribution observed for 100 eV electron energy. The threshold energy measured for
each ion group is given above the corresponding arrow.
However, the accuracy of the measurements does not allow us to exclude the possibility of transitions to one of the two dissociation limits
O2 + e -
→O(1D) + O2+(1S) + 3e- , (5) O2+e- →O(3P2) + O2+(5S) + 3e- , (6)
for which the threshold is calculated at 61.170 eV and at 61.326 eV respectively (O(1D← 3P2) = 1.967 eV, O2+(lS ← 3P0) =
5.354 eV and O2+(5S ← 3P0) = 7.477 eV [11]).
Fig. 5. First differentiated (a) and direct (b) ionization efficiency curve of O2+ /O2 as recorded at VR= 0 V and
an ion accelerating voltage of Eion = 5 V.
As for N2+ from N2, the appearance energy has been measured for the two other groups of ions observed
in the ion energy distribution (see fig. 4). For the 1.4 eV group, the onset is observed at (64.2 ± 1) eV and a threshold energy of (68.5 + 1) eV has been measured for 4 eV O2+ ions. Within the accuracy of the onset energies, the energy balance indicates that for both ion groups the same dissociation limit is involved.
Acknowledgement
We are indebted to the Fonds National de la Recherche Scientifique and to the Fonds de la Recherche Fondamentale Collective for financial support.
REFERENCES
[1] H.D. Hagstrum and J.T. Tate, Phys. Rev. 59 (1941) 354. [2] LJ. Kieffer and R.J. van Brunt, J. Chem. Phys. 46 (1967) 2728. [3] A. Crowe and J.W. McConkey, J. Phys. B 8 (1975) 1765. [4] L. Deleanu and J.A.D. Stockdale, J. Chem. Phys. 63 (1975) 3898. [5] A.K. Edwards, R.M. Wood and M.F. Steucr, Phys. Rev. 15 (1977)48. [6] A.C. Hurley, J. Mol. Spectry. 9 (1962) 18.
[7] R. Locht and J. Schopman, Intern. J. Mass Spectrom. Ion Phys. 15 (1974) 361. [8] R. Locht, J. Schopman, H. Wankenne and J. Momigny, Chem. Phys. 7 (1975) 393.
[9] B. de B. Darwent, Bond Dissociation Energies in Simple Molecules, NSRDS-NBS 31 (1975).
[10] C.E. Moore, Ionization Potentials, and Ionization Limits Derived from the Analysis of Optical Spectra, NSRDS-NBS 34 (1970).
[11] C.E. Moore, Atomic Energy Levels, NBS Circular 467 (1949). [12] G.H. Dunn, Phys. Rev. Letters 8 (1962) 62.