Promoting international prediction models
through standardization of milk
mid-infrared spectra
Clément Grelet
COMMUNAUTÉ FRANÇAISE DE BELGIQUE ACADÉMIE UNIVERSITAIRE WALLONIE-EUROPE UNIVERSITÉ DE LIÈGE –
GEMBLOUX AGRO-BIO TECH
PROMOTING INTERNATIONAL PREDICTION MODELS THROUGH STANDARDIZATION OF MILK MID-INFRARED SPECTRA
Clément GRELET
Dissertation originale présentée en vue de l’obtention du grade de docteur en sciences agronomiques et ingénierie biologique
Promoteurs: Prof. Hélène Soyeurt & Dr. Pierre Dardenne
Copyright. Aux termes de la loi belge du 30 juin 1994, sur le droit d’auteur et les droits voisins, seul l’auteur a le droit de reproduire partiellement ou complètement cet ouvrage de quelque façon et forme que ce soit ou d’en autoriser la reproduction partielle ou complète de quelque manière et sous quelque forme que ce soit. Toute photocopie ou reproduction sous une autre forme est donc faite en violation de la dite loi et des modifications ultérieures.
Analysis of milk by Fourier transform mid-infrared (FT-MIR) spectrometry provides a large amount of information on the physico-chemical composition of individual milk samples. Hence, it has been used for decades to predict fat, protein and lactose contents, and more recently fine milk composition, milk processing qualities and status of cows. This fast and cost-effective technology is a perfect candidate to provide new information for the management of individual cows. However, its concrete use by field organizations is still suboptimal given the difficulty of sharing data and models among spectrometers. The aim of this research was to optimize the use of FT-MIR analysis of milk with the final purpose of enabling the development of new management tools for dairy farmers.
In order to harmonize spectral responses among instruments and allow sharing of data and models, the first objective was to test a standardization method, well known from the NIR sector, in the frame of FT-MIR spectrometers dedicated to milk analysis. The possibility of standardizing such instruments was assessed by using the Piece-wise Direct Standardization (PDS) method and common raw milk samples constituted from the IDF norm (ISO 9622:2013 | IDF 141:2013). The performances of spectral harmonization were assessed by the transfer of a robust fat model from a master instrument into 21 slave instruments. Regressions were performed between master and each slave fat predictions, before and after PDS. The biases and the root mean square errors between the predictions decreased after PDS from 0.378 to 0.000 and from 0.461 to 0.016 (g of fat/100 mL of milk), respectively. These preliminary results showed that the PDS method permits a reduction of the inherent spectral variability between instruments and the use of common robust models by all the spectrometers included in the constituted network.
The second objective was to ensure that models of interest with low precision could also be transferred from instrument to instrument. The effect of standardization on network spectral reproducibility was assessed on 66 instruments from 3 different brands by comparing the spectral variability of the slave instruments with and without standardization. With standardization, the standardized Mahalanobis distance (GH) between the slaves and master spectra was reduced on average from 2,656 to 14. The transfer of models from instrument to instrument was then tested using 3 FT-MIR models predicting the quantity of daily methane emitted by dairy cows, the concentration of polyunsaturated fatty acids in milk, and the fresh cheese yield. The differences, in terms of root mean squared error, between master and slaves predictions were reduced after standardization on average from 103 to 17 g/d for methane, from 0.032 to 0.005 g/100 mL of milk for polyunsaturated fatty acids, and from 2.55 to 0.49 g of curd/100 g of milk for fresh cheese yield. For all models, an improvement of prediction reproducibility within the network has also been observed. Concretely, the spectral standardization allows the transfer and use of multiple models on all instruments as well as the improvement of spectral and prediction reproducibility within the network. The method offers opportunities for data exchange
as well as the creation and use of common database and models, at an international level, to provide more information for the management of dairy herds.
After ensuring the possibility of using spectral data under optimal conditions, the third objective was to concretize the development of models providing information on cow status to be used as management tools by dairy farmers. This work aimed to develop models to predict milk citrate, reflecting early energy imbalance, and milk acetone and β-hydroxybutyrate (BHB) as indicators of (sub)clinical ketosis. Milk samples were collected in commercial and experimental farms in Luxembourg, France, and Germany. Milk mid-infrared spectra were recorded locally and standardized. Prediction equations were developed using partial least square regression. The coefficient of determination (R²) of cross-validation was 0.73 for acetone, 0.71 for BHB, and 0.90 for citrate with root mean square error of 0.248, 0.109, and 0.70 mmol/L, respectively. Finally, an external validation was performed and R² obtained were 0.67 for acetone, 0.63 for BHB, and 0.86 for citrate, with a root mean square error of validation of 0.196, 0.083, and 0.76 mmol/L, respectively. The results demonstrated the potential of FT-MIR spectrometry to predict citrate content with good accuracy and to supply indicative contents of BHB and acetone in milk, thereby providing rapid and cost-effective tools to manage ketosis and negative energy balance in dairy farms.
This research highlights new knowledge and possibilities regarding the harmonization of spectral format from different instruments in order to create, share and use FT-MIR models providing information for the management of dairy cows. More concretely, it contributes outputs as procedures to standardize instruments in routine and models to predict indicators of negative energy balance and ketosis to help farmers in the management of early lactation period.
L’analyse du lait par spectroscopie moyen infrarouge à transformée de Fourrier (FT-MIR) est une source d’information importante sur la composition physico-chimique des échantillons de lait. Pour cette raison, elle est utilisée depuis des dizaines d’années afin de prédire les teneurs en matières grasses, protéines et lactose du lait, et plus récemment la composition fine du lait, les propriétés technologiques ou encore l’état de la vache. Cette technologie rapide et économique a donc un potentiel élevé dans le but de générer de nouvelles informations permettant d’améliorer la gestion individuelle des vaches laitières au sein des exploitations. Cependant, son utilisation concrète pour le conseil en élevage reste sous-optimal en raison de la difficulté de partager les données et modèles entre spectromètres. Le but de cette recherche a donc été d’optimiser l’utilisation de l’analyse FT-MIR du lait afin de permettre le développement d’outils de gestion pour les éleveurs laitiers.
Afin d’harmoniser les réponses spectrales entre les instruments et de permettre le partage des données et des modèles, le premier objectif a été de tester une méthode de standardisation, utilisée dans le secteur du proche infrarouge, dans le cadre de spectromètres dédiés à l’analyse moyen infrarouge du lait. La méthode Piece-wise Direct Standardization (PDS) a été testée en combinaison avec des échantillons de lait cru générés selon la norme IDF (ISO 9622:2013 | IDF 141:2013). Les performances de cette harmonisation spectrale ont été évaluées en transférant un modèle robuste de prédiction de la matière grasse d’un instrument de référence vers 21 instruments secondaires. Le biais et l’erreur standard ont été réduits après PDS, respectivement de 0.378 à 0.000 et de 0.461 à 0.016 g/100 mL de lait. Ces résultats préliminaires ont montré que l’utilisation de la PDS permet de réduire la variabilité spectrale entre les instruments et d’utiliser des modèles communs sur toutes les machines intégrant le réseau de standardisation.
Le deuxième objectif visait à tester la possibilité de transférer sur différents instruments des modèles d’intérêt ayant une faible précision. L’effet de la standardisation sur la reproductibilité spectrale du réseau a été évalué sur 66 machines provenant de 3 constructeurs, en comparant la variabilité spectrale des instruments secondaires avec ou sans standardisation. Après standardisation, la distance standardisée de Mahalanobis (GH) entre les spectres des appareils référence et secondaires a été réduite de 2 656 à 14. Le transfert de modèles sur différents instruments a été testé en utilisant 3 modèles prédisant la quantité de méthane émis par les vaches laitières, la teneur en acides gras polyinsaturés et le rendement fromager frais du lait. Les différences, en terme d’erreur standard, entre les prédictions des instruments secondaires et de la référence ont été réduites en moyenne après standardisation de 103 à 17 g/j pour le méthane, de 0.032 à 0.005 g/100mL de lait pour les acides gras polyinsaturés et de 2.55 à 0.49 g de caillé/100 g de lait pour le rendement fromager frais. Pour les 3 modèles, une amélioration de la reproductibilité des prédictions au sein du réseau a aussi été observée. Concrètement, la standardisation spectrale permet le transfert et l’utilisation de modèles multiples sur différents instruments, ainsi que l’amélioration de la reproductibilité des spectres et
des prédictions au sein du réseau. Cette méthode ouvre donc des perspectives en terme d’échange de données, de création et d’utilisation de modèles à un niveau international afin de générer plus d’informations pour la gestion des troupeaux laitiers.
Après avoir permis l’utilisation de données spectrales dans des conditions optimalisées, le troisième objectif de ce travail a été de concrétiser le développement de modèles générant des informations sur le statut des vaches laitières afin d’être utilisés comme des outils de gestion de troupeaux. Le but concret de ce travail a été de développer des modèles de prédiction du citrate dans le lait, comme indicateur précoce de balance énergétique négative, ainsi que du BHB et de l’acétone dans le lait, comme indicateurs d’acétonémie (sub)clinique. Pour cela, des échantillons individuels de lait ont été collectés dans des fermes expérimentales et commerciales en France, Allemagne et Luxembourg. Les spectres FT-MIR de lait ont été collectés localement et standardisés dans un format commun. Les équations de prédictions ont été développées en utilisant la Partial Least Square (PLS) régression. Les coefficients de régression obtenus en cross-validation (R²cv) sont de 0.73 pour l’acétone, 0.71 pour le BHB et 0.90 pour le citrate avec une erreur standard (RMSE) respective de 0.248, 0.109 et 0.70 mmol/L. En validation externe, les R² obtenus sont de 0.67 pour l’acétone, 0.63 pour le BHB et 0.86 pour le citrate, avec des erreurs respectives de 0.196, 0.083 et 0.76 mmol/L. Ces résultats montrent le potentiel de la spectroscopie FT-MIR afin de prédire la teneur en citrate avec une bonne précision et de générer des teneurs indicatives en BHB et acétone dans le lait, fournissant ainsi des outils rapides et économiques de gestion de l’acétonémie et de la balance énergétique des vaches en ferme laitière.
Cette recherche apporte de nouvelles connaissances et possibilités en ce qui concerne l’harmonisation du format des spectres provenant de différents instruments, afin de créer, diffuser et utiliser des outils d’aide à la décision pour la gestion des vaches laitières. Plus concrètement, ce travail aura permis de mettre au point une méthode et des procédures afin de standardiser des instruments en routine et de créer des modèles de prédiction de la balance énergétique et de l’acétonémie afin d’aider les éleveurs à mieux gérer le début de lactation des vaches laitières.
Comité de thèse
Promoteurs
Hélène Soyeurt, Université de Liège, Gembloux Agro-Bio Tech Pierre Dardenne, Centre Wallon de Recherches Agronomiques
Membres
Frédéric Dehareng, Centre Wallon de Recherches Agronomiques Nicolas Gengler, Université de Liège, Gembloux Agro-Bio Tech Yves Beckers, Université de Liège, Gembloux Agro-Bio Tech
Juan Antonio Fernandez Pierna, Centre Wallon de Recherches Agronomiques Frédéric Colinet, Université de Liège, Gembloux Agro-Bio Tech
Remerciements
En tout premier lieu à mes Promoteurs, Hélène Soyeurt pour m’avoir incité à réaliser ce travail, l’avoir suivi et l’avoir tiré vers le haut, et à Pierre Dardenne pour m’avoir transmis une partie de son savoir tellement précieux en terme d’infrarouge et de modélisation.
A Frédéric Dehareng, pour m’avoir confié ce boulot, pour la bienveillance, la confiance, pour faire vivre l’équipe et lui permettre de travailler dans une ambiance humaine et décontractée.
Aux membres du comité de thèse qui m’ont guidé au cours de ce travail, Juan Antonio Fernandez pour m’avoir appris Matlab, pour les scripts et pour les précieux conseils touristiques, Vincent Baeten pour l’expertise en spectroscopie et pour l’optimisme sans faille, Nicolas Gengler pour les idées toujours plus innovantes, Catherine Bastin et Frédéric Colinet pour toutes les chouettes collaborations, pour les karaokés absurdes, discussions tardives et autres défis d’EAAP et à Yves Beckers pour avoir accepté de présider le jury.
To Dr. P. Berzaghi, and Pr. J. Bindelle who accepted to provide their experience and time to evaluate this work with an external point of view.
Au CRA-W, à Mr Sinnaeve, Mr Berben et Mr Poismans pour avoir permis de faire ce doctorat. A EMR, aux contrôles laitiers, laboratoires, universités et centres de recherches du projet OptiMIR, pour cette collaboration fructueuse et pour les données utilisées dans ce travail. A Interreg IV-B et à la Région Wallonne pour le financement de ce projet.
Evidemment à l’équipe du labo lait, Amélie, ma colloque de bureau, pour les heures (années ?) de discussion aussi bien scientifiques que sans queue ni tête, Olivier pour sa précieuse expérience dans le domaine laitier et pour refaire le monde de temps à autre, Petimat pour la bonne humeur, pour être la maman du labo, pour travailler sans relâche tout en nous apprenant le russe, Claire pour sa gentillesse et pour la qualité de son travail, Mohammed et Matthieu pour leur amabilité et le renfort bienvenu pour la création des gammes, et Octave qui vient nous enlever une vilaine épine du pied.
A tous les collègues du Henseval, anciens et actuels, pour l’entraide et la bonne ambiance quotidienne, mais aussi pour les désormais incontournables barbecs au ravel, descentes de la less(ff)e et pour me ramener quand je loupe le train ;)
Finalement, et le plus important, à tous les proches, pour m’avoir encouragé à faire un doctorat, ou tout simplement parce qu’ils ont une valeur infinie à mes yeux : Loranne grâce à qui chaque journée est nouvelle et un bonheur, Hugo, petit loulou/rayon de soleil arrivé en cours de route, et tous ceux qui sont là depuis le début (ou très longtemps ;) qui sont indispensable à mon monde : Papa, Maman, Charlotte, Joseph, Loulou, la petite Anna et tout le reste de la famille, tous les zouaves Vendéens, Nalou, Piou, Caro, Anouck, Margaux et Léane, les copains Belges, Katia, Yvo et Paul, les french tocards et tous les autres !
Chapter 1 : General introduction
1
Chapter 2 : Standardization of milk mid-infrared spectra from a European dairy network
14
Chapter 3 : Standardization of milk mid-infrared spectrometers for the transfer and use of multiple models
32
Chapter 4 : Development of Fourier transform mid-infrared calibrations to predict acetone, β-hydroxybutyrate, and citrate contents in bovine milk through a European dairy network
55
Chapter 5 : General discussion
72
Chapter 6 : Perspectives and conclusion
84
Annex
Figures
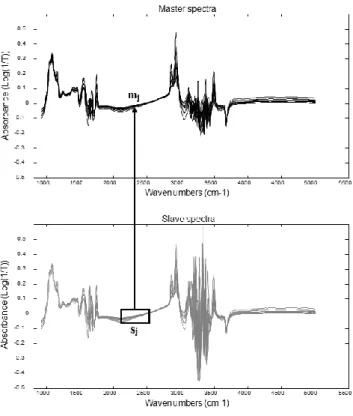
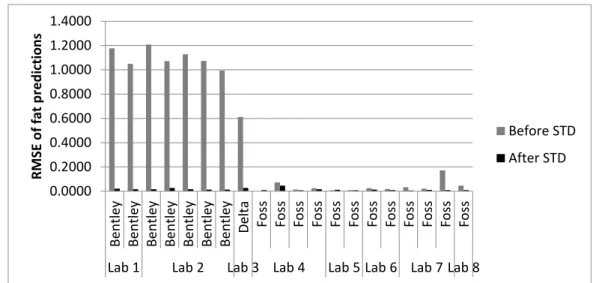
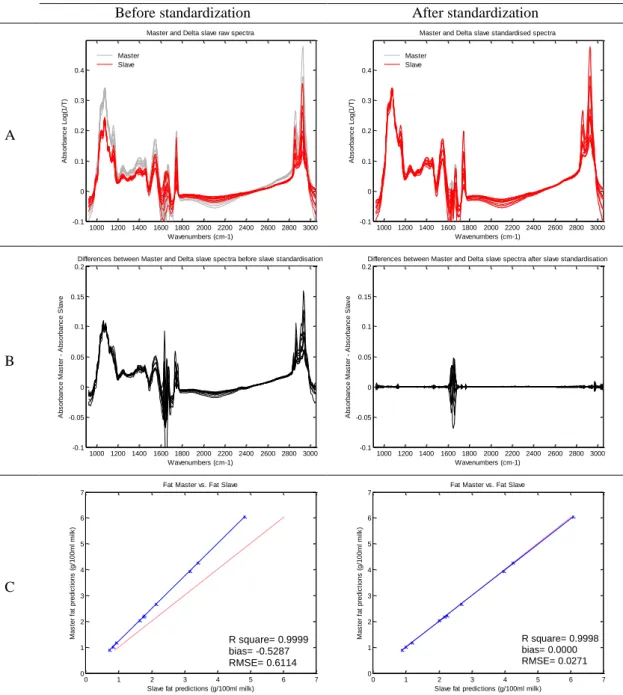
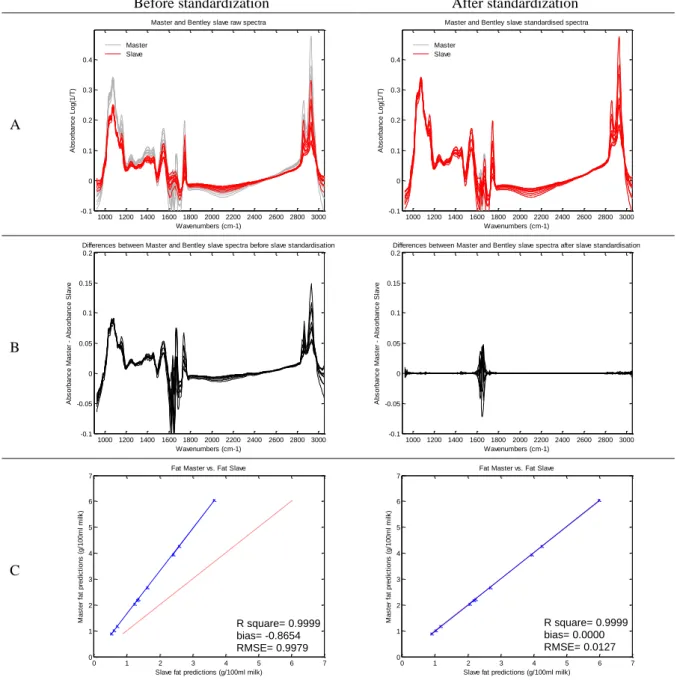
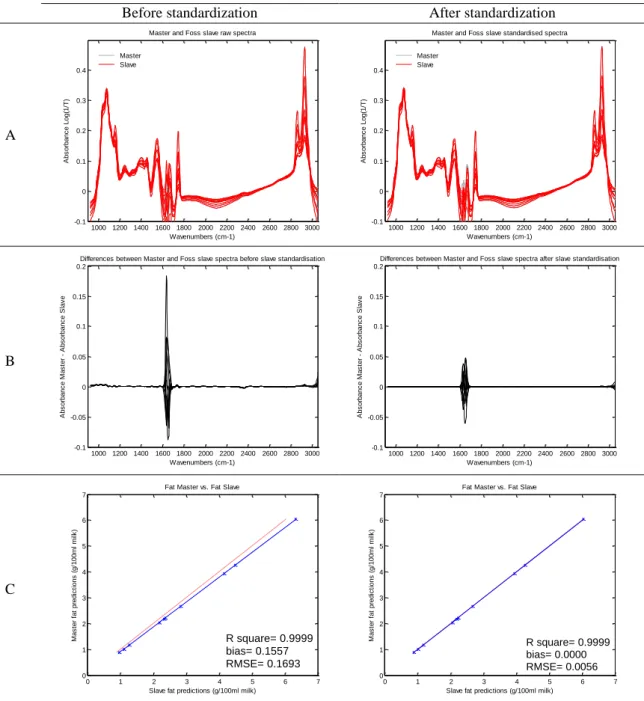
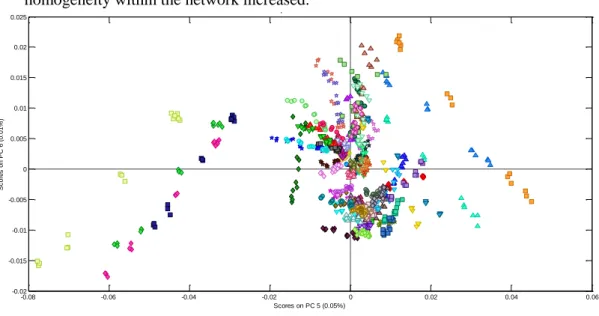
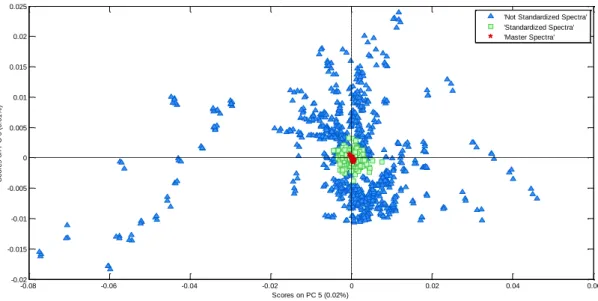
Figure 1-1. Spectrum of a milk sample ... 3 Figure 2-1. Graphical view of the piecewise direct standardization technique. mj = the response measured at wavenumber j on the master instrument; sj = the response measured in a small window of size n around j (neighboring) on the slave instrument; T = transmittance ... 17 Figure 2-2. Raw milk spectrum from the master instrument. T = transmittance ... 18 Figure 2-3. Master milk spectrum with assignment of the main spectral bands, after removal of noise areas from water absorption. T = transmittance. ... 19 Figure 2-4. Root mean square error (RMSE) between predictions of each slave instruments and the master, before and after standardization (n = 20). Before STD = before standardization; After STD = after standardization; Lab = laboratory. Bentley (Chaska, MN), Delta (Drachten, the Netherlands), and Foss (Hillerød, Denmark). . 21 Figure 2-5. Effect of standardization of a Delta (Drachten, the Netherlands) slave spectra on differences with master spectra and on fat predictions. (A) Spectra of the master and a Delta slave instrument before (left) and after standardization (right), from 926 to 3,008 cm−1. (B) Differences between spectra of the master and a Delta slave instrument before (left) and after standardization (right), from 926 to 3,008 cm−1. (C) Comparison of fat predictions by the master and a Delta slave before (left) and after (right) standardization. RMSE = root mean square error. T = transmittance. ... 23 Figure 2-6. Effect of standardization of a Bentley (Chaska, MN) slave spectra on differences with master spectra and on fat predictions. (A) Spectra of the master and a Bentley slave instrument before (left) and after standardization (right), from 926 to 3,008 cm−1. (B) Differences between spectra of the master and a Bentley slave instrument before (left) and after standardization (right), from 926 to 3,008 cm−1. (C) Comparison of fat predictions by the master and a Bentley slave before (left) and after (right) standardization. RMSE = root mean square error. T = transmittance. ... 24 Figure 2-7. Effect of standardization of a Foss (Hillerød, Denmark) slave spectra on differences with master spectra and on fat predictions. (A) Spectra of the master and a Foss slave instrument before (left) and after standardization (right), from 926 to 3,008 cm−1. (B) Differences between spectra of the master and a Foss slave instrument before (left) and after standardization (right), from 926 to 3,008 cm−1. (C) Comparison of fat predictions by the master and by a Foss slave before (left) and after (right) standardization. RMSE = root mean square error. T = transmittance. ... 25 Figure 3-1. Principal component analysis (PCA) of the spectra of all instruments before standardization (n = 66). The PCA is based on the common analysis of 5 standardization samples in triplicate after selection of 212 informative wave numbers and a first derivative. Plot of principal components (PC) 5 and 6 summarizes the spectral variability between instruments. Each color–symbol association represents an individual instrument ... 38
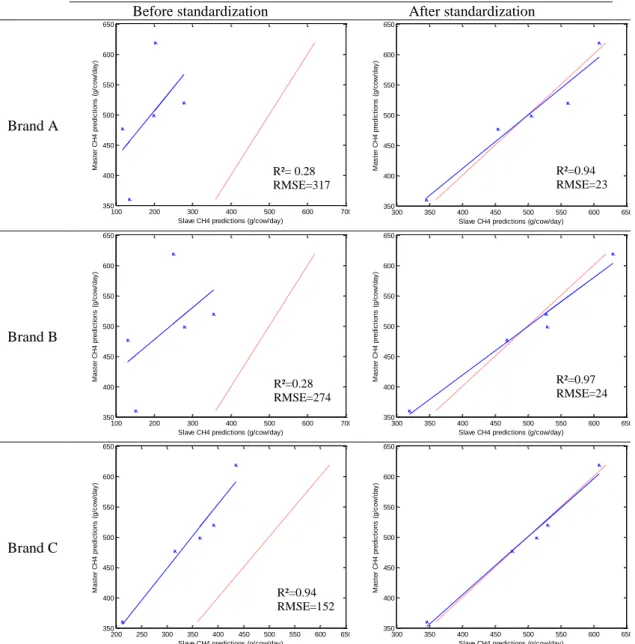
the common analysis of 5 standardization samples in triplicate after selection of 212 informative wave numbers and a first derivative. Plot of principal components (PC) 5 and 6 summarizes the spectral variability between instruments. ... 39 Figure 3-3. Comparison of methane predictions (g/d) by the master and by 3 slaves from the 3 brands before (left) and after (right) standardization. Dashed line is y = x; continuous line is the regression line between slave and master predictions. RMSE = root mean squared error. ... 40 Figure 3-4. Box plot representation of PUFA predictions for a sample of the interlaboratory study analyzed on 66 instruments for master spectra, nonstandardized spectra, and spectra after standardization after removing aberrant values. ... 42 Figure 3-5. Plots representing the link between the quality of the model (coefficient of determination of cross-validation; R²cv) and the performance of the transfer by piecewise direct standardization [relative root mean squared error (RMSE) between slaves and master predictions after standardization] from the 5 interlaboratory study samples analyzed on 66 instruments. CH4 = methane emitted by dairy cows; PUFA =
PUFA in milk; FCY = fresh cheese yield; Fat = fat model used in Grelet et al. (2015). ... 45
Figure 4-1. Effect of editing the acetone data set on the distribution of values: (A) Original data set after preliminary editing (n = 548), (B) data set after logarithmic transformation and removing randomly low values (n = 224). ... 60 Figure 4-2. Plot of BHB reference values from flow injection analysis and BHB values predicted from Fourier transform mid-infrared analysis (A) for the cross-validation (n = 325) and (B) for the cross-validation (n = 108). ... 62
Figure 4-3. Plot of acetone reference values from flow injection analysis and acetone values predicted from Fourier transform mid-infrared analysis (A) for the cross-validation (n = 168) and (B) for the validation (n = 56). ... 64 Figure 4-4. Plot of citrate reference values from flow injection analysis and citrate values predicted from Fourier transform mid-infrared analysis (A) for the cross-validation (n = 380) and (B) for the cross-validation (n = 126). ... 66
Figure 5-1. Scheme of the organization of monthly standardization ... 73 Figure 5-2. Principal component analysis of the spectra of the 5 interlaboratory study samples analyzed on 66 instruments, before and after standardization, and projected on the fatty acid dataset containing spectra from 1,822 individual milk samples. All the spectral data were plotted after selection of 212 informative wave numbers. Principal components (PC) 6 and 7 reported on the picture. ... 76 Figure 5-3. Plots representing the link between the quality of the model (coefficient of determination of cross-validation; R²cv) and the performance of the transfer by piecewise direct standardization [relative root mean squared error (RMSE) between slaves and master predictions after standardization] from the 5 interlaboratory study
samples analyzed on 66 instruments. The different models originate from Soyeurt et al. (2011), Soyeurt et al. (2009), Vanlierde et al. (2016), Grelet et al. (2016), Colinet et al. (2015) and Soyeurt et al. (2007). ... 78 Figure 5-4. Plots representing the link between the number of latent variables within the PLS models and the performance of the transfer by piecewise direct standardization [relative root mean squared error (RMSE) between slaves and master predictions after standardization] from the 5 interlaboratory study samples analyzed on 66 instruments. The different models originate from Soyeurt et al. (2011), Soyeurt et al. (2009), Vanlierde et al. (2016), Grelet et al. (2016), Colinet et al. (2015) and Soyeurt et al. (2007). ... 79 Figure 5-5. Plot of fat predictions over time originating from a fat model applied on non-standardized spectra from an instrument analysing a common batch of UHT milk during a period of 3 months... 80 Figure 6-1. Example of valorization of raw predictions (milk BHB, acetone, oleic acid and fat/protein ratio) into usable information by the « Cétolait » tool developed by the Walloon Breeding Association (AWE). ... 86 Figure A-1. Principal component analysis of the spectra of the 5 interlaboratory study samples analyzed on 66 instruments, before and after standardization, and projected on the fatty acids dataset containing spectra from 1,822 individual milk samples. All the spectral data were plotted after selection of 212 informative wave numbers. Principal components (PC) 1 and 2 reported on the picture.………...92
Figure A-2. Principal component analysis of the spectra of the 5 interlaboratory study samples analyzed on 66 instruments, before and after standardization, and projected on the fatty acids dataset containing spectra from 1,822 individual milk samples. All the spectral data were plotted after selection of 212 informative wave numbers. Principal components (PC) 3 and 4 reported on the picture. ………92 Figure A-3. Principal component analysis of the spectra of the 5 interlaboratory study samples analyzed on 66 instruments, before and after standardization, and projected on the fatty acids dataset containing spectra from 1,822 individual milk samples. All the spectral data were plotted after selection of 212 informative wave numbers. Principal components (PC) 4 and 5 reported on the picture. ………93
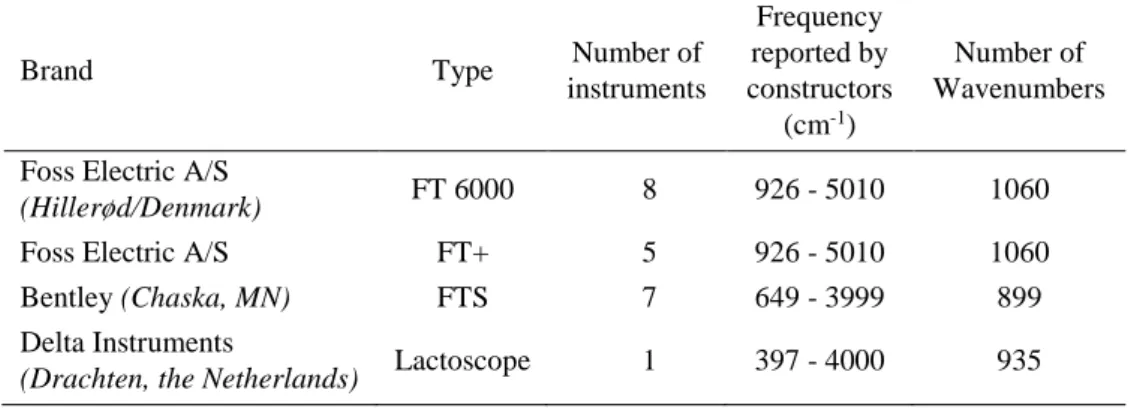
Table 2-1. Description of the Fourier transform mid-infrared instruments included in the study ... 18 Table 2-2. Means of statistical results from regressions between fat predictions by the Master and the slaves, before and after standardization of interlaboratory study 1 (n=20)1 ... 21
Table 2-3. Root mean square error (RMSE) between fat predictions of master and slaves, averaged by brand, before and after PDS (n = 20)1 ... 22
Table 2-4. Mean statistic results of comparison of fat prediction by the master and the slaves, before and after standardization of the second interlaboratory study spectra with coefficients from the first interlaboratory study (n = 20)1 ... 26
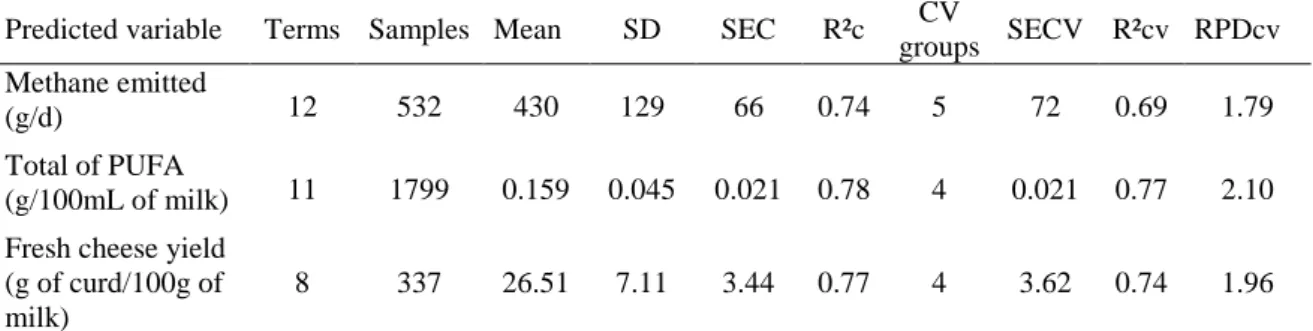
Table 3-1. Calibration and cross-validation statistics of equations used ... 36 Table 3-2. Root mean squared error (RMSE) between master and slaves predictions, averaged by brand, before and after piecewise direct standardization (PDS; n = 66 instruments) ... 41 Table 3-3. Maximum root mean squared error (RMSE) between master and slaves predictions, sorted by brand, before and after piecewise direct standardization (PDS; n = 66 instruments) ... 41 Table 3-4. Accuracy and reproducibility of predictions within the network; comparison of predictions from master, nonstandardized, and standardized spectra, from samples of the interlaboratory study analyzed on 66 instruments using 3 different Fourier transform mid-infrared calibrations ... 43 Table 3-5. Reproducibility of predictions among the different brands after standardization; comparison of predictions from master and standardized spectra, from samples of the interlaboratory study analyzed on 66 instruments using 3 different Fourier transform mid-infrared calibrations ... 44 Table 4-1. Overview of calibration and validation statistics from various studies aiming at predicting acetone content in milk by Fourier transform mid-infrared spectrometry; reference method for quantifying acetone, number of samples used, root mean square error (RMSE), standard error of cross-validation (SECV), and R² are presented1 ... 57
Table 4-2. Characteristics of the 4 sample source ... 58 Table 4-3. Characteristics of the Fourier transform mid-infrared instruments used in the study1 ... 59
Table 4-4. Descriptive statistics of the results from the reference analysis for BHB, acetone, and citrate ... 61
Table 4-5. Cross-validation and validation statistics for BHB, acetone, and citrate contents in milk1 ... 63
Table 4-6. Results of classification of BHB predictions into 2 classes (% of samples; using a threshold of 0.200 mmol/L) for cross-validation and validation data sets .... 64 Table 4-7. Classification of the acetone predictions into 2 classes (% of samples; using a threshold of 0.150 mmol/L) for cross-validation and validation data sets .... 65 Table 5-1. Overview of various studies aiming to standardize spectrometers using PDS method ... 74
A: absorbance
BHB: β-hydroxybutyrate CH4: methane
cm-1: 1/centimetre, wavenumber unit
d: day
DIM: days in milk FCY: fresh cheese yield
FT-MIR: Fourier-Transform Mid Infrared g: gramme
GH: standardized Mahalanobis distance IDF: International Dairy Federation l: litre
LV: latent variables Max: maximum Min: minimum MIR: Mid Infrared ml: millilitre mmol: millimole
MRO: milk recording organization N: number of samples
NADH: nicotinamide dinucleotide NEB: negative energy balance NIR: near Infrared
nm: nanometer
PC: principal component
PCA: principal component analysis PDS: piece-wise direct standardization PLF : precision livestock farming PLS: partial least square
PLS-DA: partial least square discriminant analysis PUFA: poly unsaturated fatty acids
R² : determination coefficient
R²cv : determination coefficient of cross-validation R²v : determination coefficient of validation
RMSE: root mean square error
RMSEcv: root mean square error of cross-validation RMSEv: root mean square error of validation RPD: ratio of SD to SEC
RPDcv: ratio of SD to SECV SD: standard deviation
SEC: standard error of calibration SECV: standard error of cross-validation SEL: standard error of laboratory
STD: standardization
SVM: Support Vector Machine T: transmittance
Chapter 1
Chapter 1: General introduction
1
Chapter 1 : General introduction
Current context involving the need for new phenotypes
This study has been conducted with the objective of optimizing the use of FT-MIR analysis of cow milk under routine conditions, within a network of labs in order to enable the development of new indicators for the dairy sector, and particularly for dairy farmers. It takes place in a context where the dairy production has been facing profound changes in recent decades prompting the need for new herd management tools.
Firstly, a reduction in the number of dairy farm as well as an increase of herd size and milk production per cow have been reported in the main dairy regions across the world (Gargiulo et al., 2018). Monitoring and management of cows are becoming more challenging and complex, requiring enhanced management ability from dairy farmers (Bewley, 2016). At the same time administrative tasks have also increased, with the combined result of making the adequate monitoring of individual animals extremely difficult for farmers (Berckmans, 2006). Additionally, due to demographic evolution, today’s farmer families have fewer children and lower involvement of adult children in the family farm. Consequently, more farms in developed countries depend on nonfamily labour (Barkema et al., 2015). However, the necessary skills and competences to monitor and manage dairy herds differ considerably among farm workers, and availability of competent laborers is often problematic (Winsten et al., 2010). Insufficient training of farm workers could lead to failure in the detection of health problems (Barkema et al., 2015). The limited availability of trained workers, or the cost linked to hiring labor with the necessary management skills, combined with the increase in herd size, are changes that make the management of herds more complex and time consuming, potentially affecting the profitability of dairy farms (Gargiulo et al., 2018).
Secondly, the European Union has abandoned the quota system, and due to market pressures farmers have often found fluctuating, typically declining, milk price to be aligned with global price (Barkema et al., 2015). The profitability of dairy farms is also endangered by this volatile (and often too low) price. In this context, optimal management of cows to prevent or detect diseases, improve animal health and welfare, reproduction and production, is considered a viable strategy for increasing economic outcome (Moyes et al., 2013).
Thirdly, society is becoming increasingly concerned with animal welfare, healthy animals and the environmental impact of livestock productions (Berckmans, 2006). For Belgian consumers, animal welfare comes second, after food safety, when deciding what food to purchase (Vanhonacker et al., 2007). To preserve their ‘social license to operate’, farmers need to provide objective evidence of the welfare and health of their animals (Barkema et al., 2015).
Consequently, there is a growing need for monitoring and management tools to satisfy these different necessities. In modern agriculture, digitalized monitoring techniques are becoming more and more important to support farmers in managing their production processes (Berckmans, D., 2006). In an animal production context,
2
these techniques have been grouped under the term Precision Livestock Farming (PLF). For Wathes et al. (2008), the background for the development of PLF is an environment where profits are marginal and the availability of labor unit with the necessary management skills is limited or too expensive. First PLF applications were devoted to monitoring the growth of housed pigs and poultry, but PLF can be applied to any species, including animals grown in extensive systems (Frost, 2001). In dairy production, potential field of applications are the detection of diseases and sub-optimal health status, improvement of health and welfare, reproduction, feed efficiency and environmental impact, among others. The objectives of PLF are to provide information on these topics, offer time saving opportunities to farmers, objectify the measures in favour of less emotional decisions, obtain more precise information or information previously unavailable, and benefit from additional phenotypes of interest without inducing animal stress due to invasive techniques. To cope with these objectives and farmers’ needs, the technology being used must be available under routine condition, economically affordable, applicable on a large scale and provide quick results to farmers.
FT-MIR analysis of milk
Among all the potential technologies, analysis of milk by Fourier-Transform Mid Infrared (FT-MIR) spectrometry is already being used in main dairy areas of the world for the purposes of quantifying fat, protein and lactose contents, milk payment and milk recording (Soyeurt et al., 2006; Dehareng et al., 2012). FT-MIR allows a fast, cost-effective and non-destructive quantification of milk chemical properties in order to avoid reference methods, which are usually tedious, expensive and time consuming.
Spectroscopy is defined as the study of a matrix through the electromagnetic radiation with which it interacts or that it produces. The history of spectroscopy is linked to the analysis of scattered light through a prism as experienced by Isaac Newton. The discovery of infrared radiation is attributed to Herschel who analysed the temperature of the diffracted sunlight just beyond the red end of visible spectrum (Herschel, 1800). Spectrometry is the measurement of electromagnetic radiation as a means of obtaining information about the systems and their components (IUPAC, 2007).
In a spectrometer, milk samples are crossed by infrared radiations at different wavelengths (nm). In mid infrared (MIR), these infrared radiations are more often characterized by a frequency, expressed in wavenumbers (cm-1), which are an inverted
function of wavelengths. The analysis is based on the interactions between light and chemical bonds within the molecules constituting milk. Two atoms constituting a molecule vibrate at a precise frequency and can interact with infrared rays having the same frequency and absorb energy of the light (Rouessac et al., 2016). Covalent bonds can absorb light at different wavenumbers because different vibrations as stretching and bending take place. Consequently, matter absorbs light at precise frequencies according to its chemical composition. This is physically expressed by the Beer-Lambert law stating that absorbance is linearly linked to the coefficient of molar
Chapter 1: General introduction
3
absorption, which is dependent of the wavenumber, pathlength and concentration of the analyte of interest.
Spectrometers usually contain a light emitting source, a system designed to select wavenumbers of interest, a cell containing the sample, and a light intensity measuring detector. Interactions between light and chemical bonds within milk molecules are measured on the basis of their transmittance (T) which is the ratio of light emitted by the source (I0) to the light received by the detector after passing through the sample (I), or considering the absorbance (A) of the sample which is a logarithmic function of the transmittance.
𝑇 = 𝐼/𝐼0 𝐴 = − log( 𝑇)
Milk is analysed in the near-IR region, from 800 to 2,500 nm (or 4,000 to 12,500 cm−1) but more often in the MIR region, from 2,500 to 25,000 nm (or 400 to 4,000 cm−1) as the MIR region contains the fundamental vibrations and thus provides better results.
The first MIR instruments dedicated to milk analysis measured the absorption of infrared energy at specific frequencies using a monochromator. Fat, protein and lactose contents were estimated by measuring absorbance of carbonyl groups in the ester linkages, the peptide linkages between amino acids and the O-H bonds, respectively. A second generation of infrared instrumentation used optical filters for wavenumber selection (Grappin and Jenet, 1976).
With the combined use of interferometers and Fourier transform algorithms, it has been possible to analyse milk samples in a large range of the infrared region. Measurements in the MIR region are taken at thousands of different wavenumbers. These thousands of absorbance (or transmittance) values obtained within this range of wavenumbers constitute a MIR spectrum (Figure 1-1).
Absorbance values at these different wavenumbers are used in equations to predict the content of milk components of interest (Williams and Norris, 1987). This is an
4
extension of the Beer–Lambert law linking absorbance to concentration. The use of the entire spectra, and consequently a higher amount of information, has increased the potential of this technology to provide accurate predictions while in most milk labs FT-MIR spectrometers have replaced filter instruments.
As previous technologies, FT-MIR instruments have been mainly used to produce fat, protein, and lactose predictions. Fat and protein contents are currently used for milk payment in many countries and have been therefore used as phenotypes for genetic improvement. FT-MIR analysis of milk has also been used in herd management. The ratio fat/protein is still used as the main indicator for ketosis and acidosis detection (Koeck et al., 2014). In milk processing, protein composition is a good indicator of milk ability to be processed into cheese (Amenu & Deeth, 2007). Models predicting urea in milk and free fatty acids are also implemented on manufacturer’s instruments. Urea in milk is useful for diet management and especially to estimate nitrogen efficiency in rumen fermentation (Hof et al., 1997). Free fatty acids are considered as an indicator of lipolysis in milk and associated organoleptic issues (Deeth H.C., 2006).
More recently, the use of the entire spectra in combination with advance of informatics and multivariate statistics have allowed the development of models that delve deeper into the composition of fine milk. Models have been built for the determination of fatty acids profiles (Soyeurt et al., 2006), lactoferrin (Soyeurt et al., 2007), minerals (Soyeurt et al., 2009), protein composition (Bonfatti et al., 2011), ketone bodies (Van Knegsel et al., 2010). Other studies have used FT-MIR spectra to build calibrations predicting technological properties of milk such as milk acidity (De Marchi et al., 2009), ability to coagulate, and firmness of curd or cheese yield (Dal Zotto et al., 2008; Colinet et al., 2015). Recent researches also focused on the prediction of blood composition through milk spectra, particularly for β-hydroxybutyrate (BHB) (Broutin, 2014). FT-MIR spectrum of milk has even been considered as a reflection of cows’ ‘status', and models were developed to predict methane emissions of dairy cows (Dehareng et al., 2012), likelihood of conception (Hempstalk et al., 2015), body energy status (McParland et al., 2011) or energy intake and efficiency (McParland et al., 2014).
All these FT-MIR models aim to provide more information for the dairy sector, in order to optimize and rationalize the management of herds by providing valuable indications on the status of individual lactating cows. Additionally, these models are of great interest for genetic studies, because large amount of phenotypes of interest are needed. Finally, in the framework of milk processing, models predicting the technological properties of milk before the beginning of the process would be beneficial to production management.
Standardization
Most of these models have been developed by scientific institutions in the framework of research projects, and very few of them have been really used by field and commercial organizations devoted to providing management tools to farmers. Actually, there is a suboptimal use of technology designed to provide useful information to farmers due to the weak transfer mechanism between research and field
Chapter 1: General introduction
5
organizations (De Marchi et al., 2014). The main reasons for this are the difficulty to obtain robust models providing correct predictions on real field conditions (Gengler et al., 2016), and the difficulty to share and transfer models between instruments (Wang et al., 1991).
The development of robust models is indeed very expensive, time consuming and practically difficult as it implies to constitute calibration datasets based on a large number of samples, that require high variability in terms of breeds, diets, management systems, geographic origins, reference and spectral data. When applying the models, the potential variability that could be met under field conditions must be covered. Combinations of different datasets containing complementary information is therefore essential (De Marchi et al., 2014). In order to save resources and obtain reliable tools there is an urgent need to merge datasets and develop and share common models.
However, this is not directly possible due to the specific instrumental response produced by each instrument (Feudale et al., 2002). These differences originate from the specific physical characteristic of each brand and models, using different technologies, materials, and optical paths… The main manufacturers of FT-MIR spectrometers dedicated to milk analysis are Foss (Hillerød, Denmark), Bentley (Chaska, MN, USA) and Delta Instruments (Drachten, the Netherlands). These three brands provide spectra with different ranges, from 925.66 to 5,010.15 cm−1 for Foss instruments, from 649.03 to 3,998.59 cm−1 for Bentley instruments and from 397.31 to 4,000 cm−1 for Delta instruments. Additionally, instruments originating from the same models are also individually characterized by specific spectral responses due to different uses, deterioration of pieces, environmental factors, maintenance operations or piece replacements. Finally, these factors added to electronic drifts and detector instability lead to the instability of each individual spectrometer response over time (Bonfatti et al., 2017).
This heterogeneity prevents merging datasets from different instruments: a model developed on instrument A provides biased predictions if transferred to instrument B (Rodriguez et al., 2011). This is a practical limiting factor to the development and use of FT-MIR models to provide management tools for farmers under routine conditions. In terms of fat, protein and lactose content delivery, this spectral heterogeneity has traditionally been handled by the dairy sector by performing slope and bias adjustments on the predictions after analysing standard milks with reference values obtained from wet chemistry (ISO 9622:2013 | IDF 141:2013). In the context of providing new phenotypes for the management of dairy herds, as energy or health status, it is too expensive or even impossible to constitute standard samples with known values of the variable of interest (Bonfatti et al., 2017). Given that predictions of developed models cannot be corrected through slope and bias adjustment, the creation of robust models predicting new phenotypes of interest is suboptimal and the transfer of such models among different spectrometers often leads to incorrect predictions.
Standardization of the FT-MIR spectra in order to harmonize directly the spectral responses of instruments appears as a potential solution (Rodriguez et al., 2011). This could allow the merging of datasets and the transfer of models through the dairy sector. Harmonization of spectral responses would serve to optimize and enhance
6
practically the use of FT-MIR spectrometry as an efficient technology designed to provide management information for dairy farms.
Such standardization methods have been historically developed in the context of near infrared (NIR) analysis of agricultural products (Wang et al., 1991). These methods aimed to solve two situations where the models were rendered invalid due to the ‘format’ of spectral responses (Feudale et al., 2002). First, as mentioned earlier, the transfer of a model developed on a specific instrument and then transferred to a second instrument was problematic given the differences in spectral responses. The second issue was caused by the change in time of the spectral responses of individual instruments, resulting in models not adapted to this changed spectral response. Although standardization methods have mostly been developed for NIR data, it has also been applied to transfer UV-Visible, fluorescence and Raman spectral data (Feudale et al., 2002). However, these methods have not been tested for the harmonization of FT-MIR spectra of milk in order to transfer models predicting new phenotypes of interest for management of dairy herds.
Research objectives
In this context, this study aims as a first step to evaluate the performance of harmonizing milk FT-MIR spectral data, using Piece-wise Direct Standardization method, in order to transfer a robust model predicting fat content in milk, from instrument to instrument (Chapter 2). In a second step, the effect of this method on data harmonization is evaluated further, to assess the possibilities of using in practice innovative models of interest for the dairy sector in a network of instruments (Chapter 3). This is done by analysing, on 66 spectrometers, the impact on spectral reproducibility, the transfer of models with low robustness and the accuracy and reproducibility of predictions within the network. After insuring the possibility of using spectral data in optimal conditions, the final step aims to concretize the development of models that provide information on cow status so they may be used by dairy farmers as management tools (Chapter 4). Emphasis is placed on the biomarkers of energy status and ketosis associated risks. Indeed, in early lactation negative energy balance has been identified as one of the major factors influencing fertility and health of dairy cows (Collard et al., 2000; Butler, 2003). This is done with the objective of detecting suboptimal status before becoming clinical cases. Concretely, this third part aims to develop models to predict citrate, reflecting early energy imbalance, and acetone and BHB as indicators of (sub)clinical ketosis.
References
Amenu B., & Deeth H. C., 2007. The impact of milk composition on cheddar cheese manufacture. Aust. J. Dairy Technol., 62:3, 171.
Barkema H. W., Von Keyserlingk M. A. G., Kastelic J. P., Lam T. J. G. M., Luby C., Roy J. P., & Kelton D. F., 2015. Invited review: Changes in the dairy industry affecting dairy cattle health and welfare. J. Dairy Sci., 98:11, 7426-7445.
Belay T.K., Dagnachew B.S., Kowalski Z.M., Ådnøy T., 2017. An attempt at predicting blood β-hydroxybutyrate from Fourier-transform mid-infrared spectra of
Chapter 1: General introduction
7
milk using multivariate mixed models in Polish dairy cattle. J. Dairy Sci. 100, 6312-6326.
Berckmans D., 2006. Automatic on-line monitoring of animals by precision livestock farming. Livestock production and society, 287.
Bewley J., 2016. Opportunities for monitoring and improving animal welfare using precision dairy monitoring technologies. J. Anim. Sci. 94:2:11.
Bonfatti V., Di Martino G., Carnier P., 2011, Effectiveness of mid-infrared spectroscopy for the prediction of detailed protein composition and contents of protein genetic variants of individual milk of Simmental cows. J. Dairy Sci. 94:12:5776-5785.
Bonfatti V., Fleming A., Koeck A., and Miglior F., 2017. Standardization of milk infrared spectra for the retroactive application of calibration models. J. Dairy Sci. 100:2032–2041.
Broutin P., 2015. Determination of the concentration of a component in one fluid of an animal by spectroscopic analysis of another fluid. Patent. Pub. No: WO/2015/055966. International Application No: PCT/FR2014/052650. Publication
Date: 23.04.2015. Retrieved on 6 May 2018 from
https://patentscope.wipo.int/search/en/detail.jsf?docId=WO2015055966.
Butler W.R., 2000. Nutritional interactions with reproductive performance in dairy cattle. Anim. Reprod. Sci. 60, 449-457.
Colinet F., Troch T., Baeten V., Dehareng F., Dardenne P., Sindic M., Gengler N., 2015. Genetic variability of MIR predicted milk technological properties in Walloon dairy cattle. In Book of Abstracts of the 66th Annual Meeting of the European Federation of Animal Science (p. 400). Wageningen Academic Publishers.
Collard B.L., Boettcher P.J., Dekkers J.C., Petitclerc D., and Schaeffer L.R., 2000. Relationships between energy balance and health traits of dairy cattle in early lactation. J. Dairy Sci., 83, 2683–2690.
Dal Zotto R., De Marchi M., Cecchinato A., Penasa M., Cassandro M., Carnier P., Bittante G., 2008. Reproducibility and repeatability of measures of milk coagulation properties and predictive ability of mid-infrared reflectance spectroscopy. J. Dairy Sci. 91(10): 4103-4112.
De Marchi M., Fagan C., O’donnell C., Cecchinato A., Dal Zotto R., Cassandro M., Bittante G., 2009. Prediction of coagulation properties, titratable acidity, and pH of bovine milk using mid-infrared spectroscopy. J. Dairy Sci., 92:1 :423-432.
De Marchi M., Toffanin V., Cassandro M., and Penasa M., 2014. Invited review: Mid-infrared spectroscopy as phenotyping tool for milk traits. J. Dairy Sci. 97:1171– 1186.
Deeth H. C., 2006. Lipoprotein lipase and lipolysis in milk. Int. Dairy J., 16:6, 555-562.
Dehareng F., Delfosse C., Froidmont E., Soyeurt H., Martin C., Gengler N., Vanlierde A. and Dardenne P., 2012. Potential use of milk mid-infrared spectra to predict individual methane emission of dairy cows, Animal, 10:1694-701.
8
Feudale R. N., Woody N. A., Tan H., Myles A. J., Brown S. D., & Ferré J., 2002. Transfer of multivariate calibration models: a review. Chemometr. Intell. Lab. , 64:2, 181-192.
Frost A. R., 2001. An overview of integrated management systems for sustainable livestock production. BSAP Occasional Publication, 28, 45-50.
Gargiulo J. I., Eastwood C. R., Garcia S. C., & Lyons N. A., 2018. Dairy farmers with larger herd sizes adopt more precision dairy technologies. J. Dairy Sci. 101:6, 5466-5473.
Gengler N., Soyeurt H., Dehareng F., Bastin C., Colinet F., Hammami H., Vanrobays M.L., Lainé A.,Vanderick S., Grelet C., Vanlierde A., Froidmont E., Dardenne P., 2016. Capitalizing on fine milk composition for breeding and management of dairy cows. J. Dairy Sci. 99:5, 4071-4079.
Grappin R., Jeunet R., 1976. Essais de l'appareil Milko-Scan 300 utilisé pour le dosage en série de la matière grasse et des protéines du lait, Lait, 56:558,498-520.
Hempstalk K., McParland S., Berry D.P., 2015. Machine learning algorithms for the prediction of conception success to a given insemination in lactating dairy cows. J. Dairy Sci., 98:8, 5262-5273.
Herschel W., 1800. XIV. Experiments on the refrangibility of the invisible rays of the sun. Philosophical Transactions of the Royal Society of London, 90, 284-292.
Hof G., Vervoorn M. D., Lenaers P. J., & Tamminga S., 1997. Milk urea nitrogen as a tool to monitor the protein nutrition of dairy cows. J. Dairy Sci. 80:12, 3333-3340.
ISO 9622:2013 | IDF 141:2013 – Whole milk – Determination of milk fat, protein and lactose content – Guidance on the operation of mid-infrared instruments. ISO, Geneva, Switzerland.
IUPAC. Compendium of Chemical Terminology, 2nd ed. (the "Gold Book"). Compiled by McNaught A.D., and Wilkinson A., Blackwell Scientific Publications, Oxford. 1997. XML on-line corrected version: http://goldbook.iupac.org (2006-) created by M. Nic, J. Jirat, B. Kosata; updates compiled by A. Jenkins. ISBN 0-9678550-9-8. https://doi.org/10.1351/goldbook.
Koeck A., Jamrozik J., Schenkel F. S., Moore R. K., Lefebvre D. M., Kelton D. F., & Miglior F., 2014. Genetic analysis of milk β-hydroxybutyrate and its association with fat-to-protein ratio, body condition score, clinical ketosis, and displaced abomasum in early first lactation of Canadian Holsteins. J. Dairy Sci. , 97:11, 7286-7292.
McParland S., Banos G., Wall E., Coffey M.P., Soyeurt H., Veerkamp R.F., Berry D.P., 2011., The use of mid-infrared spectrometry to predict body energy status of Holstein cows, J. Dairy Sci. 95:3,1222-1239.
McParland S., Lewis E., Kennedy E., Moore S.G., McCarthy B., O’Donovan M., Butler S.T., Pryce J.E., Berry D.P., 2014. Mid-infrared spectrometry of milk as a predictor of energy intake and efficiency in lactating dairy cows, J. Dairy Sci. 97:9,5863-5871.
Chapter 1: General introduction
9
Moyes K. M., Larsen T., & Ingvartsen K. L., 2013. Generation of an index for physiological imbalance and its use as a predictor of primary disease in dairy cows during early lactation. J. Dairy Sci., 96:4, 2161-2170.
Pralle R. S., Weigel K. W., & White H. M., 2018. Predicting blood β-hydroxybutyrate using milk Fourier transform infrared spectrum, milk composition, and producer-reported variables with multiple linear regression, partial least squares regression, and artificial neural network. J. Dairy Sci. 101:5,4378-4387.
Rodriguez J. D., Westenberger B. J., Buhse L. F., and Kauffman J. F., 2011. Standardization of Raman spectra for transfer of spectral libraries across different instruments. Analyst 136:4232–4240.
Rouessac F., Rouessac A., Cruché D., Duverger-Arfuso C., Martel A., 2016. Analyse chimique-8e éd.: Méthodes et techniques instrumentales modernes. Dunod. Paris, ISBN 978-2-10-074688-0.
Soyeurt H., Dardenne P., Dehareng F., Lognay G., Veselko D., Marlier M., Gengler N., 2006. Estimating fatty acid content in cow milk using mid-infrared spectrometry. J. Dairy Sci., 89 :9, 3690-3695.
Soyeurt H., Colinet F., Arnould V., Dardenne P., Bertozzi C., Renaville R., Portetelle D., Gengler N., 2007. Genetic Variability of Lactoferrin Content Estimated by Mid-Infrared Spectrometry in Bovine Milk, J. Dairy Sci. 90:9,4443-4450.
Soyeurt H., Bruwier D., Romnee J.-M., Gengler N., Bertozzi C., Veselko D., Dardenne P., 2009. Potential estimation of major mineral contents in cow milk using mid-infrared spectrometry, J. Dairy Sci. 92:6,2444-2454.
Van Knegsel A.T.M., van der Drift S.G.A, Horneman M., de Roos A.P.W., Kemp B., Graat E.A.M., 2010. Short communication: Ketone body concentration in milk determined by Fourier transform infrared spectroscopy: Value for the detection of hyperketonemia in dairy cows, J. Dairy Sci. 93:7,3065-3069.
Vanhonacker F., Verbeke W., Van Poucke E., and Tuyttens F. A., 2007. Segmentation based on consumers' perceived importance and attitude toward farm animal welfare. Int. J. Soc. Food Agric. 15:91–101.
Vanlierde A., Vanrobays M.L., Gengler N., Dardenne P., Froidmont E., Soyeurt H., McParland S., Lewis E., Deighton M.H., Mathot M., and Dehareng F., 2016. Milk mid-infrared spectra enable prediction of lactation-stage dependent methane emissions of dairy cattle within routine population-scale milk recording schemes. Animal Production Science, 2016, 56, 258–264.
Wang Y., Veltkamp D.J, Kowalsky B.R., 1991. Multivariate instrument standardisation, Anal. Chem., 63:23,2750–27.
Wathes C. M., Kristensen H. H., Aerts J. M., & Berckmans D., 2008. Is precision livestock farming an engineer's daydream or nightmare, an animal's friend or foe, and a farmer's panacea or pitfall? Comput. electron. agr., 64:1, 2-10.
Williams P., Norris K., 1987. Near-Infrared technology in the agricultural and food industries. American association of cereal chemists, Inc. St. Paul, Minnesota 55121 USA.
10
Winsten J. R., Kerchner C. D., Richardson A., Lichau A., and Hyman J. M., 2010. Trends in the Northeast dairy industry: Large-scale modern confinement feeding and management-intensive grazing. J. Dairy Sci. 93:1759–1769.
Chapter 2
Standardization of milk mid-infrared
spectra from a European dairy network
12
Introduction to chapter 2
Numerous standardization methods have been reported in scientific literature. The common points of all these methods are the analysis of common samples performed through various instruments, to be used as a basis for the transfer procedure, followed by the adjustment of the responses of interest into a response considered as the reference.
A first type of standardization requires considering the adjustment of the final predictions provided by each model for a given instrument. In this scheme, the values predicted by secondary instruments are corrected to fit the reference values, which could be chemical values from wet chemistry or the prediction provided by an instrument considered as a reference. Predictions of the models are adjusted a posteriori using a univariate slope and bias correction obtained from a linear regression. This is the method classically used in the dairy sector to ensure the quality of fat, protein and lactose predictions (ISO 9622:2013 | IDF 141:2013). However, this method involves the use of samples with known reference values, which is difficult, expensive or even impossible to obtain in the case of some phenotypes predicting cow status (Bonfatti et al., 2017).
A second type of method is based on the standardization of the calibration datasets, and consequently of the models, in order to transfer them to a secondary instrument. Some methods, such as the classical or inverse model standardization, have been described by Wang et al. (1991). However, both methods also need the use of samples with known reference values (Feudale et al., 2002).
A third type of method focuses on standardizing the spectral response of instruments. Thus, models remain unique and unchanged, and each spectral response is corrected to match the spectral response of a reference instrument on which the models are developed. A first method called univariate standardization performs a regression at each wavelength between absorbance values of master and secondary instruments (Shenk and Westerhaus, 1993). Univariate standardization only allows correcting for intensity differences and not wavenumber axes. Hence, there is a need to combine with a wavenumber adjustment (Feudale et al., 2002). Another method called direct standardization uses the entire spectrum of the secondary instrument to match the spectral response of the reference instrument at each wavenumber (Wang et al., 1991). The main problem with this method is that a significant amount of chemical information can be modelled, and if variation happens within the sample analysed by different instruments it can be integrated into the transfer model and disrupt the standardization performances (Feudale et al., 2002). To cope with this, the Piece-wise Direct Standardization method (PDS), presented by Wang et al. (1991) takes into account that in real spectroscopic data the spectral response at one wavenumber is more likely to be related to the response at nearby spectral points. The response of the reference instrument at a given wavenumber is reconstructed based on the measurement on a small window around this wavenumber on the secondary instrument. Among all the tested methods, PDS provides the best results, and can reduce the differences between instruments even when a small number of samples were used for the transfer (Wang et al., 1991). The better results obtained through
Chapter 2: Standardization of milk MIR spectra
13
PDS can be attributed to its local and multivariate nature, allowing to correct for wavenumber shifts, intensity differences and peak broadening (Feudale et al., 2002).
Consequently, the PDS seems the more appropriate method in this context to standardize mid-infrared spectrometers dedicated to milk analysis. This technique has been mostly evaluated with NIR data based on standard samples constituted of cereals, forages or oil. Accordingly, there is a need to validate the use of this method when applied on milk spectra acquired in mid-infrared range. Moreover, the nature and the number of common standard samples used for transfer procedures has a high impact on the performance of the method (Wang et al., 1991). There is also a need to test whether the samples classically used to perform slope and bias correction and produced following the IDF (International Dairy Federation) norm 141, ISO/DIS 9622, can be used as a physical common reference to apply the method. To achieve this practically, the following chapter aims to evaluate the performance of harmonizing milk FT-MIR spectral data, using Piece-wise Direct Standardization method and a set of standard raw milk samples, with the objective of transferring a robust fat model from instruments to instruments.
References
Bonfatti, V., Fleming A., Koeck A., and Miglior F., 2017. Standardization of milk infrared spectra for the retroactive application of calibration models. J. Dairy Sci. 100:2032–2041.
Feudale R. N., Woody N. A., Tan H., Myles A. J., Brown S. D., & Ferré J. 2002. Transfer of multivariate calibration models: a review. Chemometr. Intell. Lab. , 64(2), 181-192.
ISO 9622:2013 | IDF 141:2013 – Whole milk – Determination of milk fat, protein and lactose content – Guidance on the operation of mid-infrared instruments. ISO, Geneva, Switzerland.
Shenk J., & Westerhaus M. 1993. Comments on standardisation: Part 2. NIR news, 4(5), 13-15.
Wang Y., Veltkamp D.J, Kowalsky B.R., 1991. Multivariate instrument standardisation, Anal. Chem., 63(23)2750–27.
14
Chapter 2: Standardization of milk mid-infrared
spectra from a European dairy network
C. Grelet1, J. A. Fernández Pierna1, P. Dardenne, V. Baeten, and F. Dehareng
Walloon Agricultural Research Center, Valorisation of Agricultural Products Department, 24 Chaussée de Namur, 5030 Gembloux, Belgium
J. Dairy Sci. 98 :2150–2160 http://dx.doi.org/10.3168/jds.2014-8764 © American Dairy Science Association®, 2015
1 These authors contributed equally
Abstract
The goal of this study was to find a procedure to standardize dairy milk mid-infrared spectra from different Fourier transform mid-infrared spectrophotometers (different brands or models) inside a European dairy network to create new farm-management indicators (e.g., fertility, health, feed, environmental impact) based on milk infrared spectra. This step is necessary to create common spectral databases, allowing the building of statistical tools, to be used by all instruments of the network. The method used was piecewise direct standardization (PDS), which matches slave instrument spectra on master-instrument spectra. To evaluate the possibility of using common equations on different instruments, the PDS method was tested on a set of milk samples measured on each machine, and an equation predicting fat content of milk is applied on all. Regressions were performed between master and slaves fat predictions, before and after PDS. Bias and root mean square error between predictions were decreased after PDS, respectively, from 0.3781 to 0.0000 and from 0.4609 to 0.0156 (g of fat/100 mL of milk). The stability over time of these results was confirmed by an application of the coefficients created by PDS 1 mo later on the slave spectra. These preliminary results showed that the PDS method permits a reduction of the inherent spectral variability between instruments, allowing the merging of Fourier transform mid-infrared milk spectra from different instruments into a common database, the creation of new types of dairy farm management indicators, and the use of these common calibrations for all Fourier transform mid-infrared instruments of the European dairy network.
Key words: Fourier transform mid-infrared spectrometry, standardization, dairy milk, piecewise direct standardization
Introduction
This work is the first step of a project aiming to develop innovative farm-management web applications based on the use of Fourier transform mid-infrared (FT-MIR) spectrometry analysis of milk to enable a sustainable and profitable management of the milk production. Fourier transform mid-infrared spectrometry is the worldwide method of choice for composition and quality controls during routine liquid milk testing. It allows a fast, nondestructive quantification of milk chemical properties to avoid reference methods, which are usually tedious, expensive, and time consuming. In 1961, a patent application for a FT-MIR method determining fat, protein, and lactose in milk was introduced (Goulden, 1964). The first apparatus, an
Chapter 2: Standardization of milk MIR spectra
15
IRMA (Infrared Milk Analyzer, Grubb Parsons, Newcastle upon Tyne, UK) using a monochromator, was based on the principle of measuring direct absorption of the infrared energy at specific frequencies by carbonyl groups in the ester linkages of the fat molecules, by peptide linkages between amino acids of protein molecules, and by the O-H groups in lactose molecules. A second generation of infrared instrumentation has adopted the change from wavenumber selection by diffraction grating to optical filters (Grappin and Jeunet, 1976) and was largely used by Central milk laboratory testing, where both tank milk and individual-cow samples were tested. Fourier transform mid-infrared supplies complementary chemical information and allows a high throughput with high sensitivity in a short response time from a very small quantity of sample (Ghosh and Jayas, 2009). In 1993, the first purpose-built FT-MIR instrument based on the Fourier transform infrared (FT-MIR) technology was marketed (Anadis MI-200; Asselain et al., 1996). With the introduction of the FT-MIR, new applications have been developed because of the use of the full spectrum of the sample. In this way, FT-MIR has been applied for the determination of more and more milk components such as proteins composition (Bonfatti et al., 2011), minerals (Soyeurt et al., 2009), ketone bodies (van Knegsel et al., 2010), lactoferrin (Soyeurt et al., 2007), and fatty acid profile (Rutten et al., 2009; Soyeurt et al., 2011). Then recent studies were performed using these milk components predicted by FT-MIR to predict physiological indicators of the animal (Friggens et al., 2007; Mohammed et al., 2011). In the context of this research project the FT-MIR spectrum is directly considered as a reflection of the state of the cows, avoiding the step of milk composition, to obtain indicators concerning fertility, health, environment, and feeding among others. Until now, only a few studies have been performed to show the potential of the entire FT-MIR spectra as an indicator of those parameters. Only recent studies have shown that predictions based on direct spectra are much more global, sensitive, and accurate than those based on milk components when they are predicted from FTMIR. Dehareng et al. (2012) have shown that enteric methane was better predicted when directly working with FT-MIR spectra than the results based on fatty acid predictions. Also recently, the FT-MIR spectrum of milk was shown to be a good indicator of body energy status (McParland et al., 2011), energy intake and efficiency (McParland et al., 2014), and fertility diagnosis (Laine et al., 2013) in dairy cattle. This innovative approach of using FT-MIR spectroscopy needs the support of important spectral databases associated with reference values for each of the properties to be studied. For this reason, the OptiMIR project was built; it is a European Interreg project involving 6 countries and focuses on the development of prediction tools directly based on FT-MIR spectra. In this work, a large number of commercially available mid-infrared spectrometers (21) from different manufacturers (3) installed in different laboratories (10) located in different countries (3) were used. Because of differences of the instrumental responses between different FT-MIR spectrometers, spectra obtained on one instrument cannot readily be compared with a library acquired on a different instrument. Moreover, the use of calibration models developed on an instrument with FT-MIR spectra obtained on another instrument will usually lead to an increased uncertainty of the prediction model. This is a drawback when recalibrating an instrument or using a historical database. Therefore, spectral corrections adapted to each instrument (standardization procedures) are needed