Proceedings, 10th World Congress of Genetics Applied to Livestock Production Prediction of Body Weight of Primiparous Dairy Cows Throughout Lactation
M.-L. Vanrobays*, J. Vandenplas*,†, H. Hammami*,†and N. Gengler*.
*University of Liege, Gembloux, Belgium, †National Fund for Scientific Research, Brussels, Belgium
ABSTRACT: Body weight (BW) can be computed using linear conformation traits (CBW). However, these traits are recorded mostly once during a lactation. Therefore, predict-ed BW (PBW) is nepredict-edpredict-ed throughout the lactation (e.g., allowing feed intake prediction in milk recording systems). A two-step procedure was developed to obtain PBW using a random regression test-day model using CBW as observa-tions. Added second step consisted in changing prior distri-bution for additive genetic random effects using results from first step to predict again PBW. This method was applied on 24,919 primiparous Holstein cows having 25,061 CBW to obtain PBW for 232,436 test-days. Results showed that applying both steps provided more accurate estimates than using only the first step. Furthermore, this procedure predicting PBW throughout lactation is also extremely flexible because actual BW can also be used together with CBW, the prediction model being able to accommodate different levels of accuracies.
Keywords: dairy cattle; body weight; feed intake Introduction
Milk production costs are mainly influenced by feed provided to dairy cows and there are growing interests to improve feed efficiency of dairy cows. Therefore, dry matter intake (DMI) appears to be an interesting trait to include in breeding schemes (Pryce et al., 2014). However, DMI measurements are expensive and difficult. Several models were developed to estimate feed intake of dairy cows based on animal factors or diet characteristics (Huhtanen et al., 2011). Body weight (BW) of dairy cows is often used in these models to predict DMI because this trait reflects the capacity of the digestive tract (Zom et al., 2012). NRC (2001) provided a model which allows estimat-ing DMI from fat and protein corrected milk yield, lactation stage, and BW. This model could be useful in milk record-ing programs if BW were routinely collected. However, in the Walloon Region of Belgium as in most countries, this trait is not routinely recorded. Nevertheless, it has been shown that BW can be estimated from linear conformation traits (CBW; Koenen and Groen, 1998; Coffey et al., 2003; Banos and Coffey, 2012). However, there are at least three issues when estimating CBW of classified cows. First, CBW are obviously less precise than actual weightings of cows. Second, each CBW is associated to a classification date and therefore not directly available at the day when milk production is recorded. Finally, BW is highly variable inside a given lactation for a given cow. Therefore, differ-ent equations are generally developed to generate CBW.
The last two issues are currently often overlooked and, however, extremely important in practical use of BW (e.g. in computing DMI for every test-day). Therefore, because CBW are not associated to a test-day, the objective of this study was to develop a model to predict BW throughout lactation (PBW) of cows from initial CBW based on con-formation traits.
Materials and Methods
Data. Linear conformation data (i.e., angularity, chest width, stature, and udder depth) and body condition score (BCS) of cows were recorded at the same day by the Walloon Breeding Association (AWE, Ciney, Belgium). A total of 25,061 linear conformation data and BCS from 24,919 first-lactation Holstein cows from 622 herds in the Walloon Region of Belgium were available.
Test-day records of studied cows provided by AWE from milk recording were merged with the confor-mation traits dataset. These records included days in milk (DIM), birth date, calving date, and test date. The final dataset contained 232,436 data. Pedigree data for these cows were extracted from the official Walloon genetic evaluation database. The pedigree file contained 124,863 animals.
Body weight estimation. Two equations devel-oped by Laloux (2008) were applied on linear conformation data and BCS in order to estimate CBW of cows at their classification date. The coefficient of determination (R²) of the first equation which was based on age, angularity, chest width, stature, udder depth, and BCS was 0.86. This equa-tion was applied for cows with DIM =< 130 days. The second equation was developed for cows with DIM > 130 days. This equation was associated to a R²=0.73 and was based on age, angularity, stature, udder depth, and BCS. These two periods will be called hereafter early (el) and mid-late (ml) lactation.
Model. The following weighted univariate random regression test-day model was developed in order to predict PBW of cows across DIM:
y = Xb + dlαl + dqαq + Zelhel + Zmlhml + Zelael + Zmlaml + e (1) where y was the vector of observations (i.e., CBW obtained with Laloux’s equations); b was the vector of fixed effects including year of test-day, season of test-day, classes of gestation stage (4 classes), and age at calving x lactation
560 580 600 620 640 660 680 700 5 45 85 125 165 205 245 285 325 365
E
st
im
at
ed body w
ei
ght
(kg)
DIM
stage (3 classes of 122 DIM); dl and dq were linear and quadratic regression variables expressed as linearized evo-lutions of average smoothed weight across DIM; and αl and αq were associated fixed regression coefficients. The model contained two correlated random herd effects (hel and hml) and two random animal genetic effects (ael and aml), one for each period. Finally, e was the vector of residuals and X, Zel and Zml were incidence matrix assigning observations to fixed and random effects. Because initial studies showed heterogeneity of residual variances (data not shown) under-lying different R2 of Laloux’s equations, weights in func-tion of these two equafunc-tions were added to this model. Vari-ance components were estimated using REMLF90 (Misztal, 2012). PBW were obtained using a two-step approach. First, PBW were predicted using the model (1). Prior distri-bution for the random effect a= aael
ml was first assumed as
a~MVN(0,G) where MVN means “multivariate normal” and G=G0⨂A where G0was the elementary covariance matrix among periods and A was the numerator relation-ships matrix. Second, BW for specific test-days were pre-dicted using the model (1) changing the prior distribution for the random effect a to a~MVN(µμ,𝐆∗). Bayesian predic-tion theory as outlined by Henderson (1984) and used pre-viously by others authors (e.g., Schaeffer and Jamrozik, 1996) was used to adapt this random effect. For each ith level of a having an observation (CBW from Laloux’s equations), the respective element for the vector µ, µi, was equal to the sum of estimates âi and êi computed during the first step. If more than one CBW was available, average CBW was used. Otherwise, µi was equal to 0. Record equivalents associated to µ
were assumed to be equal to 24x where x was the number of CBW per cow during the first lactation. The approximate number of 24 reflected an as-sumed R² of 0.80 associated to CBW compared to the esti-mated heritabilities. The developed approach was similar to push heritabilities to a higher level in line with R2 of Laloux’s equations. The matrix G* was computed as de-tailed by Quaas and Zhang (2006).Computations were done using a modified version of BLUPF90 (Misztal, 2012).
The root mean square error (RMSE), the mean ab-solute error (MAE), and the r-square of correlation (Rc2) were used to compare CBW and PBW of cows for the two prediction steps. RMSE and MAE were computed as fol-lowing (Willmott and Matsuura, 2005):
RMSE= εi2 n i=1 n MAE= εi n i=1 n
where n was the number of CBW and εi was the error be-tween CBW and PBW for the ith observation.
In order to have additional information on the fit of PBW (from first- and second-step) to actual BW meas-urements and not used in the prediction procedure, the Rc2 between actual and PBW was computed for 36 weightings.
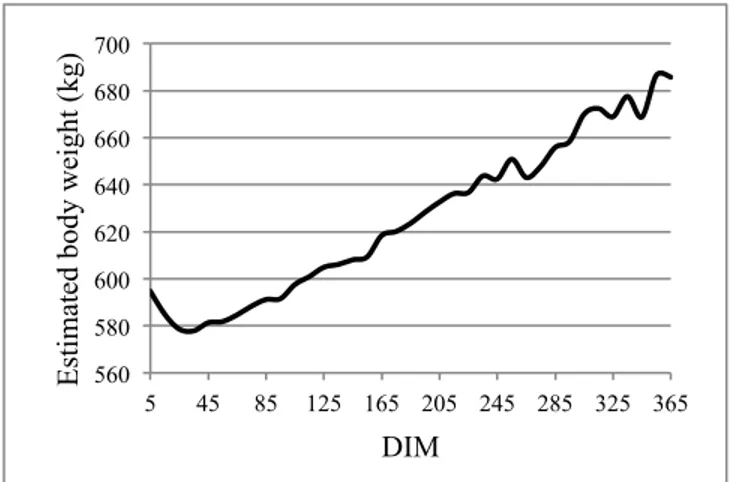
Figure 1: Daily body weight of dairy cows in first lacta-tion across days in milk (DIM) estimated from equalacta-tions based on conformation traits.
Results and Discussion
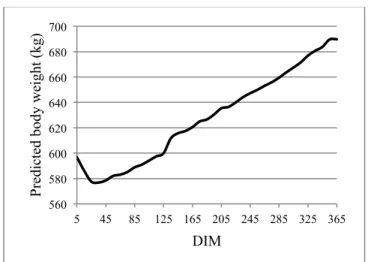
Figure 1 shows average daily CBW of dairy cows throughout DIM estimated using two equations developed by Laloux (2008). These CBW estimates were in the same range than actual BW measurements observed by Laloux (2008). The general trends of estimated daily PBW of dairy cows across DIM from the first step (results not shown) and the second step (Figure 2) of the prediction procedure were similar to those observed for CBW (Figure 1). However, addition of a second step to the procedure was associated with the smallest RMSE and MSE and showed the highest Rc2 between CBW and PBW (Table 1). This second step allowed predicting more accurately BW of dairy cows. Indeed, for each cow, PBW associated with the second step fitted better to CBW than PBW predicted by the first step of the prediction procedure (Figure 3). The second step re-gressed PBW towards CBW. For the first step, higher aver-age RMSE per class of 10 DIM were found for ml lactation (corresponding to the second Laloux’s equation; mean of RMSE=41.37) than for el lactation (related to the first Laloux’s equation; mean of RMSE=30.82). This difference could be due to lower accuracy of the ml Laloux’s equation compared to the el equation (0.73 vs. 0.86, respectively). In the opposite, average RMSE per class of 10 DIM were similar between el and ml lactation after the second step. Thus, a reduction of heterogeneity of residual variance was performed thanks to this second step.
Figure 2: Daily body weight of dairy cows in first lacta-tion across days in milk (DIM) predicted from the se-cond step of the prediction procedure.
Figure 3: Daily body weights estimated from equations based on conformation traits (CBW) and from the pre-diction procedure (PBW) for a given cow across days in milk (DIM) using the first (a) and the second (b) steps of the prediction procedure.
Table 1. Root mean square error (RMSE), mean abso-lute error (MAE), and r-square of correlation (Rc2)
be-tween body weight of dairy cows in first lactation esti-mated from equations based on conformation traits and body weight predicted with the first and the second steps of the prediction procedure.
RMSE MAE
First step 35.90 27.98
Second step 3.52 1.93
Rc2 between actual BW measurements and PBW of cows was higher when adding the second step of prediction procedure compared to PBW associated with the first step (0.889 vs. 0.603). Therefore, the second step predicted more accurately PBW than the first step and appears to be necessary to predict BW throughout DIM. Additional CBW per lactation or actual weightings could improve predic-tions’ accuracy and validate further this two-step approach.
Conclusion
Results showed that BW throughout lactation of dairy cows could be predicted based on CBW from linear conformation traits and BCS. The second step of the predic-tion procedure provided better estimates of PBW than using only the first step which was a regular mixed model. Modi-fication in the second step consisted in changing prior dis-tributions. With this methodology, PBW fitted better to known CBW and prediction errors were reduced. There-fore, the developed approach is an appropriate tool to gen-erate PBW estimates that could be integrated in milk re-cording schemes in order to predict daily DMI of dairy cows and to include this trait in breeding objectives. Obvi-ously, this procedure is dependent on the quality of CBW used as input and further research is needed to improve these equations and to validate this two-step approach. However, this procedure is also extremely flexible as actual weightings (e.g., as those generated linked to robotic milk-ing) can be used together with CBW, which can have dif-ferent levels of accuracies.
References
Banos, G., and Coffey, M. P. (2012). J. Dairy Sci. 95:2170-2175. Coffey, M. P., Simm, G., Hill, W. G. et al. (2003). J. Dairy Sci.
86:2205-2212.
Henderson, C. R. (1984). University of Guelph, Guelph, ON, Canada.
Huhtanen, P., Rinne, M., Mäntysaari, P. et al. (2011). Animal 5:691-702.
Koenen, E. P. C., and Groen, A. F. (1998). J. Dairy Sci. 81:1709-1713.
Laloux, L. (2008). Personal communication.
Misztal, I. (2012). http://nce.ads.uga.edu/wiki/doku.php/ Accessed on Dec. 2012.
NRC (2001). National Academy Press, Washington, DC, USA. Pryce, J. E., Wales, W. J., de Haas, Y., et al. (2014). Animal
8:1-10. 560 580 600 620 640 660 680 700 5 45 85 125 165 205 245 285 325 365
P
re
di
ct
ed body w
ei
ght
(kg)
DIM
540 590 640 690 740 5 45 85 125 165 205 245 285 325 365Body w
ei
ght
(kg)
DIM
CBW
PBW
a)
540 590 640 690 740 5 45 85 125 165 205 245 285 325 365
Body w
ei
ght
(kg)
DIM
CBW
PBW
b)
Quaas, R. L., and Zhang, Z. (2006). Proc. 8th World Congress Appl. Livest. CD-ROM communication Number 24-12.
Schaeffer, L. R., and Jamrozik, J. (1996). J. Dairy Sci. 79:2044-2055.
Willmott, C. J., and Matsuura, K. (2005). Clim. Res. 30:79-82. Zom, R. L. G., André, G., and van Vuuren, A. M. (2012). Livest.