DYNAMIC THERMAL MODELING OF A RADIANT PANELS SYSTEM AND ITS
ENVIRONMENT FOR COMMISSIONING: APPLICATION TO CASE STUDY
ABSTRACT
As a part of a commissioning study, the cooling ceiling system of a large commercial building located in Belgium is evaluated. A representative office has been instrumented and data on the cooling ceiling system operating in real conditions have been collected. The simulation of the whole system is performed by means of a dynamic thermal model of the building and its HVAC system. The model considers the radiant panels as a dynamic-state finned heat exchanger connected to a simplified lumped dynamic model of the building. The behavior of the radiant ceiling system and the interactions with his environment (walls, ventilated façade, internal loads and ventilation system) has been experimentally and numerically evaluated. Commissioning test results show that the influence of surfaces temperatures inside the room, especially the façade, is considerable. Then, it is clear that the radiant ceiling system must be evaluated together with its designed environment and not as separate HVAC equipment.
INTRODUCTION
Radiant ceiling systems have been used for many years in commercial applications. The radiant ceiling system consists actually in an air distribution system coupled to a cooled or heated ceiling surface. According to Conroy et al. (2005), cooling ceiling systems significantly reduce the amount of air transported through the building (often only about 20% of the normal all-air system air flow rates). This results in the reduction of the fan size, energy consumption and ductwork dimensions.
The radiant ceiling system employs long-wave radiation and convective heat exchanges to supply or remove heat from a space, and maintains acceptable indoor air quality and controls indoor air humidity by means of mechanical ventilation. The heating or cooling power of a radiant ceiling is a function of the heat transfer between the ceiling and its environment. This heat transfer is the sum of two terms: a radiation term and a convective term. The radiation heat
transfer depends of room geometry, surface characteristics of the ceiling, walls and façade and their interactions. The convective heat transfer is a function of the air velocity and direction at the ceiling level, the location and the geometry of the air diffusers, the panel perforations and the interactions with the internal heat sources.
The operation of a radiant ceiling system has also to prevent two side-effects associated with its presence in the building:
1. Deterioration of comfort conditions due to the asymmetrical character of the radiant heat exchange;
2. Condensation risk in cooling mode.
The few computer models currently available were developed specially as design tools for radiant cooling systems and usually as stand-alone programs to evaluate their performances. In general, these models cannot be used to determine the global behavior of radiant ceiling systems (cooling and heating) in any conditions other than the specific design conditions and without considering all the influences mentioned above.
In the first part of this paper, the studied system and the proposed dynamic model are described. A commissioning case study of a cooling ceiling system installed in an existing office building located in Brussels is then presented.
MODELING
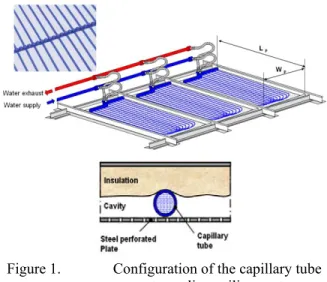
Studied systemRadiant ceiling systems generally exist in two constructive versions: copper tubes and synthetic capillary tube mats. The cooling ceiling system studied here uses cooling mats consisting of numerous thin capillary tubes (inner diameter = 2.3 mm) made in polyethylene that are arranged in parallel. The distance between the individual small tubes through which chilled water flows is small enough to ensure that a homogeneous temperature is produced on the bottom side of the ceiling (Figure 1). Nestor Fonseca Diaz
PhD Student
Facultad de Ingenieriá Mecánica Universidad Tecnológica de Pereira,
Colombia
Stephane Bertagnolio PhD Student Thermodynamics Laboratory University of Liège, Belgium
Philippe André Associate Professor Environmental Sciences and
Management Department University of Liège, Belgium
The cooling mats is placed on top of perforated metal ceiling panels with a layer of mineral wool installed above.
Figure 1. Configuration of the capillary tube mats cooling ceiling system The dynamic model developed in this study considers basically the heat exchange between a room and the adjacent zones. Several dynamic thermal balances in dry regime are calculated for the active radiant ceiling, the room, the ceiling void air and the adjacent walls (external and internal walls as well as ceiling and floor slabs). The window behavior is modeled assuming steady-state condition. The main model inputs are the air temperature of the adjacent zones, the water temperature and mass flow rate, internal thermal loads and the supply air temperature and flow rate at the diffuser discharge. The model allows estimating the water exhaust temperature, radiant ceiling average surface temperature, resultant and dry air temperatures, the radiant ceiling power and also the internal surface temperatures of the room in order to compare with the measurements recorded during the commissioning process.
Convective and radiation heat exchanges are not aggregated in the present model and air convective and mean radiant temperatures are computed.
Radiant ceiling system model
As shown in Figure 2, a detailed R-C model is used to simulate the thermal behavior of the system. Considering the symmetry between tubes, the applicable boundary conditions are:
1) No heat flow in the fin representing the ceiling at midway between the tubes;
2) Ceiling fin base temperature (tRC,0) and the
fin temperature immediately below the tube.
Figure 2. R-C model scheme
The radiant ceiling can be considers therefore as a fin where only the dry regime is considered. The thermal balance of this sub-system considers the convective heat transfer on the water side (in transition or turbulent flow as the main design conditions), conduction through the tube shell and union system (tube-ceiling surface) and convective and radiation heat transfers from the tube external surface and ceiling surface to the ceiling cavity and room.
The radiant ceiling model is described in details in Fonseca et al. 2009a. The fin effectiveness, mixed convection close to the radiant ceiling surface (generated by the ventilation system) and panel perforations influence are considered.
The total thermal power extracted from the zone by water ( in cooling mode can be calculated from the dynamic water (eq. 1) and radiant ceiling (eq. 2) thermal balances as:
(1) (2) And (3) (4) (5) (6) Where
− is the total thermal energy extracted by the radiant ceiling panel, [W];
− is the heat flow rate through the tube external surface from the ceiling cavity, [W];
− is the heat flow (convection + radiation) coming from the ceiling cavity, [W];
− is the heat flow (convection + radiation) coming from the room, [W]; − is the radiative fraction of the
room internal thermal load on the radiant ceiling, [W];
− is the thermal of the water into the active radiant ceiling, [W K-1];
− is the global radian ceiling thermal mass (tubes, union system and metalic plates) , [W K-1].
Thermal zone model
Two zones are considered in this global model: the room and the ceiling void. Each zone is represented by means of a sensible convective thermal balance. The dynamic behavior of each zone is modeled by an air thermal capacity corrected in order to take into account the thermal capacity of the furniture included in the zone.
The thermal balance of the room (eq.4) includes the convective part of the internal loads, the sensible contribution of the mechanical ventilation and the convective heat exchange between the indoor air and the surrounding surfaces (cooling ceiling and horizontal and vertical walls…). The mathematical expression of this third thermal balance is given by equations 7 to 9.
(7)
(8)
(9)
The same method is applied to the ceiling cavity. This second dynamic thermal balance includes the convective heat exchanges with the surrounding surfaces (including the cooling ceiling system), the convective heat gain from lighting fixture and water and air conduits (Figure 3).
The convective heat transfer coefficients along the internal sides of the zones vertical walls are calculated by Churchill and Chu correlations (Incropera and DeWitt, 1996), over the entire range of Rayleigh number (eq. 10).
(10) Where
- Nus is the Nusselt number, [-]; - Ra is the Rayleigh number, [-];
- Pr is the Prandlt number, [-].
Figure 3. View of the ceiling void For the floor surface the Mc Adams correlations are used (Incropera and DeWitt, 1996):
− For an upper cooled surface: Ra 105 to 1010
(11) − For an upper heated surface: Ra 104 to 105
(12) The convective heat exchange on the radiant ceiling surface (active or inactive) is a more complex process, considering the combined effects of ventilation, ceiling perforations, internal thermal loads, facade and radiant ceiling operation. The too important number of configurations and possible combinations of these elements in the modern buildings avoid describing completely the phenomenon with a correlative method. The existing correlations were developed based on experimental measurement for some specific conditions of ventilation and internal thermal loads (Alamdari and Hammond, 1983, Spitler and Fisher, 1991, Awbi and Hatton, 2000). Some experimental studies were performed considering the individual influence of some of these parameters on the comfort conditions: Different Load distributions effect (Behne, 1996), ventilation system effect (Kulpmann, 1993) (Behne, 1999), façade effect (Fredriksson et al, 2001), therefore it can be only an approximation of the actual phenomenon.
According to ASHRAE (2004), only natural convection (NC) should be considered on the cooling ceiling surface. Incropera and DeWitt (1996) suggest:
(13) For pure natural convection in cooling mode for a cooled plate facing downwards the coefficient are Ch,RC,room=0.54 and n=4 (for 104≤Ra≤107) or Ch,RC, room=0.15 and n=3 (for 107≤Ra≤1011). For these heat
transfer coefficient calculations, the characteristic length of the radiant ceiling panel is defined as the ratio between the panel area and its perimeter.
As mentioned before, to prevent any condensation risk, moisture has usually to be removed from the room through a mechanical ventilation system which generates some air movement around the ceiling system. This makes that the above-defined natural convection heat transfer coefficient needs to be affected by a correction factor (including also the effect of the panels’ perforations).
Forced convection (FC) is negligible if (GrL/ReL2) »
1. Hence the combined free and forced (or mixed) convection regime is generally one for which (GrL/ReL2) ≈ 1. In this study, the current order of
magnitude found for (GrL/ReL2) is 0.9 to 0.68.
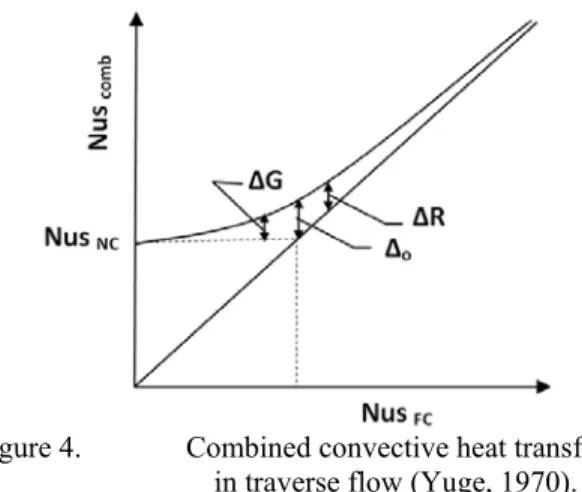
Therefore to combine the effects of natural and forced convection at ceiling surface the Yuge (1970) method is used.
Figure 4. Combined convective heat transfer in traverse flow (Yuge, 1970). The effect of buoyancy on heat transfer in a forced flow is strongly influenced by the direction of the buoyancy force relative to that of the flow. For a perpendicular direction (traverse flow) between the horizontal ventilation flow and the vertical natural convection heat transfer, buoyancy acts to enhance the rate of heat transfer associated with pure forced convection. The Yuge correlative method is used to compute a natural-forced combined Nusselt number which can be used to compute the combined local heat transfer coefficient.
The natural convection Nusselt (NusRC,NC) number is
computed by means of eq. 13. For a ventilated radiant ceiling, the Reynolds number close to the diffusers is usually around 25000 and the equation 14 can be used for forced convection (FC) on a horizontal plate in parallel and laminar flow (Incropera and DeWitt, 1996).
(14)
With:
(15)
The air velocity on the cooling ceiling (u∞) and the
characteristic length in forced convection (LRC,FC :
distance of jet detachment) are defined from diffuser manufacturer’s catalogue.
Finally, the combined local heat transfer coefficient is given by eq. 16.
(16) The characteristic length of combined convection (Lc,RC) is usually obtained from experiments,
considering various ventilation systems, thermal load types and distributions as well as the facade effect.
Wall model
The heat flow passing through the room envelope is the sum of two contributions: the heat transmission trough windows (without thermal inertia effect) and opaque massive walls (with thermal inertia effect). A two-port R-C network model is used to simulate each surrounding wall (floor and ceiling slabs, partition walls…) massive walls. The parameters of this wall R-C network are adjusted through a frequency characteristic analysis. This building zone model has been successfully validated by means of analytical, experimental and comparative validation tests (Bertagnolio et al., 2008).
In the present study, isothermal boundary conditions (Masy, 2008) are used for external and internal walls. The admittance matrix method is used to calculate the whole wall transmittance and admittance whose modulus are imposed to the 2R1C model in order to adjust its parameters.
Figure 5. Equivalent R-C Two-port network for the room external wall The (convective) thermal balance on the internal node of the external wall model can be expressed as follows:
(17)
(19)
(20)
The values and are the accessibility and proportion parameters respectively (R-C network) of the considered wall. They are obtained using the admittance method mentioned above (Masy, 2008). On the outdoor side, in the case of external walls, solar gains and sky infrared losses are taken into account and injected or taken out of the surface node of the wall (Figure 5). The external surface convective heat transfer coefficient is based on the following formula (eq. 21) for Re from 5*105 to 108
and Pr from 0.6 to 60 by (Incropera and DeWitt, 1996):
(21) On the indoor side, radiation gains (solar gains entering the zone through windows and radiation part of internal loads) are distributed over all the internal surfaces and injected on internal surface nodes. The convective and radiation fractions of internal gains are estimated according to ASHRAE (2009). Radiation heat exchanges between walls are computed by means of the view factors method. In order to analyze the internal surface radiant exchanges ( ) for a multi-surface case, each surface i of the enclosure can be characterized by its uniform radiosity and irradiation. The net radiative heat flux of the ceiling surface can be evaluated by Eq. (22) and (23) from radiosities (Ji), emissivities (ε i
), areas (A i), view factors (F i j) and black body
emissive powers (Ebi)
(22)
(23)
The view factors can be calculated using the software EES (Klein, 2008) for the surfaces considered in Figure 6.
Figure 6. Considered room radiation surfaces
The net radiant heat flux at the ceiling surface can be determined by solving the unknown J i. This method
supposes that the (supposed-to-be uniform) surface temperatures are known.
MRT calculation
The operation conditions and performances of a radiant ceiling system during the commissioning processes must be evaluated not only in terms of capacity of the system but also considering the comfort of the occupants. As the radiant ceiling can be operating correctly according to the design conditions (as-built files) its operation must be related also with its global behavior considering the interaction with the fenestration and ventilation system. The resultant temperature and PMV-PDD indices are therefore used here as comfort variable in order to evaluate the global performance of the system.
In this study the resultant temperature is estimated from the base of the calculated mean radiant temperature (MRT) viewed by a sphere of 60 cm of diameter (representing a seat person) placed in different positions into the room and the room air and surfaces temperatures calculated by the model. The MRT temperature can be calculated as given by eq. 24.
(24)
The view factors (F0,j) can be calculated using the
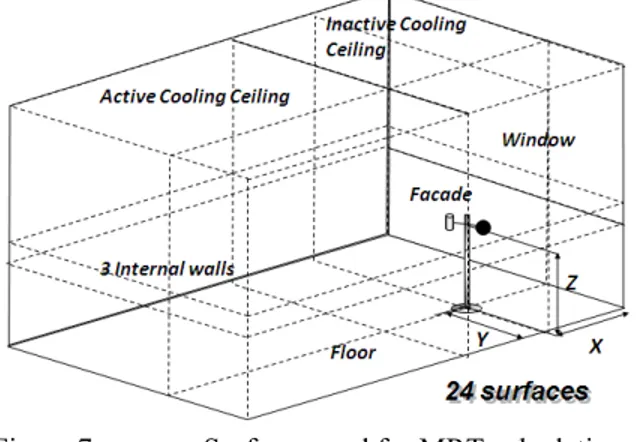
software EES (Klein, 2008) for the configuration and the surfaces and sphere positions shown in Figure 7. The number of surfaces and position of the globe sensor are fixed according to the experimental conditions during laboratory test and/or commissioning processes. These conditions consider the possible stratification of the surface temperature in the ceiling, internal walls and façade.
Figure 7. Surfaces used for MRT calculation Then, the calculated MRT can be compared with the globe temperature measurements at the same place to
evaluate the comfort conditions in different places into the room, in the frame of the design or commissioning process.
PMV and PPD indices are calculated by means of the classical Fanger’s method described in ASHRAE (2009).
COMMISSIONING CASE STUDY
The cooling ceiling system of a commercial building in Brussels is experimentally evaluated by means of a functional test procedure and a detailed dynamic thermal model of this system and its environment. The commissioning procedure and the experimental set-up are described in details in Fonseca et al. (2009b). In that work, a static model was used to evaluate the radiant ceiling performance. It was found that even if the radiant ceiling is operating according to the manufacturer data, the comfort of the occupants is not always reached. Due to the extended glazing surface of the building, overheating is noticed in zones submitted to solar heat gains. Indeed, the PMV value was about 1.6, resulting in a PPD of about 57 %. At the end of this first study, it was concluded that the cooling ceiling must be evaluated together with its designed environment and not as separate HVAC equipment. Therefore in this work the system is evaluated coupled with its environment and considering transient behavior by means of the model described above.
Building and radiant ceiling characteristics
The radiant ceiling consists in capillary tube mats installed on top of perforated metal panels with upward insulation. The internal walls are made in security glazing and isolated metallic panels. The floor and ceiling slab are made in 130 mm concrete layer. The floor is composed by a carpet on metal deck above an air space 10 cm (see Figure 8)
Figure 8. Room and radiant ceiling characteristics.
The double skin façade is composed of an external double glazing, a ventilated air layer with solar protections and an internal single glazing. The cavity
between the two glazed layers is ventilated with return room air, which is extracted from the room at the base of the glazing and rejected to the ventilation system from the top. The shading devices between two layers of glazing capture the major part of the incident solar energy within the cavity. The hydraulic circuit is shown in Figure 9. Only 77% of the ceiling surface is active.
Figure 9. Hydraulic circuit
Measurements
The dynamic test was performed during summer time (July 7).. The cooling ceiling is activated from around 5:30 to 19:30.
Figure 10 shows that the air control temperature (red curve) of the system (taken with the system sensor) is systematically lower than the resultant temperatures (measured at 75 cm from the floor and 1.5 m and 0.5 m from the façade, green and black curves). It is due to the wrong position of the control sensor into the room (close to the room door, Figure 9) that not considers the overheating close to the facade.
At the beginning of the test, the ventilation system is used to supply warm air to simulate internal thermal loads (occupancy). For the dynamic simulation it is assumed that all of the adjacent zones are at the same air temperature. The ventilated façade cavity is considered as an adjacent zone characterized by a temperature equal to the average of the measured supply and exhaust air temperatures. The heat transfer coefficient on the outter face of the glazing is calculated by equation 21, from the measured mass flow rate and velocity considering forced convection.
Figure 10. Measured air temperatures The Root Mean Square error (RMS) is used to compare the measured and calculated values of the temperatures profiles (eq. 25).
(25)
Commissioning results
The contact thermal resistance and heat transfer coefficient of this type of radiant ceiling are obtained in steady state conditions from experimental test (Fonseca et al. 2009a) and used in the dynamic model as parameters. The parameters to calibrate here are the distance and velocity of the jet detachment considering that they are specific to the diffuser model.
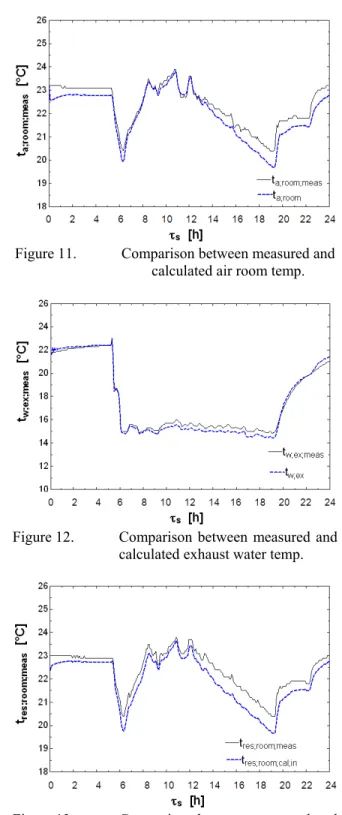
The comparison between the calculated and the measured values of the room air temperature and water exhaust temperatures are shown, respectively, in Figures 11 and 12. The measured and calculated values of the resultant temperature at 75 cm from the floor and 1.5m from the façade are shown in Figure 13. A maximal variation of 0.5K is observed. The RMS errors are given in Table 1 and are of the same order of magnitude as the measurement uncertainty (Fonseca et al., 2009b). Table 1. RMS error Temperature RMS value Air room ±0.39K Water exhaust ±0.43K Air resultant ±0.47K
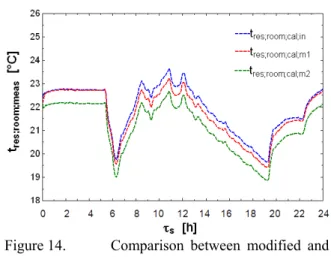
As a part of the commissioning process, the dynamic model of the radiant ceiling system coupled with the room, allows an evaluation of the possible measures envisaged to improve indoor comfort. If the panels close to the façade were activated, the effective radiant ceiling area would be enhanced of 18%. The effect of this modification (m1), with the other conditions unchanged, on the resultant temperature
previously calculated (condition initial (in)) can be observed in Figure 14. Only an average reduction of 0.35 K on the resultant temperature can be reached by means of this modification.
Figure 11. Comparison between measured and calculated air room temp.
Figure 12. Comparison between measured and calculated exhaust water temp.
Figure 13. Comparison between measured and calculated resultant temp.
ASHRAE. 2004. ASHRAE Handbook: HVAC Systems and Equipment. Chapter 6. Atlanta: American Society of Heating, Air-Conditioning and Refrigeration Engineers, Inc.
Awbi H. and Hatton A. 2000. Mixed convection from heated room surfaces. Energy and Buildings. Vol 32. Pp 153-166.
Behne M. 1996. Is there a risk of draft in rooms with cooled ceilings. Measurement of air velocities and turbulences ; ASHRAE Transactions: Symposia – SD 96-4-5; p.p 744-751.
Bertagnolio S, Masy G, Lebrun J, André P (2008). Building and HVAC System simulation with the help of an engineering equation solver. Proceedings of the Simbuild 2008 Conference, Berkeley, USA.
Figure 14. Comparison between modified and initial resultant temperatures.
Conroy C. and Mumma S. 2005. Ceiling Radiant Cooling Panels as a viable distributed Parallel Sensible Cooling Technology integrated with dedicated Outdoor air Systems. ASHRAE tarnsactions, 107. Part 1 AT-01-7-5.
A second measure could be the lowering of the supply water temperature. Of course, this modification of the operating conditions is limited to avoid condensation risk. The effect of a reduction of 1.5K (13.5 to 12 °C) is shown in Figure 14.Actually, the combination of these two measures does not lead to a sufficient improvement and the only way to reduce the room resultant temperature in an efficient manner is to consider some modification of the shading devices.
Fonseca N., Lebrun J. André P. 2009a. Thermal modeling of the cooling ceiling systems as commissioning tool. Building Simulation 2009. Eleventh International IBPSA Conference. Glasgow, Scotland. pp. 1997-2004
Fonseca N., André P., Cuevas C. 2009b. Commissioning case study of a cooling ceiling system. Building Simulation 2009. Eleventh International IBPSA Conference. Glasgow, Scotland. pp. 1997-2004.
CONCLUSION
A dynamic model of a radiant ceiling system and its environment are presented here as a part of a commissioning study. A good agreement is found between simulated and measured values. The results show that the RMS error between simulated and measured values is lower than ±0.5 K. The theoretical approach gives to the user an appropriate tool for preliminary calculation, design and diagnosis in commissioning processes.
Fredriksson J., Sandberg M., Moshfegh B.2001. Experimental investigation of the velocity fiel and airflow pattern generated by cooling ceiling beams. Building and Environment. Vol 36. pp. 891-899.
Incropera F. and DeWitt D. 1996. Fundamentals of Heat and Mass Transfer. Fourth Edition. School of Mechanical Engineering Purdue University. The radiant ceiling behavior must be verified by
coupling it with the corresponding structure of building (Façade, walls, internal loads and ventilation system), climate and functioning conditions. Therefore a simulation of the whole system must be performed by using a dynamic model and this procedure should be included in the Functional Performance Testing (FPT) of this system for the commissioning procedure.
Klein, S.A. 2009. Engineering Equation Solver. F-chart sofware.
Kulpmann R. 1993 Thermal comfort and air quality in rooms with cooled ceilings – results of scientific investigations; ASHRAE Transactions: Symposia – DE 93 – 2 – 2; p.p 488-502.
Masy G. 2008. Definition and validation of a Simplified multizone dynamic building model connected to heating system and HVAC unit. PhD Thesis. University of Liege. Liege Belgium.
REFERENCES
Alamdari F. and Hammond P. 1983. Improved data correlations for bouyancy-driven convection in rooms.Building Services Engineering research and Techonology. Vol 4. N° 3. Pp.106-112.
Yuge T. 1970. Experiments on heat transfer from spheres including combined natural and forced convection. Trans. ASME Journal of Heat Transfer 82 (1960)3 pp 214-220. ASHRAE 2009. ASHRAE Handbook: Fundamentals
Atlanta: American Society of Heating, Air-Conditioning and Refrigeration Engineers, Inc.