897
P
OPULATION GENETIC STRUCTURE OF WILD
P
HASEOLUS
LUNATUS
(F
ABACEAE
),
WITH SPECIAL REFERENCE TO
POPULATION SIZES
1I
RIE
´
Z
ORO
B
I
,
2A
LAIN
M
AQUET
,
3AND
J
EAN
-P
IERRE
B
AUDOIN
4,52UFR des Sciences de la Nature, Universite´ d’Abobo-Adjame´, 02 BP 801 Abidjan 02, Coˆte d’Ivoire; 3European Commission, DG Joint Research Centre, Institute for Reference Materials and Measurements, Retieseweg,
B-2440 Geel, Belgium; and
4Unite´ de Phytotechnie tropicale et d’Horticulture, Faculte´ universitaire des Sciences agronomiques, 2, Passage des De´porte´s, B-5030 Gembloux, Belgium
To set up an in situ conservation strategy for Phaseolus lunatus, we analyzed the genetic structure of 29 populations in the Central Valley of Costa Rica. Using 22 enzyme loci, we quantified the proportion of polymorphic loci (Pp), the mean number of alleles per locus (A), and the mean effective number of alleles per locus (Ae), which equaled to 10.32%, 1.10, and 1.05, respectively. The total heterozygosity (HT), the intrapopulation genetic diversity (HS), and the interpopulation genetic diversity (DST) were 0.193, 0.082, and 0.111, respectively. The genotypic composition of the analyzed populations showed a deviation from the Hardy-Weinberg proportions (FIT50.932). This disequilibrium was due to either genetic differentiation between populations (FST50.497) or nonrandom mating within populations (FIS50.866). From the level of genetic differentiation between populations and the private alleles frequencies estimates, gene flow was calculated: NmW50.398 and NmS50.023, respectively. The results suggested that wild Lima bean maintains most of its isozyme variation among populations. Significant positive correlation was observed between population size and Pp, A, and Ho(observed heterozygosity), whereas no correlation was observed with the average fixation index of population (F). The loss of genetic variability in populations was attributed to inbreeding and the bottleneck effects that characterized the target populations. In situ conservation and management procedures for wild Lima bean are discussed.
Key words: Costa Rica; Fabaceae; gene flow; genetic diversity; in situ conservation; isozymes; Lima bean; Phaseolus lunatus; population size.
The conservation of genetic resources using complementary
ex situ and in situ methods has attracted growing public and
scientific interest and support. Wild relatives of cultivated
crops receive special attention because of their poor
represen-tation in gene banks and their high value as large stores of
genetic variation (Frankel, 1974; Brown, 1978; Marshall,
1990). However, wild materials are often difficult to maintain
in germplasm collections (Marshall, 1990; Debouck et al.,
1993). In situ conservation facilitates the continuing evolution
of the gene pool and is a way of circumventing some of the
difficulties of ex situ conservation (Altieri and Merrick, 1987;
Brown et al., 1997).
Detailed studies of the ecology, population biology,
genet-ics, and reproductive biology of a target species are essential
for successful conservation (Hawkes, 1971; Lande, 1988).
With regard to genetics, for example, ecological factors and
life history traits may affect the distribution of genetic
diver-sity within and among plant populations (Loveless and
Ham-rick, 1984; Hamrick and Godt, 1990). Genetic variability is
also known to increase fitness in populations of many plant
1Manuscript received 26 July 2002; revision accepted 19 December 2002. The authors thank those at the Escuela de Biologı´a of the Universidad de Costa Rica, particularly Professor Oscar Rocha, for direct contribution to the preservation and characterization of wild Lima beans in the Central Valley of Costa Rica and their involvement in the project. The authors thank also Dr. Jerome Degreef for assistance with plant sampling. Helpful comments of Dr. Xavier Vekemans and two anonymous reviewers resulted in significant im-provement of the manuscript. This research was financed by the Direction Ge´ne´rale de la Coope´ration Internationale (DGCI, Brussels, Belgium) and supervised by IPGRI (Rome, Italy). A scholarship to the first author was provided by the Scientific Research Ministry of the Coˆte d’Ivoire.
5Author for correspondence (E-mail: [email protected]).
and animal species (Hamrick et al., 1979; Barrett and Kohn,
1991).
Population genetic theory predicts the loss of genetic
di-versity in populations that remain small for several generations
(genetic drift), in populations initiated from a low number of
colonists (founder effect), and in populations that suffer rapid
declines in size (population bottleneck), particularly if
recov-ery is slow or if size fluctuations are frequent (Barrett and
Kohn, 1991). However, divergent results have been reported
on the relationships between plant population genetic
vari-ability and population size for several species (van Treuren et
al., 1993; Wide´n, 1993; Dolan, 1994; Oostermeijer et al.,
1994; Raijmann et al., 1994; Weidema et al., 1996;
Montgom-ery et al., 2000).
With the aim to develop a strategy for in situ conservation,
we initiated a study in the Central Valley of Costa Rica to
understand mechanisms controlling the genetic structure and
population dynamics of the wild Lima bean, Phaseolus lunatus
L. Such material represents a very important genetic reservoir
for the improvement of the various Phaseolus bean cultigens
(Maquet and Baudoin, 1997). Phaseolus lunatus was also used
as a plant model because of its alternating
outbreeder-inbreed-er behavior. Lima bean is a self-compatible annual or
short-living perennial species with a mixed-mating system; that is,
it is predominantly self-pollinating (Baudoin et al., 1998).
Wild individuals are characterized by an indeterminate,
climb-ing, vigorous growth habit, a prolonged flowering period
(mid-November to mid-February), and a heavy pod load. Around
400 wild P. lunatus populations have been recorded in
collab-oration with the University of San Jose´ (Costa Rica) in the
target area, which covers 2100 km
2, in variants of premontane
Fig. 1. Location of the 29 wild Phaseolus lunatus populations sampled in the Central Valley of Costa Rica.
500 to 1800 m a.s.l. These wild populations are usually found
in open and disturbed areas with grasses and scattered trees or
bushy thickets; they also colonize coffee plantations from the
long-living fences (usually Erythrina and euphorbs) bordering
the plots. Each year, some wild Lima bean populations are
eliminated by land management (Rocha et al., 1997).
The number of plants per population reaching reproductive
age differs markedly among years, varying from 1 to 50 plants
but only 16% of the populations contained more than five
pod-bearing plants. Reproductive individuals can bear several
ra-cemes (around 400 each) with 1–20 pods per raceme, each
pod containing 1–5 seeds. In the soil seed bank, Degreef et
al. (2002) found 3–5 seeds/m
2, and they estimated the annual
germination rate ranging from 70 to 86%. In a study of
allo-zyme polymorphisms in Lima bean, Maquet et al. (1996,
1997) estimated genetic structure parameters using 10 putative
enzyme loci and 20 wild populations. To refine estimates of
population parameter, 12 additional enzyme loci were resolved
and their genetic basis established (Zoro Bi et al., 1999).
Op-timum sampling strategies integrating criteria of efficiency
rel-evant to multilocus and many target populations also have
been investigated, in particular the number of plants and the
number of seeds to be sampled (Zoro Bi et al., 1998). For the
present study specifically, our goals were (1) to estimate the
amount of genetic diversity within populations; (2) to
deter-mine the degree of genetic differentiation and gene flow
among populations; and (3) to examine the relationship
be-tween the size of wild Lima bean populations and their genetic
variability.
MATERIALS AND METHODS
Plant materials and sampling method—Twenty-nine wild Lima bean
pop-ulations distributed in the Central Valley of Costa Rica (Fig. 1) were sampled during January to March of 1995, 1996, 1997, and 1998, corresponding to
the date of plant physiological maturity. Each population was followed during a complete season so that all individuals bearing pods during this season were sampled. A population is here defined as any set of individuals regardless of size that live in the same habitat patch and therefore interact with each other and are isolated by at least 500 m from other plants of the same species. In each selected population, we sampled all pod-bearing plants, resulting in sam-ple sizes of 1–60 plants per population and 4–6 racemes per plant. One seed was randomly chosen per raceme for electrophoretic analysis, resulting in sample sizes ranging from 4 to 334 seeds per population. The selected pop-ulations were representative of the four ecological zones in which the majority of the populations were located (Degreef, 1998) and were identified by several alphanumeric codes (Rocha et al., 1997).
Genetic characterization—For electrophoretic variation, we analyzed 22
readable and reproducible enzyme loci resolved from 15 enzymatic systems: aconitate hydratase (ACO, E.C. 4.2.1.3), alcohol dehydrogenase (ADH, E.C. 1.1.1.1), diaphorase (DIA, E.C. 1.8.1.4), endopeptidase (END, E.C. 3.4.-.-), fluorimetric and colorimetric esterases (fEST and cEST, E.C. 3.1.1.-), glucose-6-phosphate isomerase (GPI, E.C. 5.3.1.9), glutamate dehydrogenase (GDH, E.C. 1.4.1.2), isocitrate dehydrogenase (IDH, E.C. 1.1.1.42), leucine amino-peptidase (LAP, E.C. 3.4.11.1), malate dehydrogenase (MDH, E.C. 1.1.1.37), phosphoglucomutase (PGM, E.C. 5.4.2.2), phosphogluconate dehydrogenase (PGDH, E.C. 1.1.1.44), shikimate dehydrogenase (SKDH, E.C. 1.1.1.25), and superoxide dismutase (SOD, E.C. 1.15.1.1). Enzymes were extracted by grind-ing 5-d-old cotyledon tissues in a potassium phosphate buffer, pH 7.0, con-taining 20% sucrose (Sigma S-8501 [Bornheim, Flanders, Belgium]), 5% PVP-40, 0.05% triton X-100 (Sigma T-8532), 14 mmol/L 2-mercaptoethanol (Sigma M-6250), and 0.1 mol/L KH2PO4. The pH value was adjusted to 7.0 with a solution of 5 mol/L NaOH. Electrophoresis was performed using a horizontal 10% starch-gel (Sigma S-4501) containing 3% sucrose. Two buffer systems were employed: continuous histidine-citrate, pH 6.1 (Kazan et al., 1993) for ADH GPI, IDH, LAP, MDH, and PGDH, and discontinuous lithium-borate, pH 8.1/Tris-citrate, pH 8.4 (Murphy et al., 1990) for ACO, DIA, END, cEST, fEST, GDH, PGM, SKDH, and SOD. The techniques for gel electro-phoresis and histochemical staining procedures are those reported elsewhere (Zoro Bi et al., 1999).
TABLE 1. Population acronyms (alphanumeric codes), sample sizes, estimates of genetic diversity, average fixation index (F), and summary of results of tests for deviations of genotypic frequencies from Hardy-Weinberg equilibrium in 29 wild populations of Phaseolus lunatus.
Population
Sample size
m n
Genetic diversity indices
Pp A Ae Ho He F H-W deviations Tests HE HD NS A1 E25 E35 E50 E54 E59 E76 E83 E84 E88 E100 E110 E111 E114 G1 G19 HER3 J11 J48 J59 J72 3 39 4 18 21 4 10 5 19 21 60 5 1 2 38 3 2 4 51 7 3 12 144 16 86 82 16 58 20 109 151 334 16 4 8 137 12 8 16 202 27 11 5 19.05 0 14.29 9.52 0 23.81 9.52 23.81 19.05 18.18 4.76 0 4.76 13.64 0 13.64 4.55 18.18 4.55 9.09 1.05 1.19 1 1.14 1.10 1 1.24 1.10 1.24 1.19 1.18 1.05 1 1.05 1.14 1 1.14 1.05 1.18 1.05 1.09 1.01 1.05 1 1.08 1.06 1 1.08 1.08 1.11 1.15 1.08 1.05 1 1.05 1.06 1 1.14 1.03 1.04 1.01 1.02 0 0.005 0 0.010 0.014 0 0.008 0.012 0.012 0.033 0.012 0 0 0 0.009 0 0 0.011 0.005 0 0.016 0.008 0.032 0 0.051 0.037 0 0.057 0.026 0.066 0.083 0.050 0.033 0 0.025 0.034 0 0.073 0.020 0.024 0.007 0.015 1 0.84 — 0.80 0.62 — 0.86 0.54 0.82 0.60 0.76 1 — 1 0.74 — 1 0.45ns 0.79 1 20.07ns 1 4 0 3 2 0 5 2 5 4 4 1 0 1 3 0 3 1 4 1 1 0 0 0 0 0 0 0 0 0 0 0 0 0 0 0 0 0 0 0 0 0 1 3 0 3 2 0 5 1 5 4 4 1 0 1 3 0 3 0 4 1 0 0 1 0 0 0 0 0 1 0 0 0 0 0 0 0 0 0 1 0 0 1 J87 KM12 KM30 KM32 KM63 S15 ST44 TR54 Mean SE 26 3 28 6 8 4 3 21 17 17 102 12 109 24 31 16 12 137 78 83 5.26 18.18 14.29 4.55 4.55 4.55 18.18 14.29 10.32 7.30 1.05 1.18 1.14 1.05 1.05 1.05 1.18 1.14 1.10 0.07 1.02 1.05 1.04 1.06 1 1.05 1.11 1.12 1.05 0.04 0.005 0.008 0.002 0 0 0 0.008 0.007 0.006 0.007 0.017 0.038 0.025 0.012 0 0.023 0.065 0.064 0.030 0.024 0.71 0.79 0.92 1 — 1 0.88 0.99 0.79 0.24 1 2 3 1 0 1 3 3 0 0 0 0 0 0 0 0 1 2 3 1 0 1 3 3 0 0 0 0 0 0 0 0
Notes: m, the number of pod-bearing plants; n, the number of seeds collected; Pp, the percentage of polymorphic loci; A, the mean number of alleles per locus; Ae, the effective number of alleles per locus; Ho, the observed heterozygosity; and He, the heterozygosity expected under Hardy-Weinberg equilibrium. Tests indicate the number of loci for which tests could be performed: HE, the number of loci with a significant excess of heterozygotes; HD, the number of loci with a significant deficiency of heterozygotes; and NS, the number of loci with nonsignificant inbreeding coefficients. SE is the standard error.nsindicates a nonsignificant value.
Loci were labeled sequentially, with those migrating closest to the anodal end designated as number 1. Accession G25221 from the collection of the Centro Internacional de Agricultura Tropical (CIAT, Cali, Colombia), a Mex-ican wild form, was used as the control for our analyses. The allozyme from this genotype was designated 100, and all other allozymes were assessed according to their relative migration distance. The genetic control and the quaternary structure of the analyzed enzyme systems have been discussed previously (Zoro Bi et al., 1999).
Data analysis—Most of the following genetic variability indices were
cal-culated using the computer programs GENSURVEY (Vekemans and Lefe`b-vre, 1997). Statistical analyses of correlations were done using the SAS sta-tistical package version 8.2 (SAS Institute, 1990).
Genetic diversity and population-level homozygosity—To estimate
popu-lation-level genetic variability, the allozyme multilocus genotype data were used to calculate the proportion of polymorphic loci (Pp; 99% criterion), the mean number of alleles per locus (A), the effective number of alleles per locus (Ae), and the observed (Ho), and expected (He) heterozygosity corrected for small sample size (Nei, 1987).
Wright’s F [F 5 (1 2 Ho/He)], the inbreeding coefficient, measures the deviation of population genotypic composition from Hardy-Weinberg (H-W) expectations. If inbreeding is avoided, F 5 0; negative F indices are usually from selection in favor of the heterozygotes whereas positive values indicate that the considered population has an inbreeding system of mating. The in-breeding coefficient was calculated at each polymorphic locus and tested for
significant deviation using x2tests (Li and Horvitz, 1953). The average fix-ation indices were also calculated for each populfix-ation and tested for significant difference from zero.
Genetic structure and gene flow—The partitioning of total genetic diversity
into within- and among-population components was examined using Nei’s (1973, 1987) genetic diversity statistics. For each polymorphic locus, total gene diversity (HT) was partitioned into diversity within populations (HS) and diversity among populations (DST) as HT5HS1DST. A measure of genetic differentiation among populations relative to the total genetic diversity (GST) was calculated at each polymorphic locus (GST5DST/HT). Theoretically, GST ranges from zero (all genetic variation maintained within populations) to one (all genetic variation maintained among populations). The genetic structure of the studied populations was also analyzed in term of F statistics (FIT, FIS, and FST) following Weir and Cockerham (1984). GSTand FSTwere tested for significant difference from zero using a x2 test (Workman and Niswander, 1970). The number of migrants into a population per generation (Nm) was estimated using Wright’s (1951) equation as modified by Crow and Aoki (1984) and the private alleles method (Slatkin, 1985; Barton and Slatkin, 1986).
Genetic diversity and population size—To examine the relationships
be-tween population size and genetic variation encoded by isozyme loci, Spear-man rank correlation coefficients (r) were calculated and tested for significant difference from zero. The population size was expressed as both sampled pod-bearing plants number, m, and the total number of seeds collected per
popu-TABLE2. Nei’s (1973) genetic diversity indices, F statistics, and estimates of interpopulation gene flow.
Locus
Nei’s genetic diversity indices
HT HS DST GST F statistics FIT FIS FST Gene flow NmW NmS Adh-2 Dia-1 cEst-2 fEst-2 Gpi-1 Mdh-2 Pgdh-1 Pgm-2 Skdh Mean SE 0.331 0.023 0.343 0.011 0.067 0.488 0.050 0.343 0.083 0.193 0.181 0.139 0.019 0.163 0.009 0 0.203 0.013 0.131 0.062 0.082 0.077 0.192 0.005 0.180 0.002 0.067 0.285 0.037 0.212 0.021 0.111 0.106 0.580 0.210 0.524 0.159 1 0.584 0.743 0.618 0.250 0.519 0.273 0.860 0.924 0.991 0.914 1 0.814 1 0.909 0.973 0.932 0.066 0.776 0.874 0.897 0.899 1 0.761 1 0.617 0.971 0.866 0.128 0.383 0.217 0.919 0.152 0.999 0.217 0.747 0.763 0.081 0.497 0.358 0.169 0.877 0.212 1.233 0.000 0.166 0.081 0.144 0.699 0.398 0.430 0.023
Notes: HT, the total genetic diversity; HS, the genetic diversity within populations; DST, the genetic diversity among populations; GST, the among-populations gene differentiation coefficient; FIT, the mean inbreeding coefficient of a set of among-populations; FIS, the fixation index related to nonrandom mating within populations; FST, the interpopulation genetic differentiation due to genetic draft; NmW, the gene flow estimate according to Wright’s (1951) equation; NmS, the gene flow estimate based on Slatkin’s (1985) private alleles method; and SE, the standard error.
lation, n (Table 1). The intrapopulation genetic variation considered for this analysis was characterized through the following indices: the proportion of polymorphic loci (Pp), the mean number of alleles per locus (A), the mean observed heterozygosity (Ho), and the average fixation index (F). These mea-sures of genetic variability are not independent from each other, but all levels were presented here to facilitate comparisons with other studies. To check that the results of correlation could only be attributed to the difference in sample size, we selected the 12 populations with more than 50 seeds (Table 1) for in-depth analyses. From each of the 12 populations, we selected randomly 20 sets of 30 seeds using a numerical resampling method designed with the random numbers generator of FORTRAN. Then we obtained 20 sets of 12 populations, each population containing 30 seeds. With each of these new data sets (where all the populations had the same sample size) we reanalyzed the correlation.
RESULTS
Genetic diversity and population-level homozygosity—
From the 22 analyzed enzyme loci and the screening of the
29 populations, nine expressed polymorphisms (at 99%
crite-rion) and a total of 31 alleles were observed, most loci having
a common allele. The complete genotypic and allelic
frequen-cies are available from the authors upon request. Three private
alleles were observed: fEst-2
110in E88 with 0.836 frequency,
Gpi-1
96in E114 with 1 frequency, and Pgdh-1
86in KM12 with
0.750 frequency. From Table 1, the proportion of polymorphic
loci (P
p) varied from 0% (e.g., E35) to 23.81% (e.g., E76),
with a mean of 10.32%; the mean number of alleles per locus
(A) and the effective number of alleles per locus (Ae), varied
respectively from 1 (e.g., E35) to 1.24 (e.g., E76) with a mean
of 1.10 and from 1 (e.g., E35) to 1.15 (e.g., E88) with a mean
of 1.05. As shown in Table 1, the average H
owas 0.006,
rang-ing from 0 (e.g., A1) to 0.033 (E88) and the average H
ewas
0.030, ranging from 0 (e.g., E35) to 0.083 (E88). These results
indicated that in wild Lima bean populations, enzyme loci
ex-press a low allelic richness (A 5 1.10), the polymorphic loci
presenting uneven allele frequencies (A
e5
1.05).
In general, observed genotype frequencies were
significant-ly different from H-W expectations (Table 1). Indeed, of 59
inbreeding coefficients calculated, only 4 (6.8%) were not
sig-nificantly different from zero (a 5 0.05). Such results were
obtained from locus Adh-2 in populations E25 (F 5 0.32; P
5
0.051) and E83 (F 5 0.34; P 5 0.246) and Pgm-2 in
ulation J11 (F 5 0.44; P 5 0.107). Only locus cEst-2 in
pop-ulation J72 showed a negative but insignificant F index (F 5
2
0.11, P . 0.999). Accordingly, the average fixation index
(F) is significantly higher than zero for the analyzed
popula-tions, except for J11 and J72 (Table 1).
Genetic structure and gene flow—The estimates of
popu-lation genetic structure using Nei’s genetic diversity statistics
are shown in Table 2. The average of total heterozygosity (H
T)
and intrapopulation genetic diversity (H
S) were 0.193 and
0.082, respectively. The interpopulation genetic diversity (D
ST)
and the coefficient of genic differentiation among populations
(G
ST) varied from 0.002 (fEst-2) to 0.285 (Mdh-2) and from
0.159 (fEst-2) to 1 (Gpi-1), with a mean of 0.111 and 0.519,
respectively. The results indicated that in wild Lima bean,
about 52% of the total genetic diversity is among populations,
48% representing intrapopulation genetic diversity. The high
levels of genetic differentiation among populations (G
ST5
0.519; x
25
215.18, P , 0.001) and the interpopulation
ge-netic diversity (D
ST5
0.111) were probably indicative of low
gene flow, which was confirmed by the estimates of the
num-ber of migrants per generation based both on Wright’s equation
(Nm
W5
0.398) and Slatkin’s method (Nm
S5
0.023). Such
results corresponded to the occurrence of genetic divergence
in wild Lima bean populations, given that genetic drift results
in substantial local differentiation if Nm , 1 (Wright, 1931;
Slatkin, 1987).
F statistics for the 29 populations (Table 2) indicated that
the mean inbreeding index was significantly higher than zero
(F
IT5
0.932). Then the genotypic composition of the wild
Lima bean showed a deviation from the expected H-W
pro-portions. A high and significant value was also obtained for
F
IS(0.866), suggesting the occurrence of nonrandom mating
system for the studied populations. Although relatively low,
the estimate of F
STwas significant (F
ST5
0.497; x
25
206.06,
P , 0.001).
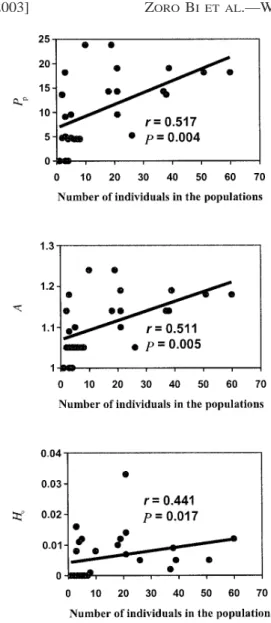
Genetic diversity and population size—The relationship
be-tween population size expressed by the plants number (m) and
the proportion of polymorphic loci (P
p), the mean number of
alleles per locus (A), and the mean observed heterozygosity
(H
o) as well as the correlation coefficients (r) describing this
relationship are shown in Fig. 2. Significantly positive
corre-lations were observed between the three genetic diversity
in-dices (P
p, A, and H
o) and the population size expressed as both
Fig. 2. Relationship between population size and measures of genetic var-iation (proportion of polymorphic loci; Pp, number of alleles per locus, A; and mean heterozygosity, Ho) examined using a Spearman rank non-parametric
correlation for 29 wild Phaseolus lunatus populations.
TABLE3. Genetic diversity indices of some wild and predominantly autogamous species.
Taxon
Genetic diversity indices
Pp A Ho HT HS GST References Arenaria uniflora Bromus tectorum Ceratophyllum demersum C. echinatum Eichhornia paniculata Phaseolus acutifolius P. lunatus P. vulgaris Setaria glauca S. viridis Sorghum bicolor Mean 17.90 4.60 20.00 7.00 7.60 — 10.32 — 13.50 25.00 — 13.24 1.09 1.05 1.22 1.07 — — 1.10 — 1.54 1.86 — 1.28 0.048 0.000 0.076 0.071 0.002 — 0.008 — — — — 0.034 0.371 0.115 0.211 0.529 0.060 0.372 0.193 0.132 0.099 0.108 0.262 0.220 0.103 0.046 0.085 0.255 0.027 — 0.082 0.006 0.016 0.023 0.075 0.071 0.572 0.478 0.495 0.481 0.570 — 0.519 0.952 0.729 0.647 0.714 0.605 Wyatt et al., 1992 Novak et al., 1991 Les, 1991 Les, 1991
Barrett and Shore, 1989 Schinkel and Gepts, 1989 The present study Koenig and Gepts, 1989 Wang et al., 1995b Wang et al., 1995a Ollitrault, 1987
Notes: Pp, the percentage of polymorphic loci; A, the mean number of alleles per locus; Ho, the observed heterozygosity; HT, the total genetic diversity; HS, the genetic diversity within populations; and GST, the among-populations gene differentiation coefficient. A dash indicates unpublished data.
numbers. Considering sample size as the collected seeds
num-ber, the following results were obtained: r 5 0.546 with P 5
0.004 for P
p, r 5 0.546 with P 5 0.004 for A, and r 5 0.449
with P 5 0.016 for H
o. A negative but insignificant correlation
was highlighted for the average fixation index: r 5 20.317
with P 5 0.131 when sample size was expressed as the
in-dividuals in the population and r 5 20.266 with P 5 0.208
when the collected seeds number was considered as sample
size. The observed tendency was confirmed by the results of
analyses obtained from the 20 sets of 12 populations with 30
seeds per population (data not shown here). Indeed, of the 20
tests performed, 19 showed significant correlation for P
p, 16
for A, and 15 for H
owhereas no significant correlation was
found for F.
DISCUSSION
Genetic diversity and population-level homozygosity—The
intrapopulation polymorphism indices estimated in this study
were smaller than those reported by Hamrick and Godt (1990)
for autogamous plants (P
p5
20.0%, A 5 1.31, A
e5
1.10,
and H
e5
0.074), short-lived perennial herbaceous plants (P
p5
28.0%, A 5 1.40, A
e5
1.12, and H
e5
0.096), and for
species with an animal-pollinated mixed-mating system (P
p5
29.2%, A 5 1.43, A
e5
1.12, and H
e5
0.090). It should be
noted that the reviews of Hamrick and Godt (1990) based on
eight life histories and ecological characteristics did not
ex-plain more than 30% of the genetic variation observed in plant
species (Godt and Hamrick, 1993). Table 3 presents a
com-pilation of statistics on the population genetic variability,
es-timated using isozymes for some wild and predominantly
au-togamous plant species. The mean of the data presented in this
table was close to the indices for intrapopulation genetic
var-iation of wild Lima bean: P
p5
13.24, A 5 1.28, and H
o5
0.034. The low allelic richness and frequent heterozygote
de-ficiency observed in the populations studied could be
attribut-ed to a number of different causes: founder effects, a high and
somewhat steady selfing rate (Zoro Bi, 1999), assortative
mat-ing (homogamy), selection favormat-ing homozygote individuals,
and Wahlund effects. As will be discussed more thoroughly
later, the founder effect has been highlighted in the studied
populations (Rocha et al., 1997). In the Central Valley of Costa
Rica, the outcrossing rate of wild Lima bean ranged from
0.027 to 0.268 with a mean of 0.096, indicating that this plant
has a high level of autogamy (Zoro Bi, 1999). Because this
author observed also that only 1% of the apparent selfing was
due to biparental inbreeding, the hypothesis of homogamy
(as-sortative mating) could be discarded. In a previous work, the
actual genetic structure of six wild Lima bean populations was
assessed using isozymes electrophoresis (Zoro Bi et al., 1997;
Zoro Bi, 1999). Seeds were sampled according to a grid of 4
3
4 m for bidimensional populations or 4 m apart for linear
populations, and the genotypes of mother plants at each node
were so determined. The genetic structure in the populations
was obvious: alternative alleles at each locus were clustered
in opposite parts of the populations, creating a patch structure
mainly composed of homozygote individuals. The Wahlund
effects could be another explanation of the observed frequent
heterozygote deficiency. However for this study, in each
pop-ulation, all pod-bearing plants were sampled during a complete
flowering period. This sampling procedure, combined with the
fact that the mean seed germination rate within a year was
78% and that 4% of the germinating seeds reach maturity in
the same year allowed us to discard the hypothesis concerning
Walhund effects. The four insignificant inbreeding coefficients
obtained in the studied populations probably had no biological
significance, but might have resulted from the method of
sam-pling.
Genetic structure and gene flow—The mean
intrapopula-tion gene diversity index (H
S5
0.082) estimated for the 29
populations was higher than the value reported from a previous
study by Maquet et al. (1996): H
S5
0.058. On the other hand,
the total heterozygosity (H
T5
0.193), the interpopulation gene
diversity index (D
ST5
0.111), and the among-populations
gene differentiation coefficient (G
ST5
0.519) were
signifi-cantly lower than those reported in that study (H
T5
0.292,
D
ST5
0.234, and G
ST5
0.803). Differences in the two
sta-tistics could be attributed to the difference between sampling
schemes adopted for these investigations. For the present
study, 1–60 plants were selected per population; 4–10 seeds
were randomly chosen per sampled plant so that 4–334 seeds
were analyzed according to the plant number per selected
pop-ulation. On the other hand, in Maquet et al. (1996), 14–50
seeds were randomly chosen per population, regardless of the
number of plants harvested in the target populations.
There-fore, the number of analyzed seeds might not have been
rep-resentative of the total number of plants in each population,
leading to an overestimation of H
T, D
ST, and G
ST.
The extent of genetic heterogeneity among populations as
measured by D
ST(50.111) was indicative of the occurrence
of several genetic phenomena such as high selfing rate, genetic
drift, and limited gene flow. Generally, in short-lived perennial
predominantly autogamous species such as wild Lima bean,
gene differentiation among populations expressed by G
STis
very high (Hamrick and Godt, 1990). Wild Lima bean is a
mixed-mating, predominantly autogamous species (Zoro Bi,
1999) that is expected to express high levels of population
genetic divergence and low levels of within-population genetic
diversity. The estimates of the populations genetic structures
indices analyzed in this study were also in accordance with
the designated trend: F
IT5
0.932, F
ST5
0.497, and F
IS5
0.866. This mating trait, coupled with founder effects
associ-ated with recruitment events in the populations studied (Rocha
et al., 1997), could explain the high level of genetic divergence
and lower level of genetic diversity in wild P. lunatus
popu-lations. The authors established after a 7-yr survey of these
populations in the target area that the number of wild Lima
bean populations containing more than five pod-bearing plants
did not exceed 16%, predicting a probable occurrence of
ge-netic drift.
The estimates of Nm based either on Wright’s (1951)
equa-tion or the Slatkin approach were very low: Nm
W5
0.398 and
Nm
S5
0.023. In addition, we noted that Nm
Wwas
approxi-mately 19 times higher than Nm
S. Such difference could be
attributed to the low number of observed private alleles (3 out
of 31 alleles) and their high frequencies (Pgdh-1
86in KM12
with 0.750 frequency and Gpi-1
96in E114 with 1 frequency).
These result were in accordance with those obtained from
in-vestigations on wild Lima bean intrapopulation gene flow
evaluated using pollen dispersal (Hardy et al., 1997), seed
dis-persal, and vegetative growth (Baudoin et al., 1998). Indeed,
we estimated flower and pollen dispersal (through vegetative
growth) as well as seed dispersal within some populations by
considering the foraging behavior of pollinators and using a
technique for labeling and tracking pollen grain and seeds in
vivo. From this study, we concluded that the horizontal
trans-fer distance for pollen and seeds did not exceed 6 m (Baudoin
et al., 1998). The neighborhood parameter area and the
neigh-borhood size equaled 8.4 and 1.6, respectively. Because this
last value was smaller than 20, random local genetic
differ-entiation is expected (Wright, 1931).
Genetic diversity and population size—Except for F, we
found a significant correlation between the size of the
inves-tigated populations and their levels of genetic variation. Thus,
our data were consistent with the idea that genetic variation
within populations is related to population size. Such results
have been observed previously in other plant species, in
par-ticular in rare or threatened species (Moran and Hopper, 1983;
Karron, 1987; van Treuren et al., 1991; Godt et al., 1996;
Routley et al., 1999). Various explanations have been
formu-lated for the correlation between population size and
intrapop-ulation genetic variability indices. In our case, the most likely
phenomena to explain the correlation is the inbreeding
high-lighted in this study and in former studies (Zoro Bi et al.,
1997; Zoro Bi, 1999). Inbreeding reveals itself through a
high-er numbhigh-er of homogygotes than would be expected undhigh-er
pan-mictic mating. In wild Lima bean from the Central Valley of
Costa Rica, an excess of homozygotes was observed and gene
dispersal within populations was not sufficient to maintain
ran-dom union of gametes (Hardy et al., 1997; Baudoin et al.,
1998). In smaller populations, we mainly observed fewer
al-leles and simultaneously found lower levels of heterozygosity
(computed as H
o). The lower heterozygosity was mainly due
to fixed alleles (Table 1). A correlation between heterozygosity
and effective population size is also expected for loci under
weak heterozygote advantage in selection when populations
are small in size. Heterozygote advantage in finite populations
will slow fixation for alleles with intermediate frequencies and
accelerate it for rare and very common alleles in small
pop-ulations. Selection on individual alleles detected by
electro-phoresis is generally weak, so they are likely to be subject to
genetic drift unless population sizes are very large
(Montgom-ery et al., 2000; Hedrick, 2001). Random genetic drift in small
bottlenecked populations and founder effects resulting from
extinction/recolonization episodes that characterized the
stud-ied populations also could have lowered the genetic variability
in small populations. Indeed, in the target area, many wild
Lima beans are found in coffee plantations, fallow lands, or
along hedges, so that weeding practices contribute to the
de-struction of plants. Recolonization of the cleared sites could
be due to any nearby plants, to new individuals emerging from
the soil seed bank, or to human activities (such as seed
trans-portation over longer distances on shoes or tools). The absence
of correlation between populations size and the average
fixa-tion index was evident since in the majority of the analyzed
populations, F values were high and significantly different
from zero, regardless of their sizes.
Conservation and management
implications—Conserva-tion of plant genetic resources aims to maintain as much
ge-netic diversity as possible. In situ conservation planning
re-quires choice of populations, delimitation of sites, and
contin-uous management and monitoring of designated populations
(Iwanaga, 1996; Oue´draogo, 1996). Both require
ecogeograph-ic and genetecogeograph-ic knowledge of the target taxon.
For wild P. lunatus populations, data from isozyme
electro-phoresis indicated genetic variability mainly at the
interpop-ulation level, with low values for allelic richness, expected
heterozygosity and interpopulation gene flow. Based on these
results, we recommend protecting populations from as many
distinctive ecological sites as possible, regardless of their size,
because some private alleles were observed in small
popula-tions.
Once populations have been selected for in situ
conserva-tion, sound management is necessary to preserve a high level
of genetic variability. For wild Lima bean populations, an
ap-propriate management method was indicated by demographic
studies (Degreef, 1998). An analysis of the sensitivity of life
cycle matrices obtained from six populations pointed out the
importance of seed production, early germination, and rapid
plant lignification to maintain in situ populations in the Central
Valley. Because genetic drift appears to be important in the
populations studied, the resulting genetic uniformity might
di-rectly threaten some alleles. The reintroduction of the
threat-ened genotypes (genotypes having rare alleles) at regular time
intervals would allow the maintenance of a substantial level
of genetic variability in some endangered populations.
LITERATURE CITED
ALTIERI, M. A., ANDL. C. MERRICK. 1987. In situ conservation of crop genetic resources through maintenance of traditional farming systems.
Economic Botany 41: 86–96.
BARRETT, S. C. H.,ANDJ. R. KOHN. 1991. Genetic and evolutionary con-sequences of small population size in plants: implications for conserva-tion. In D. A. Falk and K. E. Holsinger [eds.], Genetics and conservation of rare plants, 3–30. Oxford University Press, Oxford, UK.
BARRETT, S. C. H.,ANDJ. S. SHORE. 1989. Isozyme variation in colonizing plants. In D. E. Soltis and P. S. Soltis [eds.], Isozymes in plant biology, 106–126. Dioscorides Press, Oregon, Portland, USA.
BARTON, N. H.,ANDM. SLATKIN. 1986. A quasi-equilibrium theory of the distribution of rare alleles in a subdivided population. Heredity 56: 409– 415.
BAUDOIN, J. P., J. DEGREEF, O. HARDY, F. JANART,ANDI. ZOROBI. 1998. Development of an in situ conservation strategy for wild Lima bean (Phaseolus lunatus L.) populations in the central valley of Costa Rica.
In S. J. Owens and P. J. Rudall [eds.], Reproduction biology, 417–426.
Royal Botanic Gardens, Kew, England.
BROWN, A. H. D. 1978. Isozymes, plant population genetic structure and genetic conservation. Theoretical and Applied Genetics 52: 145–157. BROWN, A. H. D., C. L. BRUBAKER,ANDJ. P. GRACE. 1997. Regeneration
of germplasm samples: wild versus cultivated plant species. Crop Science 37: 7–13.
CROW, J. F.,ANDK. AOKI. 1984. Group selection for a polygenic behavioral
trait: estimating the degree of population subdivision. Proceedings of the
National Academy of Sciences, USA 81: 6073–6077.
DEBOUCK, D. G., O. TORO, O. M. PEREDES, W. C. JOHNSON,ANDP. GEPTS. 1993. Genetic diversity and ecological distribution of Phaseolus vulgaris (Fabaceae) in northwestern South America. Economic Botany 47: 408– 423.
DEGREEF, J. 1998. De´veloppement d’un mode`le de´mographique et applica-tions a` la conservation in situ de populaapplica-tions sauvages de haricot de Lima (Phaseolus lunatus L.) dans la valle´e centrale du Costa Rica. Ph.D. the-sis, Faculte´ Universitaire des Sciences Agronomiques, Gembloux, Bel-gium.
DEGREEF, J., O. J. ROCHA, T. VANDERBORGHT,ANDJ. P. BAUDOIN. 2002. Soil seed bank and seed dormancy in wild populations of Lima bean (Fabaceae): consideration for in situ and ex situ conservation. American
Journal of Botany 89: 1644–1650.
DOLAN, R. W. 1994. Patterns of isozyme variation in relation to population size, isolation, and phytogeographic history in royal catchfly (Silene
re-gia; Caryophyllaceae). American Journal of Botany 81: 965–972.
FRANKEL, O. H. 1974. Genetic conservation: our evolutionary responsibility.
Genetics 78: 53–65.
GODT, M. J. W.,ANDJ. L. HAMRICK. 1993. Genetic diversity and population structure in Tradescantia hirsuticaulis (Commelinaceae). American
Jour-nal of Botany 80: 959–966.
GODT, M. J. W., B. R. JOHNSON,ANDJ. L. HAMRICK. 1996. Genetic diversity and population size in four rare Southern Appalachian plant species.
Conservation Biology 10: 796–805.
HAMRICK, J. L.,ANDJ. W. GODT. 1990. Allozyme diversity in plant species.
In A. H. D. Brown, M. T. Clegg, A. L. Kalher, and B. S. Weir [eds.],
Plant population genetics, breeding, and genetic resources, 43–63. Sin-auer Associates, Sunderland, Massachusetts, USA.
HAMRICK, J. L., Y. B. LINHART, AND J. B. MITTON. 1979. Relationships between life history characteristics and electrophoretically-detectable ge-netic variation in plants. Annual Reviews of Ecology and Systematics 10: 173–200.
HARDY, O., S. DUBOIS, I. ZOROBI,ANDJ. P. BAUDOIN. 1997. Gene dispersal and its consequences on the genetic structure of wild populations of Lima bean (Phaseolus lunatus) in Costa Rica. Plant Genetic Resources
News-letter 109: 1–6.
HAWKES, J. G. 1971. Conservation of plant genetic resources. Outlook on
Agriculture 6: 248–253.
HEDRICK, P. W. 2001. Conservation genetics: where are we now? Trends in
Ecology and Evolution 16: 629–636.
IWANAGA, M. 1996. IPGRI strategy for in situ conservation of agricultural biodiversity. In J. M. M. Engels [ed.], In situ conservation and sustain-able use of plant genetic resources for food and agriculture in developing countries. Report of a DSE/ATSAF/IPGRI workshop, 2–4 May 1995, Bonn-Ro¨ttgen, Germany, 13–26. International Plant Genetic Resources Institute, Rome, Italy.
KARRON, J. D. 1987. A comparison of levels of genetic polymorphism and self-compatibility in geographically restricted and widespread plant con-geners. Evolutionary Ecology 1: 47–58.
KAZAN, K., F. J. MUEHLBAUER, N. F. WEEDEN,ANDG. LADIZINSKY. 1993. Inheritance and linkage relationships of morphological and isozyme loci in chickpea (Cicer arietinum L.). Theoretical and Applied Genetics 86: 417–426.
KOENIG, R.,ANDP. GEPTS. 1989. Allozyme diversity in wild Phaseolus
vul-garis: further evidence for two major centers of genetic diversity. The-oretical and Applied Genetics 78: 809–817.
LANDE, R. 1988. Genetics and demography in biological conservation.
Sci-ence 241: 1455–1460.
LES, D. H. 1991. Genetic diversity in the monoecious hydrophile
Cerato-phyllum (Ceratophyllaceae). American Journal of Botany 78: 1070–1082.
LI, C. C.,ANDD. G. HORVITZ. 1953. Some methods of estimating the in-breeding coefficient. American Journal of Human Genetics 5: 107–117. LOVELESS, M. D.,AND J. L. HAMRICK. 1984. Ecological determinants of genetic structure in plant populations. Annual Reviews of Ecology and
Systematics 15: 65–95.
MAQUET, A.,ANDJ.-P. BAUDOIN. 1997. Aperc¸u de la distribution ne´otropicale de Phaseolus lunatus. Belgian Journal of Botany 130: 93–116. MAQUET, A., I. ZOROBI, M. DELVAUX, B. WATHELET,ANDJ.-P. BAUDOIN.
1997. Genetic structure of a Lima bean base collection using allozyme markers. Theoretical and Applied Genetics 95: 980–991.
studies on breeding systems and its consequences for germplasm con-servation. 1. Isoenzyme diversity in wild Lima bean populations in Cen-tral Costa Rica. Genetic Resource and Crop Evolution 43: 309–318. MARSHALL, D. R. 1990. Crop genetic resources: current and emerging issues.
In A. H. D. Brown, M. T. Clegg, A. L. Kalher, and B. S. Weir [eds.],
Plant population genetics, breeding, and genetic resources, 367–388. Sin-auer Associates, Sunderland, Massachusetts, USA.
MONTGOMERY, M. E., L. M. WOODWORTH, R. K. NURTHEN, D. M. GILLIGAN, D. A. BRISCOE,ANDR. FRANKHAM. 2000. Relationships between pop-ulation size and loss of genetic diversity: comparisons of experimental results with theoretical predictions. Conservation Genetics 1: 33–43. MORAN, G. F.,ANDS. D. HOPPER. 1983. Genetic diversity and the insular
population structure of the rare granite rock species, Eucalyptus caesia Benth. Australian Journal of Botany 31: 161–172.
MURPHY, R. W., J. W. SITES, JR., D. G. BUTH,ANDC. H. HAUFLER. 1990. Proteins I: isozyme electrophoresis. In D. M. Hillis and C. Moritz [eds.], Molecular systematics, 45–126. Sinauer Associates, Sunderland, Mas-sachusetts, USA.
NEI, M. 1973. Analysis of gene diversity in subdivided populations.
Pro-ceedings of the National Academy of Sciences, USA 70: 3321–3323.
NEI, M. 1987. Molecular evolutionary genetics. Columbia University Press, New York, New York, USA.
NOVAK, S. J., R. N. MACK,ANDD. E. SOLTIS. 1991. Genetic variation in
Bromus tectorum (Poaceae): population differentiation in its North
Amer-ican ranges. AmerAmer-ican Journal of Botany 78: 1150–1161.
OLLITRAULT, P. 1987. Evaluation ge´ne´tique des sorghos cultive´s (Sorghum
bicolor L. Moench) par l’analyse conjointe des diversite´s enzymatique
et morphophysiologique—relations avec les sorghos sauvages. Ph.D. the-sis, Universite´ de Paris-Sud, Centre d’Orsey, Paris, France.
OOSTERMEIJER, J. G. B., M. W.VANEIJCK,ANDJ. C. M. DENNIJS. 1994. Offspring fitness in relation to population size and genetic variation in the rare perennial plant species Gentiana pneumonanthe (Gentianaceae).
Oecologia 97: 289–296.
OUE´ DRAOGO, A.-S. 1996. The role of protected areas in maintaining biodi-versity. In J. M. M. Engels [ed.], In situ conservation and sustainable use of plant genetic resources for food and agriculture in developing countries. Report of a DSE/ATSAT/IPGRI workshop, 2–4 May 1995, Bonn-Ro¨ttgen, Germany, 94–96. International Plant Genetic Resources Institute, Rome, Italy.
RAIJMANN, L. E. L., N. C.VANLEEUWEN, R. KERSTEN, J. G. B. OOSTER -MEIJER, J. C. M.DENNIJS,ANDS. B. J. MENKEN. 1994. Genetic vari-ation and outcrossing rate in relvari-ation to populvari-ation size in Gentiana
pneu-monanthe L. Conservation Biology 8: 1014–1026.
ROCHA, O. J., G. MACAYA,ANDJ. P. BAUDOIN. 1997. Causes of local ex-tinction and recolonization, determined by 3 years of monitoring wild populations of Phaseolus lunatus L. in the central valley of Costa Rica.
Plant Genetic Resources Newsletter 112: 44–48.
ROUTLEY, M. B., K. MAVRAGANIS,ANDC. G. ECKERT. 1999. Effect of pop-ulation size on the mating system in a self-compatible, autogamous plant,
Aquilegia canadensis (Ranunculaceae). Heredity 82: 518–528.
SAS INSTITUTE. 1990. The SAS/STAT software release 8.2 user guide. SAS Institute, Cary, North Carolina, USA.
SCHINKEL, C.,ANDP. GEPTS. 1989. Allozyme variability in the tepary bean,
Phaseolus acutifolius A. Gray. Plant Breeding 102: 182–195.
SLATKIN, M. 1985. Rare alleles as indicators of gene flow. Evolution 39: 53– 65.
SLATKIN, M. 1987. Gene flow and the geographic structure of natural pop-ulations. Science 236: 787–792.
VANTREUREN, R., R. BIJLSMA, N. J. OUBORG,ANDW.VANDELDEN. 1993. The effects of population size and plant density on outcrossing rates in locally endangered Salvia pratensis. Evolution 47: 1094–1104. VANTREUREN, R., R. BIJLSMA, W. VANDELDEN,ANDN. J. OUBORG. 1991.
The significance of genetic erosion in the process of extinction. I. Genetic differentiation in Salvia pratensis and Scabiosa columbaria in relation to population size. Heredity 66: 181–189.
VEKEMANS, X.,ANDC. LEFE` BVRE. 1997. On the evolution of heavy-metal tolerant populations in Armeria maritima: evidence from allozyme var-iation and reproductive barriers. Journal of Evolutionary Biology 10: 175–191.
WANG, R.-L., J. F. WENDEL,ANDJ. H. DEKKER. 1995a. Weedy adaptation in Setaria ssp. I. Isozyme analysis of genetic diversity and population genetic structure in Setaria viridis. American Journal of Botany 82: 308– 317.
WANG, R.-L., J. F. WENDEL,ANDJ. H. DEKKER. 1995b. Weedy adaptation in Setaria ssp. II. Genetic diversity and population genetic structure in
S. glauca, S. geniculata, and S. faberii (Poaceae). American Journal of Botany 82: 1031–1039.
WEIDEMA, I. R., H. R. SIEGISMUND,ANDM. PHILIPP. 1996. Distribution of genetic variation within and among Danish populations of Armeria
mar-itima, with special reference to the effects of population size. Hereditas
124: 121–129.
WEIR, B. S.,ANDC. C. COCKERHAM. 1984. Estimating F-statistics for the analysis of population structure. Evolution 38: 1358–1370.
WIDE´ N, B. 1993. Demographic and genetic effects on reproduction as related to population size in a rare, perennial herb, Senecio integrifolius (Aster-aceae). Biological Journal of the Linnean Society 50: 179–195. WORKMAN, P. L.,ANDJ. D. NISWANDER. 1970. Population studies on
South-western Indian tribes. II. Local genetic differentiation in the Papago.
American Journal of Human Genetics 22: 24–49.
WRIGHT, S. 1931. Evolution in mendelian population. Genetics 16: 97–159. WRIGHT, S. 1951. The genetical structure of populations. Annals of
Euge-netics 15: 323–354.
WYATT, R., E. A. EVANS,ANDJ. C. SORENSON. 1992. The evolution of self-pollination in granite outcrop species of Arenaria (Caryophyllaceae). VI. Electrophoretically detectable genetic variation. Systematic Botany 17: 201–209.
ZOROBI, I. 1999. Variabilite´ ge´ne´tique des populations sauvages de
Phas-eolus lunatus L. dans la valle´e centrale du Costa Rica et ses implications
dans la mise au point d’une strate´gie de conservation in situ. Ph.D. thesis, Faculte´ Universitaire des Sciences Agronomiques, Gembloux, Belgium. ZOROBI, I., A. MAQUET,ANDJ. P. BAUDOIN. 1999. Genetic control of iso-zymes in the gene pool Phaseolus lunatus L. Biotechnology, Agronomy,
Society and Environment 13: 10–27.
ZOROBI, I., A. MAQUET,ANDJ. P. BAUDOIN. 1997. Spatial patterns of al-lozyme variants within three wild populations of Phaseolus lunatus L. from the central valley of Costa Rica. Belgian Journal of Botany 129: 149–155.
ZOROBI, I., A. MAQUET, J. DEGREEF, B. WATHELET,ANDJ. P. BAUDOIN. 1998. Sample size for collecting seeds in germplasm conservation: case of the Lima bean (Phaseolus lunatus L.). Theoretical and Applied