Bulk Power System Dynamics and Control - VII, August 19-24, 2007, Charleston, South Carolina, USA
E-SIME- A Method for Transient Stability Closed-Loop Emergency Control:
Achievements and Prospects
Mevludin Glavic
University of Liege Dept. of Electrical Eng. and Computer
Science, Liege, BELGIUM
Damien Ernst
Supelec, Rennes, FRANCEDaniel Ruiz-Vega
Instituto Politechnico Nacional (IPN), Mexico City, MEXICOLouis Wehenkel
University of Liege Dept. of Electrical Eng. and ComputerScience, Liege, BELGIUM
Mania Pavella
University of Liege Dept. of Electrical Eng. and Computer
Science, Liege, BELGIUM
Abstract
A general response-based technique is presented for closed-loop transient stability emergency control. It relies on E-SIME, derived from the hybrid transient stability method, SIME. E-SIME uses real-time information supposed to be furnished by phasor measurement units to predict the stability status of the power system, and, in view of an imminent instability, to design and trigger appropriate countermeasures, while continuing monitoring in order to check their effectiveness or to apply additional ones. Performance of the method in terms of accuracy and rapidity is scrutinized and illustrated on several real-world power system examples. New technical solutions and algorithms for the accurate estimation and prediction of power system quantities most relevant to the method are discussed. The observations from a recent investigation and conclusions that could prove useful for improving further the method are summarized together with some realistic timing considerations. A natural coupling of the two SIME based emergency control techniques: open-loop emergency control and E-SIME, so as to combine their complementary features is also discussed.
Introduction
Power system preventive control in general, aims at modifying the system pre-fault operating conditions of a system, so as to make it able to withstand otherwise harmful events [1]. However, the preventive countermeasures advocated could be too expensive or inappropriate, since these harmful events may never occur or occur under generally different operating conditions from those they have been designed for. Hence, the desirable complement to all types of preventive control is emergency control, where the countermeasures are
triggered after a harmful event has actually occurred and possibly cleared by appropriate protective devices.
Emergency control can broadly be classified into two
categories: open loop and closed-loop [2, 3]. Open-loop emergency control aims at controlling the power system using actions that are assessed off-line on the basis of simulations of postulated scenarios and that are not re-adjusted by following up the system [4]. On the other hand, closed-loop emergency control is a desirable complement of open-loop emergency control that aims at assessing whether the event is going to jeopardize the system, at designing and triggering appropriate control actions and, further, at following-up the system evolution so as to make proper re-adjustments, if necessary. The whole cycle relies on real-time measurements.
Emergency controls can be event-based or response-based. Event-based controls are designed to operate upon the recognition of a particular combination of events, while response-based controls rely on measured electric variables and operate when certain threshold criteria are met [2]. Transient stability emergency control is an extremely important and challenging issue: important, because transient instabilities, though rare, generally have disastrous consequences; challenging, because transient instabilities develop very fast: predicting – assessing instability, deciding about control actions and triggering them should therefore be achieved in extremely short time frames (less than 500 ms). Besides, the very design of these various functions is a hard task. One is therefore often led to resort to event-based open-loop transient stability emergency control.
A response-based closed-loop emergency control
method, named E-SIME (for Emergency SIME), was proposed some years ago [5]. Like SIME from which it generates, E-SIME replaces the dynamics of the multi-machine power system by that of a suitable one-multi-machine infinite bus system along with the equal-area criterion. This way of proceeding speeds up enormously the
involved computations and, at least as importantly, it suggests systematic means of control. In addition, E-SIME makes it possible to predict and control transient instabilities within time frames compatible with real-time requirements. These achievements are obtained thanks to the use of real-time measurements taken on the system power plants, rather than time-domain simulations.
E-SIME has matured since its original design, through
simulations on a variety of power systems that are typically equipped with protection schemes on dedicated locations. Recently, the method bas been investigated within a European Union project [10]. This has been a serious incentive to scrutinize theoretical and technical aspects of the method, attempting to make it comply with available hardware performance and to free it from possible constraints. This paper revisits the original method and then focuses on various specifics and features, putting the accent on recent advances and prospects.
Fundamentals of E-SIME
Scope
Following a disturbance inception and its clearance, E-SIME aims at predicting the system transient stability behavior and, if necessary, at deciding and triggering control actions early enough to prevent loss of synchronism. Further, it aims at continuing monitoring the system, in order to assess whether the applied control action has been sufficient or should be reinforced.
To reach the above scope, E-SIME uses real-time measurements informing about the power system status, along with appropriate prediction and control techniques sketched in the following paragraphs.
Basic mechanism [5], [9]
The general SIME methodology relies on the continuous interplay between the post-fault dynamics of the multi-machine power system and of a suitable One-Machine Infinite Bus (OMIB) equivalent, whose transient stability is assessed by the equal-area criterion (EAC).
Within E-SIME, the information about the multi-machine power system dynamics is provided by real-time measurements, acquired at regular time steps, ’s, and refreshed at the rate .
i
t i
t
∆
Thus, as soon as the system enters its post-fault configuration, the multi-machine system information is transformed into a suitable OMIB equivalent, defined by its angle δ , speed ω , mechanical power , electrical power and inertia coefficient M. (All OMIB parameters are derived from multi-machine system parameters.) Further, the OMIB dynamics is explored by
EAC, until reaching the EAC instability conditions calculated by the closed-form expressions,
m P e P
( )
u =0 a t P ; P&a( )
tu >0. (1) Here, is the OMIB accelerating power, difference between mechanical and electrical power,a P e m a P P P = − (2) and is the time to instability: this is the time when the OMIB system loses synchronism and the system machines split irrevocably into two groups: the group of “advanced machines” that we will henceforth refer to as the “critical machines” (CMs), and the remaining ones, called the “non-critical machines”, (NMs)
u
t
1. Thus, at t the stability margin are determined by,
u 2 2 1 u acc dec u A A Mω η = − =− (3) and the CMs, responsible of the system loss of synchronism are those having provided the OMIB that met conditions (1).
Predictive transient stability assessment
The prediction relies on the following steps:
(i) Predicting the OMIB structure: use a Taylor series expansion to predict the individual machines’ rotor angles; rank the machines according to their angles, identify the largest angular distance between two successive angular deviations and declare the machines corresponding to this distance to be the “candidate critical machines”, the remaining ones being the “candidate non-critical machines”. The suitable aggregation of these machines provides the “candidate OMIB”.
(ii) Predicting the Pa−δ curve: compute the parameters
of this “candidate OMIB”, and in particular its accelerating power and rotor angle, Pa and δ , for (at
least) three successive data sets acquired at ti −2∆ti,
i
i t
t −∆ , . Write the equation, ti
(4)
c b a
Pa(δ)= δ2+ δ+
for the three different times and solve for a, b, c2.
1 The “advanced machines” are the CMs for up-swing instability phenomena, while for back-swing phenomena they become NMs.
2 Subsequently, using newly acquired sets of measurements and processing a (weighted) least squares technique, which shows to be particularly robust, refine the estimated curve.
(iii) Predicting instability: search for the solution of, 0 c b a Pa(δu)= δu2+ δu+ = (5) to determine whether the OMIB reaches the unstable conditions (1). If not, repeat steps (i) to (iii) using new measurements set.
If yes, the candidate OMIB is the critical one, for which the method computes successively
– the unstable angle δ , u
– the unstable margin (3) re-written as,
∫
− − = u i 2 i ad 21M P δ δ ω δ η (6) – the time to instability,∫
∫
− + + = u i i 2 i a i u d P M 2 d t t δ δ δ δ ω δ δ ) / ( (7)where δ stands for i δ(ti) and ω for i ω(ti).
(iv) Validity test. The validity test relies on the observation that under given operating and contingency conditions, the value of the (negative) margin should be constant, whatever the time step. Hence, the above computations should be repeated at successive ∆ti’s until
getting a (almost) constant margin value.
Discussion:
• The prediction is possible thanks to the use of the OMIB
transformation; indeed, predicting the behavior (accelerating power) of all of the system machines would have led to totally unreliable results.
• There may be a tradeoff between the above mentioned validation test and time to instability: the shorter this time, the earlier the corrective action should be taken, possibly before complete convergence of the validation test.
Emergency control
Principle: Once instability has been detected and its size
has been calculated, the task of control consists of: • Assessing “where” and “how much corrective
action” to take (pre-assigned type of corrective
action), and of
• Continuing to assess whether the executed corrective action has been sufficient or whether to proceed further.
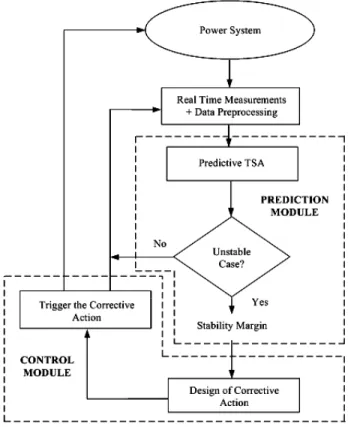
The control module of Fig. 1 takes care of the design of control actions. For example, when generation shedding
is of concern, the action consists of determining the number of generators to shed.
Further, the method sends the order of triggering the action, while continuing to monitor and control the system in closed-loop fashion, until getting power system stabilization. Note that the prediction of the time to instability may influence the control decision (size of control; time to trigger).
Fig. 1 General organization of the E-SIME
Generation shedding: It could happen that the system
problem cannot be solved by generation tripping at one power plant only and coordinated control should be examined. The E-SIME provides the amount of generation to be tripped. There are two possible approaches. The first is to trip at once all the estimated generation to be tripped, as soon as the first unstable margin appears, by tripping the most advanced machines that comprise the estimated generation to be tripped (this is the case when estimated time to instability is tight with respect to the delays in control action application). The second approach trips the machines one by one, starting with the most advanced machine; then it monitors the system state, to trip again the second most advanced machine if the computed stability margin is still negative and time to instability is large enough. The approach continues until the margin becomes positive; but if after tripping the first machine the time to instability is found
to be tight with respect to the delays, it trips all the remaining generation (estimated to be tripped) at once.
Recapitulating tasks’ definition, duration, relating notation
Involved tasks: The foregoing shows that an emergency
control (EC) cycle comprises the following tasks:
• Data acquisition at power plants and their transmission to the control room,
• Data processing at the control room,
• Order transmission from the control room to the power, plant(s) to be controlled,
• Order activation.
Corresponding durations: Because of short time frame
(system emergency states) delays in data collecting, processing and delays in determined control actions application can considerably influence whole system. The delays due to data acquisition and processing in the PMU are [12, 13],
Tacq =Tc +Tp ≤Trate
where is the sampling period of instantaneous quantities measured at the PMU site, is the adjourning period of processing by PMU, T is the sampling rate (e.g., every cycle of fundamental frequency).
c T
p T rate
The whole cycle (data acquisition and processing, prediction, assessment, decision on control action, control action application) can be expressed as,
T =Trate+Ts +Te+Tsime+Ts +Tsw ≤Tu
whereT is the delay in communication system (it is assumed that the delay in receiving measurements are approximately the same as the delay in sending control signal to the system; actually, the delays are slightly different), is the identification of the fault clearing, is the time required by E-SIME to properly predict instability and to decide on appropriate control action (this time is negligible with respect to other delays), T
is the delay in switchgear operation (T – delay in application of the control action), and T is the time to instability. Assuming that the rate of data acquisition and processing is 20 (every cycle of the fundamental frequency) and that the communication delays are (this is the measured communication delay at Bonneville Power Administration for modem communications [2]; for fiber optic it is
), yields T for the emergency control to be effective. s ms 70 e T T , sime T Ts = ms 20 sw sw s +T u ms sw=70 u ≥ ms ms 350
Information required by E-SIME
Type and number of real-time measurements. The
required measured quantities are dynamic machines’ data: rotor angles, speeds and accelerations; in addition, electrical machines’ powers are also necessary for the purpose of control. Besides, the machines’ inertias and their changes during the process are also supposed to be known. [Recall that the real-time measurements are supposed to be collected at the power plants and sent to a location (control room), possibly close to the dedicated site under control.]
Rate of data acquisition. E-SIME is supposed to receive
the above machines’ dynamic data at regular time intervals.
Contingency information. E-SIME is activated as soon as
an anomaly is detected (contingency inception), generally followed by its clearance via protective relays. Note that the beginning of the post-fault phase is supposed to be known, while knowledge of the contingency type and location is not used.
Remarks:
• The hardware requirements of the emergency control scheme are PMU devices placed at the main power plant stations and communication systems to transmit this information. These requirements seem to be within reach of today’s technology [12-14].
• The emergency control relies on purely real-time measurements. This frees the control from uncertainties about power system modeling, parameter values, operating conditions, type and location of the contingency.
Achievements
The generation shedding scheme described in previous sections has been tested (in ideal conditions: full observability, noise and delays not considered) on several real-life power system models: South-Southeast Brazilian System [10], EPRI test system C [9], WECC system [6], and Hydro-Quebec system [5]. For want of real-world measurements, the E-SIME is illustrated on the basis of time-domain simulations using ST-600 program [15] and ETMSP program [16]. In this section we summarize main results obtained using South-Southeast Brazilian system, EPRI test system C, and WECC system.
Power systems description and simulation conditions
South-Southeast Brazilian system comprises 63 machines, 1.180 buses and 1.962 lines. It is modeled in its usual detailed way. The generation shedding scheme is applied to the Itaipu transmission system (8 machines of 700 MW, at the 60 Hz side of Itaipu). Real-time measurements are artificially created using ST-600
program. The measurements are collected at the rate of 20 ms. The considered contingency consists of a three-phase short-circuit applied at Itaipu and Foz do Iguacu. The corrective control action consists of disconnecting machines ( should not exceed 5 so as to ensure a minimum of 3 machines in service) at the 60 Hz power plant of Itaipu. The control order is triggered 150 ms after the fault initiation, i.e. 70 ms after the fault clearance (20 ms for the order to reach Itaipu and 50 ms for the control action).
n n
EPRI test system C includes 434 buses, 2357 lines and 88 machines (of which 14 are modeled in detail) [17]. The considered base-case has a total generation of 350,749 MW. The contingency considered is a three-phase short-circuit at bus #15 (500 kV) cleared 100 ms after its inception by opening the line 1-15. In order to create artificially real-time measurements the ETMSP program is used. The measurements are supposed to be acquired at the rate of 20 ms. WECC system is originally modeled with 29 machines, 179 buses and a total load of about 60,000 MW. However, most of the machines are in fact large equivalents and in our simulations one of them has been split in two units in order to be able to use finer assessment of generation shedding than that consisting of shedding a big unit. The contingency considered is a three-phase short-circuit at bus MOHAVE 500 (duration of 150 ms) cleared by opening the line LUGO 500 – MOHAVE 500. The overall delay for the generation shedding is considered equal to 150 ms (50 ms to centralize all the measurements, 50 ms to send corrective action order, and 50 ms to effectively shed the generator(s)). For want of real-time measurements the ETMSP transient stability program is used. The measurements are assumed to be collected every 10 ms.
Simulation results
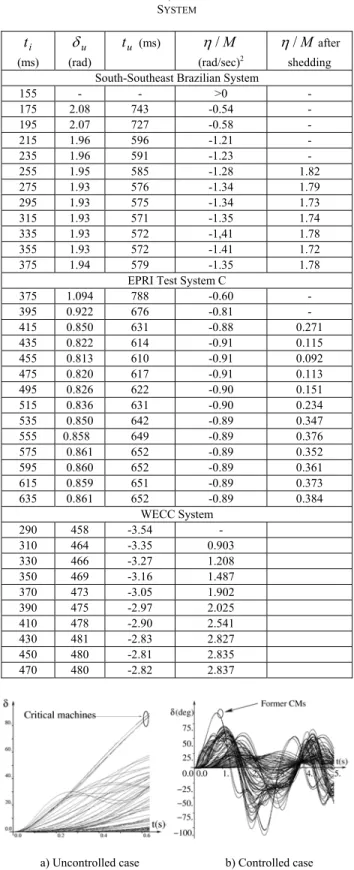
Table I summarizes the results of predictive assessment and closed-loop emergency control for the three test systems. Fig. 2 illustrates the system response for uncontrolled and controlled case for EPRI test system C. The contingency considered represents a 3-φ short-circuit applied at bus #15 (500kV), and cleared 100 ms after their inception by opening one line.
The contingency is stabilized by shedding CMs. The size of this control action, assessed according to Section 2, is found to be 3 units among the 7 most advanced ones, corresponding to 2,463 MW. The machines shed are #1855 (835 MW), #1771 (793 MW), and #1877 (835 MW). Because of the proximity of predicted instability, it is decided to take control action quite early (at
).
ms ti =415
TABLE I
TRANSIENT STABILITY ASSESSMENT AND CONTROL FOR SOUTH -SOUTHEAST BRAZILIAN SYSTEM, EPRI TEST SYSTEM C AND WECC
SYSTEM i t (ms) u δ (rad) u t (ms) η/M (rad/sec)2 M / η after shedding South-Southeast Brazilian System
155 - - >0 - 175 2.08 743 -0.54 - 195 2.07 727 -0.58 - 215 1.96 596 -1.21 - 235 1.96 591 -1.23 - 255 1.95 585 -1.28 1.82 275 1.93 576 -1.34 1.79 295 1.93 575 -1.34 1.73 315 1.93 571 -1.35 1.74 335 1.93 572 -1,41 1.78 355 1.93 572 -1.41 1.72 375 1.94 579 -1.35 1.78
EPRI Test System C
375 1.094 788 -0.60 - 395 0.922 676 -0.81 - 415 0.850 631 -0.88 0.271 435 0.822 614 -0.91 0.115 455 0.813 610 -0.91 0.092 475 0.820 617 -0.91 0.113 495 0.826 622 -0.90 0.151 515 0.836 631 -0.90 0.234 535 0.850 642 -0.89 0.347 555 0.858 649 -0.89 0.376 575 0.861 652 -0.89 0.352 595 0.860 652 -0.89 0.361 615 0.859 651 -0.89 0.373 635 0.861 652 -0.89 0.384 WECC System 290 458 -3.54 - 310 464 -3.35 0.903 330 466 -3.27 1.208 350 469 -3.16 1.487 370 473 -3.05 1.902 390 475 -2.97 2.025 410 478 -2.90 2.541 430 481 -2.83 2.827 450 480 -2.81 2.835 470 480 -2.82 2.837
a) Uncontrolled case b) Controlled case
The control action is applied at (the communication delay is supposed to be 50 ms both for data acquisition-transmission and order transmission for the control room to the power plants to be controlled).
ms 575 ti =
Prospects
In this section we first discuss further algorithmic refinements of the technique and then present and discuss some implementation issues revealed from a recent E-SIME consideration within EU funded research project EXaMINE [11]. The need for better utilization of PMU measurements within E-SIME has been identified and our current research efforts in this context are shortly presented. Further we present a natural combination of SIME based open-loop emergency control (OLEC [3]) and E-SIME.
Further refinements
Current E-SIME technique has some limitations that have to be tackled in near future research activities. These limitations are as follows:
• Though E-SIME prediction scheme has been validated on various realistic power systems models other power systems may bring some new phenomena and prediction scheme should be adjusted accordingly. It is expected that prediction scheme will be system dependent.
• Methodology relies on the proper contingency occurrence and its clearance identification. Using consecutive phasor measurements can solve both problems. This requires additional processing power and will tight requirements on time delays.
• Appraising various types of control actions such as load shedding, fast excitation control, fast valving, dynamic breaking, mechanical power modulation, etc., should be examined (in the available version, E-SIME deals only with the generation tripping). The emergency control scheme will be strongly system dependent and appraising different types of control action will make algorithm much more flexible. Even existing generation tripping scheme should be modified to meet different requirements that different systems can impose (generation pattern in the system, giving slight priority to hydro plants, taking into account benefits and impacts of generator tripping, etc.). The generators could be ranked (prioritized) according to some specific criteria that are to be investigated.
For the time being, E-SIME assumes that the rotor angles, speeds and acceleration are known for all system machines. It would be interesting to explore how to
reduce the number to a small subset (w. r. t. a given “fragilized” area of the system).
Implementation issues
E-SIME has been considered as the transient instability emergency control approach within EU funded research project EXaMINE [11]. We rather present most important observations related to E-SIME algorithm as a result of intensive simulations performed using the model of Italian Power System. Particularly, the next parts of E-SIME were examined:
- Identification of the equivalent OMIB,
- Influence of the noise and angle reference to the OMIB identification,
- Influence of the noise to the estimation of the polynomial coefficients for approximating relation of OMIB δ −Pa.
Observation 1: Two angle references were used for
critical group identification: center of inertia (COI) and initial state reference. If COI angle reference is directly used by E-SIME then at the beginning (2-5 time steps depending on how fast the phenomena is developing) of E-SIME processing the number of critical (and non-critical) machines varies considerably what causes variations in the polynomial coefficients for approximating relation between the OMIB angle and acceleration power, margin, and time to instability. This may cause wrong decisions, particularly in the case of fast developing transients.
Conclusion 1: Using the initial state reference exhibits
better identification of critical and non-critical machines, and consequently correct identification of the OMIB from the very beginning of E-SIME processing. This eliminates variations in E-SIME prediction at the beginning, and allows faster and more accurate prediction.
Observation 2: Computation of the margin is sensitive to
the noise, particularly the noise in the individual machine speeds. Time to instability is less prone to the errors in the presence of the noise.
Conclusion 2: The observation 2 requires reformulation
of the validity check that was based on checking if computed margin is negative and not changing its value out of narrow range in two consecutive time steps. The new validity check consists of combined check of time to instability and computed margin. The algorithm first checks time to instability and if it is greater then a pre-specified value does not check the computed margin. In the case that the time to instability is less then pre-specified value the check on computed margin is performed. This may result in some cases of larger generation tripping but gives more robustness to the algorithm.
Observation 3: The presence of the noise, particularly in
the individual machine speeds, in some cases may result in premature declaration of the system being in back-swing (in this case E-SIME is self-disarming).
Conclusion 3: The criterion for E-SIME self-disarming
had to be re-examined. Instead on checking if the OMIB speed (due to the mentioned sensitivity to the noise in the speeds) reaches zero the self-disarming is now based on the check if the OMIB angle is decreasing for the three consecutive time steps.
Observation 4: The estimation of the polynomial
coefficients that relate the OMIB angle and acceleration power is not reliable after receiving just 3 measurements following the fault clearance.
Conclusion 4: The coefficients estimation is becoming
reliable approximately after receiving 5 measurements following the fault clearance.
ANN-based dynamic estimation of generators
Most of the information required by E-SIME is supposed to be provided by PMUs. Synchronized phasor measurements have been recognized to offer a unique opportunity for improving the response of protection and control systems to an evolving power swing [2, 11, 15]. Note, however, that PMUs do not deliver information directly usable by E-SIME: not only because they are connected to the high voltage buses, instead of the machines’ buses, but also because they measure electrical variables (voltages and currents that can experience discontinuity under switching in the network), while the quantities needed are machines’ rotor angles, speeds, accelerations (mechanical variables) and electrical powers. In addition, high precision of PMU data is not achieved in an actual field installation due to errors from instrumentation channels [14], and these data have to be pre-processed. This issue of translating PMUs’ data into generators’ data we recently addressed in [18,19], by using artificial neural networks (ANNs).
The rotor angle is a nonlinear function of the machine terminal variables and the main idea is to employ a pattern recognition scheme to map the patterns of inputs (variables measured by a PMU) to the required rotor angle (and speed).
This mapping can be represented by,
{ }
{ }
1: u R R
f n k
k ∈ → δ ∈ (8)
where at
any instant , and depends on the number of input variables as well as number of previous measurements used. To realize the mapping of the machine terminal variables measured by a PMU to the rotor angle the multi-layer feed-forward ANN has been suggested [18,19]. The
results of our initial and current research efforts in solving this problem can be found in [18] and [19].
{ }
[
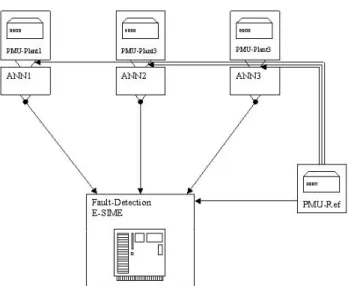
T vk k k k k k V t I t V t I t t u = (), (), ( −1), ( −1),θ ()... k nFig. 3 Distributed rotor angle estimation and procedure using one PMU device and one ANN
Fig. 3 shows one of two possible schemes for the E-SIME implementation. It is composed of two types of modules:
Distributed ANN based rotor angle estimation and prediction. Each monitored power plant is equipped with
a PMU device measuring the EHV side current and voltage phasors, at a rate of one per each 50 ms interval with respect to a common reference frame synchronized with the nominal frequency. These signals are then put into the actual system frequency reference frame by subtracting the phase signal obtained from a remote system bus (PMU-ref) and fed into the ANN module (three successive values) whose output furnishes an estimate of the current value of the power plants average rotor angle and its predicted value two time steps ahead (100 ms). The ANN module is trained off-line using a detailed system and PMU model to generate input and output samples.
]
Central monitoring of loss of synchronism and emergency control. This module receives the estimated and predicted
values of rotor angles computed by the devices of the monitored plant, together with the voltage magnitudes of the PMU devices. These signals are monitored in order to detect fault occurrence near one of the power plants and its clearing. Upon fault clearing the E-SIME module is armed and starts monitoring the system dynamic behaviour. As soon as loss of synchronism is predicted the tripping signal is computed and sent to the critical power plant.
The overall round-trip delay was estimated to be about 350 ms, which led to the conclusion of the feasibility of the E-SIME based emergency control scheme.
The other implementation scheme that was examined in the EXaMINE project used a centralized version of the rotor angle estimation modules. With respect to the scheme of Fig. 3, this latter scheme has higher throughput requirements on the links from the monitored power plants to the central location, but reduces the number of channels from the PMU-Ref location. Note that in both schemes it would be appropriate to introduce redundancy on the different devices and in particular in the common PMU-Ref device.
In [19], it has been demonstrated that an intuitive approach to directly map phasor measurement inputs to the neural network to generator rotor angle does not offer satisfactory results. It has been found out that a good way to approach the angle estimation problem is to use two neural networks in order to estimate the sin( )δ and
)
cos(δ of the angle and recover the latter from these values by simple post-processing.
In the context of PMU data better utilization we also mention current research efforts on super-calibrator concept [14]. In this concept the filtering process is confined to the substation, the instrumentation channels are explicitly represented and the substation model is a breaker-oriented three-phase model and generator dynamics included in the model. Errors correction, stemming from instrumentation channels, is provided. This concept has been studied in [14] in the context of power system stability monitoring and prediction. We believe that this concept could be extended to power system control and is worth further investigation in conjunction with E-SIME.
Combining E-SIME with existing event-based emergency controls
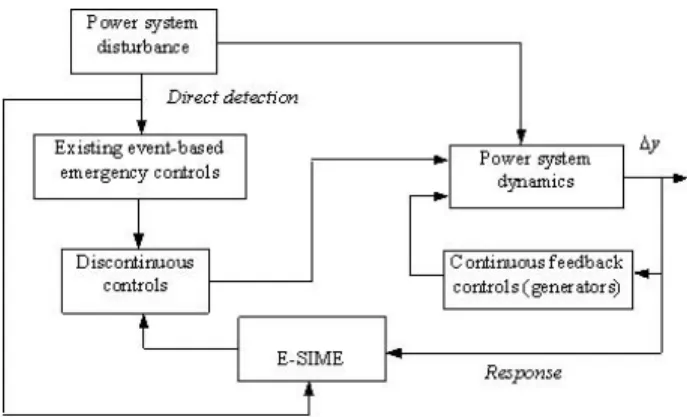
Installed transient stability emergency controls are mainly event-based activated after a selected system contingency detection [15,22]. Many emergency control schemes of this type, for numerous operating and contingency conditions, exist in many power systems [15,22]. We believe E-SIME might prove to be an extremely useful complement to the existing emergency control schemes. Fig. 4 shows a block diagram of such transient stability control environment.
Such a control environment provides an additional flexibilities to existing event-based controls by allowing control for contingencies and conditions not covered by event-based controls and by catering to uncertainty in simulation results used to determine control rules and limits. In the remaining of this subsection we describe such a control environment combining OLEC and E-SIME.
Fig. 4 E-SIME combined with existing event-based emergency controls The OLEC [3] aims at realizing a tradeoff between preventive and open-loop emergency control by combining preventive with emergency actions. Besides, it uses systematic assessment, able to reach a satisfactory solution of sufficiently moderate emergency control and economically acceptable preventive control. Both E-SIME and OLEC techniques rely on the general E- SIME-based control approach. Hence the idea to couple them so as to combine their complementary features, in particular the rapidity of OLEC action with the closed-loop capability of E-SIME. The approach aims at combining advantages of event-based and response-based system protection schemes, namely, speed of action and robustness with respect to uncertainties in system modeling [23].
Indeed, despite important assets, E-SIME needs some delay (say, 450 ms from the disturbance inception) before triggering the control action, and the larger this delay, the larger the generation shedding needed. This delay can even become fatal to the system integrity, if the contingency is very severe.
On the other hand, OLEC is likely to act much faster (say, 150 ms after the disturbance inception) since the automatic protection activating the generation tripping scheme uses only local measurements to detect the fault and act, in contrast to E-SIME, which- at least in principle- needs all machines’ rotor angles and powers. But the suggested action may be incorrect, at least partly, given the uncertainties about the anticipated operating conditions.
Coupling the above two techniques may combine their advantages while avoiding part of their weaknesses, at least from a theoretical viewpoint. In short, this combination yields the following scenario of events:
• At t0: disturbance inception.
• At t1 = 150 ms: triggering the generation shedding
pre-defined by OLEC.
• At t2 = 180 ms: based on sets of real-time measurements
instability size (margin); time to instability (when the system will lose synchronism irrevocably in the absence of control action); and decides about control action (CMs to shed).
Further, E-SIME compares the above control action based on the measurements with the one decided by OLEC and already triggered 30 ms earlier, and:
• If E-SIME assesses the latter to be sufficient, it does not take any additional action but simply continuous monitoring the system, based on incoming sets of measurements;
• If, on the contrary, it deems the OLEC action insufficient, it predicts the system new transient stability status (new instability size and time to instability), given the action already triggered. Note that the new time to instability is larger than the one assessed under the assumption of no OLEC action; hence, there is more time left to refine its assessment, if necessary, and/or to make the delay of 300 ms sufficient for preserving the system integrity.
Fig. 5 sketches the main steps of the above procedure. TSA periodical analysis
(OLEC)
TSA periodical analysis (OLEC) TSA simulations Updating SPS settings (some minutes) Fault TSA simulations 20 minutes t1 t0 t3 Periodical analysis interrumped
Triggering Emergency control action designed by OLEC
150 ms
180 ms
Predictive Stability Assessment of Emergency SIME using the real-time measurements it receives
with a sample rate of 20 ms
450 ms
Whenever necessary, triggering Emergency control action designed by Emergency
SIME
Time
t2
Fig. 5 SIME-based emergency control actions against transient stability Of course, the above preliminary study should be adjusted to cope with technical performances and requirements. Obviously, this would worth a careful and in-depth evaluation.
Conclusions
A response-based technique for closed-loop transient stability emergency control is presented in this paper. It relies on a method called E-SIME and uses real-time information furnished by PMUs to predict the stability status of the power system, and to design and trigger appropriate countermeasures, and, further, to continue monitoring the system in order to check the effectiveness
of the control or apply additional one. This paper revisited the original method, summarized recent and past achievements, and then focused on various specifics and features, putting the accent on implementation issues, important observations and conclusions from recent applications, and technical underpinnings in terms of new technological solutions and algorithms for accurate estimation and prediction of most important power system quantities for transient stability assessment and control.
References
[1] D. Ruiz-Vega, M. Pavella, “A Comprehensive Approach to Transient Stability Control, Part I: Near Optimal Preventive Control”, IEEE Transactions on Power Systems, Vol. 18, No. 4, pp. 1446-1453, Nov. 2003.
[2] CIGRE task force 38.02.19, “System Protection Schemes in Power Networks”, Technical Brochure 187, June 2001.
[3] L. Wehenkel, “Emergency Control and its Strategies”. Proc of PSCC 1999, Vol. 1, pp. 35-48. Trondheim, Norway, June 28-July 2, 1999.
[4] D. Ruiz-Vega, M. Pavella. “A Comprehensive Approach to Transient Stability Control, Part II: Open Loop Emergency Control”, IEEE Transactions on Power Systems, Vol. 18, No. 4, pp. 1454-1460, Nov. 2003.
[5] Y. Zhang, L. Wehenkel, M. Pavella, “A Method for Real-Time Transient Stability Emergency Control”. Proc. of CPSPP’97, IFAC/CIGRE, pp. 673-678, Beijing, CHINA, August 1997. [6] M. Pavella, D. Ernst, D. Ruiz-Vega, “Transient Stability of Power
Systems: A Unified Approach to Assessment and Control”. Kluwer Academic Publishers. ISBN: 0-7923-7963-2, September 2000. [7] D. Ernst, M. Pavella, “Closed Loop Transient Stability Emergency
Control”; Proceedings of the IEEE PES Winter Meeting 2000, January 23 - 27, Singapore, 2000.
[8] D. Ernst, D. Ruiz-Vega, M. Pavella, “Preventive and Emergency Transient Stability Control”, Proceedings of the VII SEPOPE 2000, May 21st-26th 2000, Curitiba Brazil, 2000.
[9] D. Ernst, A. Bettiol, Y. Zhang, L. Wehenkel, M. Pavella, “Real-Time Transient Stability Emergency Control of the South-Southeast Brazilian System, Proceedings of the V SEPOPE, Salvador, Brazil, Paper IP044, May 1998.
[10] A Diu, L. Wehenkel, “EXaMINE – Experimentation of a Monitoring and Control System for Managing Vulnerabilities of the European Infrastructure for Electric Power Exchange”, IEEE PES Summer Meeting 2002, Chicago, USA, June 2002.
[11] M. Begovic, D. Novosel, D. Karlsson, C. Henville, G. Michel, “Wide Area Protection and Emergency Control”, Proceedings of the IEEE, vol. 93, no. 5, pp. 876-890, May 2005.
[12] A. P. Meliopoulos, G. J. Cokkinides, O. Wazynczuk, E. Coyle, M. Bell, C. Hoffman, C. Nita-Rotaru, T. Downer, L. Tsoukalas, R. Gao, “PMU Data Characterization and Application to Stability Monitoring”, Proceedings of IEEE PES General Meeting 2006, Montreal, Canada, p. 8, June 2006.
[13] A. DelAngel, M. Glavic, L. Wehenkel, “Using Artificial Neural Networks to Estimate Rotor Angles and Speeds from Phasor Measurements”, Proceedings of ISAP2003, Lemnos, Greece, Paper ISAP03/017, September 2003.
[14] A. DelAngel, P. Geurts, D. Ernst, M. Glavic, L. Wehenkel, “Estimation of Rotor Angles of Synchronous Machines using Artificial Neural Networks and Local PMU-based Quantities”, to appear in Neurocomputing, Elsevier, 2007.
[15] CIGRE task force C2.02.24, “Defense Plan Against Extreme Contingencies”, Technical Brochure, December 2006.
[16] P. M. Anderson, B. K. LeReverend, “Industry Experience with Special Protection Schemes”, IEEE Transactions on Power Systems, Vol. 11, No. 3, pp. 1166-1179, 1996.
[17] N. B. Bhatt, “Field Experience with Momentary Fast Turbine Valving and Other Special Stability Controls Employed at AEP’s Rockport Plant”, IEEE Transactions on Power Systems, Vol. 11, No. 1, pp. 155-161, 1996.
[18] J. R. Smith, G. Andersson, C. W. Taylor, “Annotated Bibliography on Power System Stability Controls: 1986-1994”, IEEE Transactions on Power Systems, Vol. 11, No. 2, pp. 794-800, 1996.
[19] D. N. Kosterev, J. Eszstergalyos, C. A. Stigers, “Feasibility Study of Using Synchronized Phasor Measurements for Generator Dropping Controls in the Colstrip System”, IEEE Transactions on Power Systems, Vol. 13, No. 3, pp. 755-761, 1998.
[20] S. Rovnyak, C. W. Liu, J. Lu, W. Ma, J. Thorp, “Predicting Future Behavior of Transient Events Rapidly Enough to Evaluate Remedial Control Options in Real-Time”, IEEE Transactions on Power Systems, Vol. 10, No. 3, pp. 1195-1203, 1995.
[21] K. Mei, S. M. Rovnyak, “Response-Based Decision Trees to Trigger One-Shot Stabilizing Control”, IEEE Transactions on Power Systems, Vol. 19, No. 2, pp. 531-537, 2004.
[22] C. W. Taylor, D. C. Erickson, K. E. Martin, R. E. Wilson, V. Venkatasubramanian, “WACS – Wide-Area Stability and Voltage Control System: R&D and Online Demonstration” Proceedings of the IEEE, Vol. 93, No. 5, pp. 892-906, May 2005.
[23] D. Ruiz-Vega, M. Glavic, D. Ernst, “Transient Stability Emergency Control Combining Open-Loop and Closed-Loop Techniques”, Proceedings of the IEEE PES General Meeting, Toronto, Canada, pp. 2053-2059, 2003.