HAL Id: in2p3-00128627
http://hal.in2p3.fr/in2p3-00128627
Submitted on 2 Feb 2007HAL is a multi-disciplinary open access archive for the deposit and dissemination of sci-entific research documents, whether they are pub-lished or not. The documents may come from teaching and research institutions in France or abroad, or from public or private research centers.
L’archive ouverte pluridisciplinaire HAL, est destinée au dépôt et à la diffusion de documents scientifiques de niveau recherche, publiés ou non, émanant des établissements d’enseignement et de recherche français ou étrangers, des laboratoires publics ou privés.
Modeling the complexation properties of mineral-bound
organic polyelectrolyte: An attempt at comprehension
using the model system alumina/polyacrylic acid/M (M
= Eu, Cm, Gd)
Gilles Montavon, S. Markai, S. Ribet, T. Rabung, H. Geckeis, Bernd Grambow
To cite this version:
Gilles Montavon, S. Markai, S. Ribet, T. Rabung, H. Geckeis, et al.. Modeling the complexation properties of mineral-bound organic polyelectrolyte: An attempt at comprehension using the model system alumina/polyacrylic acid/M (M = Eu, Cm, Gd). Journal of Colloid and Interface Science, Elsevier, 2007, 305, pp.32-39. �10.1016/j.jcis.2006.09.037�. �in2p3-00128627�
Modeling the complexation properties of mineral-bound organic polyelectrolyte; An attempt of comprehension using the model system Alumina/Polyacrylic Acid/M (M=Eu, Cm,Gd).
G. Montavon*, S. Markai, S. Ribet, T. Rabung⊥, H. Geckeis⊥ and B. Grambow
Laboratoire SUBATECH, 4 rue A. Kastler, BP 20722, 44307 Nantes cedex 03, France
⊥
Institut für Nukleare Entsorgung, FZK, Postfach 3640, D-76021 Karlsruhe, Germany
*
corresponding author; phone: 33(0)251858420; fax: 33(0)251858452; e-mail:
montavon@subatech.in2p3.fr.
Abstract
This paper contributes to the comprehension of kinetic and equilibrium phenomena governing metal ion sorption on organic matter coated mineral particles. Sorption and desorption experiments were carried out with Eu and polyacrylic acid (PAA) coated alumina colloids at pH 5 in 0.1 M NaClO4 as a function of the metal ion loading. Under these conditions, M
interaction with the solid is governed by sorbed PAA (PAAads). The results were compared
with spectroscopic data obtained by Time Resolved Laser Induced Fluorescence Spectroscopy (TRLFS) with Cm and Gd. The interaction between M and PAAads was characterized by a
kinetically-controlled process: after a rapid metal adsorption within less than 1 minute, the speciation of complexed M changed at the particle surface till an equilibrium was reached after about 4 days. At equilibrium, one part of complexed M was shown to be not exchangeable. This process was strongly dependent on the ligand-to-metal ratio. Two models were tested to explain the data. In model 1, the kinetically controlled process was described through successive kinetically controlled reactions which follow the rapid metal ion
adsorption. In model 2, the organic layer was considered as a porous medium: the kinetic process was explained by the diffusion of M from the surface into the organic layer. Model 1 allowed a very good description of equilibrium and kinetic experimental data. Model 2 could describe the data at equilibrium but could not explain the kinetic data accurately. In spite of this disagreement, model 2 appeared more realistic considering the results of the TRLFS measurements.
Introduction
For the assessment of radionuclide mobility in contaminated soils, the interaction between actinide metal ions, M, and humic substances, HS, has been the subject of various studies [e.g. 1]. These studies have been carried out notably with trivalent actinides (Cm, Am) and chemical homologues (e.g. Eu, Gd), as their solution behavior in the environment under given conditions is known to be dominated by organic macromolecules [e.g. 1]. The nature of this interaction depends on the chemical state of the organic material which can be soluble or associated with mineral surfaces. Interaction of actinides with HS-mineral complexes is still a matter of discussion [2-8].
In most cases, the metal ion interaction with the organic-mineral complex cannot be simply described by combining the behavior observed in the individual binary systems M/HS and M/mineral phase [9]. To understand the M/HS-mineral interactions, simplified systems are used. Polycarboxylic acids (10-13) were selected to model the behavior of humic substances as far as their polyelectrolyte character and functional groups are concerned. In a recent study using polyacrylic acid (PAA) [13], it was shown that the interaction of M (M=Cm,Eu) with mineral-adsorbed PAA (PAAads) is different from the interaction with dissolved PAA. The
M/PAA interaction can be described by considering PAA as a classical organic ligand [14]. The interaction of M with PAAads is more complex: after a rapid attachment of M at the
organic-mineral surface (“initially formed” species), a kinetically- controlled process occurs till a real equilibrium is achieved. The kinetically-controlled process was described, for one ligand-to-metal ratio, through successive kinetically controlled reactions which follow the rapid metal ion adsorption. When the real equilibrium conditions were reached, a fraction of sorbed Eu was shown to be bound in an irreversible manner (the “non-exchangeable” fraction).
The aim of the paper is to complete these data by studying the kinetically-controlled process for a wide range of ligand-to-metal ratios with the intention to (i) assess the effect of the ligand-to-metal ratio on the formation of the “non-exchangeable” fraction and (ii) see whether the kinetic model used in [13] can be generalized.
As in [13], the ternary system is composed of γ-alumina, trivalent metal ions M (M=Eu and Cm) and a polycarboxylic acid. M interaction with the organic-mineral complex is selectively studied by immobilizing the polymer on the mineral phase prior to M adsorption. The sorption and desorption of M is studied at equilibrium or as a function of the contact time between M and PAAads at pH=5 in 0.1M NaClO4 with γ-alumina saturated with PAA. In these conditions,
M interaction with aluminol surface sites can be neglected. The modeling of the interaction of M with sorbed PAA is supported by a spectroscopic study using Time Resolved Laser Fluroresence Spectroscopy (TRLFS) with Cm and Gd.
Materials and Methods
(A) Chemicals. Commercially available sodium perchlorate monohydrate (Fluka, purum), Europium oxide (Prolabo, RECTAPURTM), Gadolinium oxyde (Johnson Matthey, 99,999%)
and polyacrylic acid at 5000 Da (Aldrich Chemical Company) were used as received. An
152
Eu(III)-tracer solution was provided by CEA/DAMRI. 248Cm stock solution was obtained
exchange capacity (PEC) of PAA amounts to 11.3±0.4 meq/g [14]. γ-alumina was purchased from Degussa - Huls (Aluminium Oxide C, primary particle size of 20 nm, specific surface area (Sa) of 100 m2/g, site density of 1 nm-2[15]) and was used without further purification.
Stock suspensions/solutions of alumina and PAA at 10 g/L were prepared at pH=5 in 0.1M NaClO4. The alumina content in the suspension was systematically checked by drying at
105°C for 12h. PAA and Alumina stock solutions were stored for a maximum of 1 week and 1 day, respectively.
(B) Experimental Procedures. All solutions were prepared using Milli-Q water and all experiments were conducted in polyethylene tubes at room temperature. The experimental conditions were chosen so that Eu interaction with aluminol surface sites can be neglected in the ternary system: all experiments were carried out at pH=5 in 0.1 M NaClO4 [13] with the
alumina surface being saturated by PAA.
Preparation of alumina-bound polyacrylic acid colloids. The method could be found elsewhere [13]. The final stock suspension was stored for a maximum of 2 weeks. The concentration of the suspension, c, expressed in terms of alumina concentration (in g/L), was determined by drying at 105°C for 12h. The degree of PAA loading, corresponding to the ratio between concentrations of sorbed PAA (in mg/L) and of alumina (in g/L), was equal to Γ=59±3 mg/g. This value corresponds to the maximum of adsorption.
It was checked that no significant desorption of the initially adsorbed PAA occurred (i.e. below 6%) neither during the preparation of the stock suspension nor in the experiments with M. Furthermore, it was shown that no further PAA adsorption on organic-mineral particles occurred in the experiments carried out in the Eu(III)/PAA/PAAads system.
Sorption and desorption experiments. These studies were performed as batch experiments with Eu. Eu and 152Eu were mixed at pH=5 in 0.1M NaClO4 before the addition of PAA
PAA or not) by filtration through 0.02 μm Anatop 25 inorganic membrane filters (Whatman). The distribution coefficient was defined as:
(P) [Eu] [Eu] [Eu] Kd sol sol tot − = (1)
where (P), [Eu]tot and [Eu]sol corresponded to the concentration of adsorbed polymer (in g/L),
the total concentration of Eu (in M) in the system and the concentration of all Eu species in solution at equilibrium (in M), respectively. When needed, the Kd values were corrected for the amount of Eu sorbed on the filters. In the Eu/PAA/PAAads system, it was shown that the
adsorption of PAA on filters could be neglected. The different types of experiments performed in this study are described below together with the experimental conditions.
Determination of the sorption isotherm: The data measured in the present work aimed to complete those presented in [13]. Organic-mineral particles and Eu(III) concentrations were varied from 0.2 to 0.5 g/L and from 4.10-9 to 3.10-5 M, respectively. The suspensions were put
in contact for tcon=1min (characterization of the local equilibrium) and tcon=7 days (real
equilibrium) before separation. The pH values were monitored during the equilibration and were readjusted, if necessary, to a value of 5 by addition of either NaOH or HClO4.
Speciation of Eu in the presence of PAAads and PAA: The speciation of Eu at the PAAads
surface was evaluated (at equilibrium, or as a function of tcon) using PAA as a competiting
agent [13]. Note that tcon refers to the contact time between PAAads and Eu, while tc refers to
the contact time between Eu-PAAads complex and PAA. For all experiments, PAA and PAAads
concentrations were fixed at 5 and 0.25 g/L, respectively. The high concentration of PAA allowed to desorb the exchangeable part of Eu in interaction with PAAads. When the contact
time between Eu-PAAads complex and PAA was less than one minute, PAA desorbed only Eu
associated with the “initially formed” species [13]. When tc ≥ 7 days, only the
(C )Analytical Methods. PAA concentration was analyzed by Total Organic Carbon (TOC) measurements using a Shimadzu TOC 5000A analyzer. Eu and Cm analyses were performed by liquid scintillation counting using a Packard 2550 TR/AB Liquid Scintillation analyzer.
(D) TRLFS. The goal of these spectroscopic investigations is to observe Cm speciation in interaction with PAAads as a function of metal ion loading and tcon. It was characterized by:
P tot ] M [ ] COOH [ r= (2)
with [M]p being the concentration of complexed M and [COOH]tot the total concentration of
carboxylic groups. Data are already available for Eu [16]. In this study, the previous data were completed with Cm which has the advantage to be more sensitive than Eu. The metal ion loading was varied by adding Gd: it is a chemical homologue of Cm and does not interfere with Cm fluorescence. The chemical environment of complexed Cm was reflected by both the fluorescence lifetime values and emission spectra. Details concerning the measuring device as well as details on how spectroscopic data were obtained can be found elsewhere [17]. The samples were excited at a constant wavelength of 396.6nm. The laser energy was fixed to (2.5±0.5) mJ. Under these conditions, no photodegradation of PAA could be observed. This was checked by monitoring the fluorescence intensity before and after lifetime measurements. It was also verified that laser irradiation did not induce any PAA desorption from the alumina. For the emission spectra, PAAads concentration (c) was fixed to 0.5 g/L and M concentration
was varied: r=8.3.104 ([Cm]tot=4.10-9 M), r=3300 ([Cm]tot=1.10-7 M), r=330 ([Cm]tot=1.10-7 M
and [Gd]tot=9.10-7 M) and r=33 ([Cm]tot=1.10-7 M and [Gd]tot=1.10-5 M). Experimental
conditions used for the measurements of the fluorescence decay curves are given in Table 1. Fluorescence decay curves were fitted with SigmaPlot software using the
Marquardt-Levenberg algorithm (version 2.0, Jandel Co.). Uncertainties associated to the fitting parameters were given by the software.
It is considered that Eu, Cm and Gd have similar interaction properties with PAA.
(E) Modeling. Considering the experimental conditions, M/Al2O3 interaction was neglected
[13]. The parameters used to describe the interaction between M and free PAA are given in [14]. Two simple models were tested to explain the kinetic process. They are described below:
Model 1. The kinetically controlled process is described through successive kinetically controlled reactions which follow a rapid metal ion adsorption according to the general
reaction scheme [13]:
A part of the “initially formed” M (species MP) is slowly converted, in an irreversible manner, into a kinetically stabilized species (MPni). The second part of the initially bound M
experience as well kinetically controlled reactions, but in a reversible manner (MPi, i=1-n).
The kinetic stabilization is explained by a rearrangement process of the PAA at the alumina surface. The strategy to obtain the kinetic parameters as well as the fraction of sorbed M in the kinetically stabilized environment MPni could be found elsewhere [13]. The MAKSIMA
program was used for the modeling [18].
Model 2. In model 2, the organic layer is considered as a porous medium in which no conformational effect occurs. The surface of the organic layer is divided into two regions, one in contact with the bulk solution (external surface), the other in contact with the pore volume
MP ... MP MP P M n n k p n k p 1 1 k p k p k p ⎯ ⎯ ⎯ → ⎯ ⎯ ⎯ ⎯ ⎯ ⎯ ← − 1 k p ⎯ ⎯ ⎯ → ⎯ ⎯ ⎯ ⎯ ⎯ ⎯ ← − ⎯ ⎯ ⎯ → ⎯ + ⎯ ⎯ ⎯ ⎯ ← − + k p ni MPni (3) MP ... MP MP P M n n k p n k p 1 1 k p k p k p ⎯ ⎯ ⎯ → ⎯ ⎯ ⎯ ⎯ ⎯ ⎯ ← − 1 k p ⎯ ⎯ ⎯ → ⎯⎯ →pk⎯⎯1 ⎯ ⎯ ⎯ ⎯ ⎯ ⎯ ← − ⎯ ⎯ ⎯ → ⎯ + ⎯ ⎯ ⎯ ⎯ ← − + k p ni k p ni MPni (3)
within the organic layer (internal surface). The water composition in the bulk (Vb) and pore
(Vp) volumes is supposed to be identical. In the system, two local equilibria occurs: one
between M and the carboxylate groups localized at the internal surface (≡X−in), the other between M and the carboxylate groups associated to the external surface (≡X−ex). In both cases, the interaction is described by an ion exchange process [19]:
+ → ← + + → ← + + ≡ + − ≡ + ≡ + − ≡ Na 3 Eu ) X ( Eu Na X 3 Na 3 Eu ) X ( Eu Na X 3 3 ex 3 ex 3 in 3 in (4)
described by the exchange constant:
] Eu [ ] Na X [ ] Eu ) X [( ] Na [ K 3 3 ) ex ( in 3 ) ex ( in 3 ) ex ( in + + − ≡ ≡ = (5)
In this study, no electrostatic correction is considered; the constants given in the paper are conditional parameters. The number of internal (nin(≡X−in)) and external (nex(≡Xex− )) groups
(in mol) introduced in the model are calculated according to :
p ex ex b in in V . . c . S ) X ( n V . . c . S ) X ( n Γ = ≡ Γ = ≡ − − (6)
with Sin and Sex being the number of groups associated to the internal and external surfaces,
respectively in mol/g of sorbed PAA. The pore volume was calculated according to the relation: ) . . 10 10 . h . S .( c . V Vp = b a 3 − −6Γρ−1 (7)
with h being the height (in m) of the organic layer and ρ the volumetric mass of PAA (which is supposed to be equal to 1 kg/L). The real equilibrium is reached when M concentration in the bulk volume corresponds to the one in the pore volume. According to previous studies, the interaction of M with PAA is fast [13,14]. Based on these considerations, the observed
kinetically controlled process is explained by the diffusion of M in the organic layer. In model 2, the “initially formed” species corresponds to Eu in interaction with the external surface groups.
Sex and Kex were deduced from the analysis of the isotherm measured for tcon=1 min: the local
equilibrium between M and external surface groups is reached whereas the diffusion of M in the organic layer can be neglected. Sin and Kin were derived from the analysis of the isotherm
measured at the real equilibrium and from the evolution of the percentage of the initially formed species measured as a function of r. Finally, the effective diffusion coefficicent, De
was determined using experiments realized as a function of the contact time. For h, a value of 2nm is taken. This value was estimated from the works of Chibowslki et al. who studied the thickness of the PAA adsorption layer as a function of pH, ionic strength, nature of the electrolyte, organic loading, mineral and molecular weight [20,21]. The geochemical code PHREEQC [22] associated with the LLNL database was used for the modeling.
Results and discussion
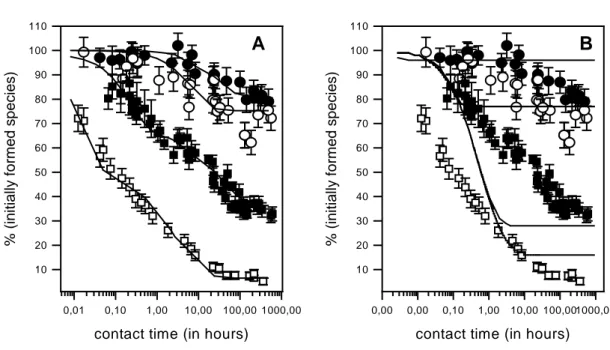
(A) Sorption experiments. All sorption experiments are reported in Figures 1, 2 and 3. The kinetically-controlled process is evidenced for all r values studied, i.e. for r>33. Figure 1 reports the evolution of the percentage of “initially formed” species as a function of tcon. The
time to reach equilibrium appears similar for all r values, i.e. about 4 days. The kinetically-controlled process is more pronounced as r increases, i.e. the amount of “initially sorbed species” at equilibrium decreases as r decreases. Figure 2 describes the formation of the “non-exchangeable” fraction as a function of tcon for 33<r<8.3 104. Two series of experiments were
performed. In the first case, Eu was equilibrated with PAAads before the addition of PAA
(open symbols) whereas in the second case, Eu was mixed with PAA before the addition of PAAads (filled symbols). Equilibrium conditions appear identical in both cases. As for the
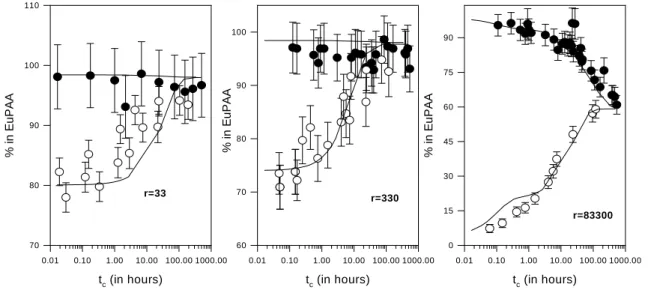
“initially formed” species, the “non-exchangeable” fraction appears sensitive to r value. This effect is better expressed in Figures 3B and 3C which display the evolution of Eu speciation at PAAads surface as a function of r under the real equilibrium conditions. The
“non-exchangeable” fraction is not observed for r<500 and then increases as r increases till a value of about 30% is reached for r=8.3 104. For the “initially formed” species, its proportion
decreases from about 90 to 10% as r decreases from 8.3 104 to 33.
Finally, Figure 3A reports the sorption isotherms. A slight difference between the isotherms measured at the local and real equilibrium can be evidenced for the lowest metal ion concentrations. However, considering the error bars, the difference remains weak.
(B) TRLFS measurements.
Kinetic study: Emission spectra were recorded as a function of tcon for r values varying from
33 to 8.3 104. The peak position of the emission spectra is known to be sensitive to the first
coordination sphere around Cm [17]. Irrespective of r value, no significant effect was observed. This is illustrated in Figure 4A for r=8.3 104. The peak position does not change
with the contact time. The kinetically controlled process evidenced from sorption studies is therefore not observed by TRLFS. This means that the process is not accompagnied by a change in Cm (Eu) speciation, as far as the nature of the first coordination sphere is considered.
Effect of metal ion loading. Both emission spectra (Figure 4B,C) and decay curves (Table 1) were measured. The basic assumptions are to consider that (1) the lifetime value is sensitive only to the number of water molecules in the first coordination sphere (PAA does not act as quencher) [23] and (2) the number of lifetime values gives the minimal number of complexed species [24]. Experiments performed for r around 300 with or without Gd lead to the same results. This shows that Gd is a good model for Cm.
The emission spectra (Figure 4B) and decay curves are not significantly affected for 8.3 104 > r > 333. Two lifetimes at 110 μs and 200 μs are obtained with associated intensities of 80 and 20 %, respectively. According to assumption (ii), this would indicate the presence of at least two species. This conclusion appears however not obvious when the emission spectra are analysed:
the emission spectrum associated to the long lifetime (or second species) was obtained by increasing the delay time (Figure 4C). A shift of the peak position is effectively observed but it appears too weak to expect a significative change in the first coordination sphere of Cm.
the proportion of the two species appears constant for 8.3 104 > r > 333. This tendancy
is not consistent with the consideration of two equilibria, i.e. two species. For example, as proposed in [13], the second lifetime could be associated to the “non-exchangeable” fraction. However, as indicated in Figure 1C, a significant variation of the “non-exchangeable” fraction is expected as r varies.
For r<333, a slight broadening of the emission spectrum is noticeable when r decreases to 33. A change is also observed when the decay curve analysis is considered: the second lifetime at 200 μs observed for r>300 is replaced by another one, in the same proportion, at 65 μs. This would indicate the presence of free Cm or the presence of an outer-sphere complex. However, this assumption is not likely: the emission spectrum could not be reconstructed considering emission spectra of Cm and CmPAAads (r=330) (see Figure 4D).
At the moment, no clear explanation for the disagreement between decay curve analysis and emission spectra could be given. One questions the validity of assumption (1) (i.e. the lifetime value is sensitive only to the number of water molecules in the first coordination sphere) when considering the interaction of metal ions with polyelectrolytes. When only the emission spectra are considered, the effect of r appears weak. One species is expected to exist at PAAads
surface for 33<r<8.3.104. The species would be characterized by an emission peak with a peak position at 600.5±0.5 nm and probably by a lifetime of 110 μs. The spectroscopic characteristics of this species correspond to those obtained for CmPAA complex [13]. A similar species is therefore expected in Eu-PAA and Eu-PAAads complexes. All these
conclusions are in agreement with those reported in a previous study performed with Eu as a function of r by laser-induced fluorescence spectroscopy using 7F0→5D0 excitation spectra
[16].
(C) Modeling.
Model 1. Model 1 was used to describe the data obtained for r=33, 330, 3300 [13] and 8.3.104
with the parameters given in Table 2. The model can describe the kinetically-controlled process accurately (Figure 1A and 2, solid lines) as well as the speciation at equilibrium (Figure 3, open squares). On the other hand, model 1 has no predictive character since a different set of parameters is necessary for each r value (see Table 2). Furthermore, it has no real physical meaning if one considers the TRLFS results, although considering for all the different species identified (MP, MPni, MPi, i=1-3; see eq. (3)) a difference of coordination in
the second coordination sphere.
Model 2: Results are presented in Figures 1B and 3 as solid lines. The isotherm obtained in the real equilibrium conditions (Figure 3A) and the evolution of the proportion of the “initially formed” species (i.e. the content of Eu in interaction with the external surface sites) as a function of r (Figure 3B) can be well described with logKin=6.42 and Sin=13.5 μeq/g. The
low content of internal sites considered in the model as compared to the concentration of external sites (Sex=600 μeq/g) is in agreement with the fact that the isotherms measured for
−
≡Xex) are identical for [Eu]sol>1.10-7 (Figure 3A). To allow a good agreement between the
calculation and the experiment, logKin was increased by a factor of two order of magnitude as
compared to logKex (=4.2). According to the TRLFS studies, the internal ((≡Xin)3Eu) and
external species ((≡Xex)3Eu) are similar. This difference would therefore be explained by a difference in the electrostatic term contribution in the conditional constants. This is coherent with the fact that the potential effect on the interaction strength should be higher within the organic layer than at the surface.
The “equilibrium model” was used, as a predictive tool, to describe the evolution of the “non-exchangeable” fraction as a function of r (Figure 3C, solid line). Model 2 predicts effectively that a part of Eu sorbed on PAAads cannot be removed by PAA, in spite of its high
concentration. The amount predicted for the highest r value appears however lower than the experimental one (5% instead of about 25%). This is explained by the fact that within the organic layer, there is locally a high concentration of carboxylic groups. The local equilibrium occuring within the organic layer between M and ≡Xin− can therefore “compete” with the local equilibrium occuring in the bulk, i.e. between M and PAA (the interaction between M and ≡X−ex can be neglected).
In conclusion, the “equilibrium model” can describe all the tendancies observed considering an unique set of parameters. Furthermore, it presents the advantage to be in agreement with TRLFS results since only one species is considered.
According to model 2, the kinetically-controlled process is explained by the diffusion of M within the porous medium (composed of the organic layer). The “equilibrium model” was therefore coupled with a transport model to evaluate the pertinence of this assumption. The results of the calculation are reported by the solid lines in Figure 1B. An effective diffusion coefficient of about 10-15 m2.s-1 was obtained to explain the time to reach equilibrium (i.e.
about 4 days). On the other hand, the agreement between the calculation and the experiment appears poor. The description of a diffusion process within a rigid organic structure can be excluded. This view appears too simple considering the nature of the organic layer. Probably one cannot exclude conformational effects occuring at the alumina surface after M sorption. In conclusion, the two simple models tested in the present paper are not applicable. It appears that a new approach to describe the sorption of M with sorbed PAA is needed. This new approach passes notably by the characterization of the probable dynamic process of PAA chains at alumina surface which occurs after metal ion complexation.
Ackowledgement
The work is included in the EC Nework Of Excellence Actinet (PAA project 02-15). The money given for mobility measures is gratefully acknowledged.
Literature Cited
1. Choppin, G.R. In Chemical Separation Technologies and Related Methods of Nuclear Waste Management; Choppin, G.R., and Khankhasayev, M.Kh., Eds.; Kluwer Academic Publ.; Dordrecht, 1999; p. 247.
2. T. Rabung, H. Geckeis, J.I. Kim, H.P. Beck, Radiochim. Acta 82 (1998) 243.
3. A.J. Fairhurst, P. Warwick, S. Richardson, Colloids Surfaces A: Physicochem. Eng. Aspects 99 (1995) 187.
4. C.H. Ho, N.H. Miller, J. Colloid Interf. Sci. 106 (1985) 281.
5. L. Righetto, G. Bidoglio, G Azimonti, I.R. Bellodono Environ. Sci. Technol. 25 (1991) 1913.
6. J.J. Lenhart, B.D. Honeyman, Geochim. Cosmochim. Acta. 63 (1999) 2891. 7. P. Reiller, V. Moulin, F. Casanova, C. Dautel, Appl. Geochem. 17 (2002) 1551. 8. N. Labonne-Wall, V. Moulin, J-P. Vilarem, Radiochim. Acta 79 (1997) 37.
9. A.W.P. Wermeer, J.K. Mcculloch, W.H. Van Riemsdijk, L.K. Koopal, Environ. Sci. Technol. 33 (1999) 3892.
10. Y. Takahashi, T. Kimura, Y. Kato, Y. Minai, Environ. Sci. Technol. 33 (1999) 4016. 11. R.M. Floroiu, A.P. Davis, A. Torrents, Environ. Sci. Technol. 35 (2001) 348.
12. G. Montavon, S. Markai, Y. Andrès, B. Grambow, Environ. Sci. Technol. 36 (2002) 3303.
13. G. Montavon, T. Rabung, H. Geckeis, B. Grambow, Environ. Sci. Technol. 38 (2004) 4312.
14. G. Montavon, B. Grambow, New J. Chem. 27 (2003) 1344.
15. T. Rabung, T Stumpf, H. Geckeis, R. Klenze, J.I. Kim, Radiochim. Acta 2000, 88, 711. 16. G. Montavon, C Hennig, P. Janvier, B. Grambow, J. Colloid Interf. Sci 300 (2006) 482.
17. T. Rabung, D. Schild, H. Geckeis, R. Klenze, T. Fanghanel, J.Phys. Chem., B 108 (2004) 17160.
18. M.B. Carver, D.V. Hanley, K.R. Chaplin, In MAKSIMA-CHEMIST – A program for Mass Action Kinetics Simulation by Automatic Chemical Equation Manipulation and Integration using Stiff Techniques; AECL, Chalk River, 1979.
19. T. Miyajima, M. Mori, S.-I. Ishiguro, J. Colloid Interf. Sci. 187 (1997) 259.
20. S. Chibowski, M. Wisniewska, M. Paszkiewicz, Adsorp. Sci. Technol. 20 (2002) 511. 21. S. Chibowski, M. Wisniewska, A.W. Marczewski, S. Pikus, J. Colloid Interf. Sci. 267
(2003) 1.
22. D.L. Parkhurst, C.A.J. Appelo, Report 99-4259, 1999.
23. W.D. Horrocks, D.R. Sudnick D.R., J. Am. Chem. Soc. 101 (1979) 334. 24. I. Billard, K. Lützenkirchen, Radiochim. Acta 91 (2003) 285
Table 1: results of the analysis of the decay curves τ1 (μs) I1 (%) τ2 (μs) I2 (%) c=1 g/L, [Cm]tot=4.7 10 -8 M 14246 108±9 72±35 171±52 28±39 c=1 g/L, [Cm]tot=1.4 10 -7 M 4800 113±5 83±10 203±59 17±18 c=1 g/L, [Cm]tot=1.2 10 -7 M + [Gd]tot=2 10 -7 M 2064 109±3 88±5 210±53 12±7 c=0.5 g/L, [Cm]tot=1 10 -7 M + [Gd]tot=1 10 -6 M 330 109±3 79±10 190±17 21±15 c=0.05 g/L, [Cm]tot=1.4 10 -7 M 239 109±15 73±10 192±36 27±18 c=1 g/L, [Cm]tot=1.2 10 -7 M + [Gd]tot=5 10 -6 M 131 108±3 87±6 204±52 13±11 c=0.5 g/L, [Cm]tot=1 10 -7 M + [Gd]tot=1 10 -5 M 33 65(f) 14±2 112±1 86±3
legend: (f): parameter fixed for the fitting
DECAY CURVES
Table 2: Paramaters associated to model 1. The number of available sites is fixed at 0.39 mmol/g [13]. r % * Pk+ (M -1 .s-1) Pk- (s -1 ) % * Pk1 (s -1 ) Pk-1 (s -1 ) Pk2 (s -1 ) Pk-2 (s -1 ) Pk3 (s -1 ) Pk-3 (s -1 ) % * Pkni 33 81 19 2 10-6 8 10-6 _ _ _ _ _ _ this work 330 75 25 1 10-5 3 10-5 _ _ _ _ _ _ this work 3300 34 53 3 10-4 1 10-3 3 10-5 2.5 10-5 1 10-5 5 10-6 13 1 10-3 [13] 83300 5 54 1 10-2 2.5 10-3 3 10-5 1 10-5 _ _ 41 1.5 10-4 this work *
Fraction of sorbed M(III) in the different complexed species at equilibrium
MPni
REF
≥3.106 ≥0.52
Figure 1: Evolution of the “initially formed” species as a function of tcon for r=33 ( ), 330
(O), 3300 ( ) and 8.3 104 (F). The data are described with model 1 (A) and model 2 (B) with
the parameters given in Table 2 (model 1) and in the text (model 2).
A
contact time (in hours)
0,01 0,10 1,00 10,00 100,00 1000,00 % (in itially formed species) 10 20 30 40 50 60 70 80 90 100 110 B
contact time (in hours)
0,00 0,00 0,10 1,00 10,00 100,001000,00 % (in itially formed species) 10 20 30 40 50 60 70 80 90 100 110
Figure 2: Evolution of the “non-exchangeable” fraction as a function of tc for three r values.
( ) Eu was mixed with PAA before the addition of PAAads. (O) Eu was mixed with PAAads
for tcon>7days before PAA addition. Model 1 is used to describe the data with the parameters
given in Table 2. r=33 tc (in hours) 0.01 0.10 1.00 10.00 100.00 1000.00 % in Eu PAA 70 80 90 100 110 r=330 tc (in hours) 0.01 0.10 1.00 10.00 100.00 1000.00 % in Eu PAA 60 70 80 90 100 r=83300 tc (in hours) 0.01 0.10 1.00 10.00 100.00 1000.00 % in Eu PAA 0 15 30 45 60 75 90
Figure 3: Sorption of Eu on PAAads as a function of metal ion loading. (A) Isotherms
measured for local (tcon < 1 min) and real equilibrium (tcon > 7 days) conditions. (B,C)
Distribution of the “initially formed” (B) and “non-exchangeable” (C) fractions as a function of r in the real equilibrium conditions. The quantitative description is done with the parameters given in Table 2 (model 1) and in the text (model 2).
A
[Eu]sol
1e-121e-111e-101e-9 1e-8 1e-7 1e-6 1e-5 1e-4
K d (L/g) 10 100 1000 10000 tcon=7 days [13] tcon=7 days (this work) tcon=1 min
model 1+2 (tcon=1 min) model 2
model 1 (tcon=7days)
B In itially fo rm ed speci e s (in % ) 0 20 40 60 80 100 120 C r
1e+1 1e+2 1e+3 1e+4 1e+5 1e+6
"No n -ex c hangeabl e part" (in % ) 0 20 40 model 1 model 2
Figure 4: Emission spectra of Eu-PAAads complex. (A) r=8.3 104; effect of tcon; (B) Study as a
function of r (at the real equilibrium). (C) r=330, study as a function of delay time. (D) Reconstruction of the emission spectrum at r=33 considering pure spectra of Cm and Cm-PAAads (r>333). N.F.I. (a.u.): Normalized Fluorescence Intensity (arbitrary units)
B N .F.I. (a.u.) 0e+0 1e+5 2e+5 3e+5 4e+5 r=8.3.104 r=3300 r=330 r=33 A N .F .I. (a.u.) 0e+0 1e+5 2e+5 3e+5 4e+5 5e+5 6 h 26 h 53 h 72 h 96 h C N.F.I. (a .u.) 0e+0 1e+5 2e+5 3e+5 4e+5 1 μs 500 μs D λem (nm) 580 590 600 610 620 N .F.I. (a.u. ) 0e+0 1e+5 2e+5 3e+5 4e+5 r=33 Cm + CmPAAads
![Table 1: results of the analysis of the decay curves τ 1 (μs) I 1 (%) τ 2 (μs) I 2 (%) c=1 g/L, [Cm] tot =4.7 10 -8 M 14246 108±9 72±35 171±52 28±39 c=1 g/L, [Cm] tot =1.4 10 -7 M 4800 113±5 83±10 203±59 17±18 c=1 g/L, [Cm] tot =1.2 10 -7 M + [Gd]](https://thumb-eu.123doks.com/thumbv2/123doknet/7774812.257490/19.892.112.690.147.413/table-results-analysis-decay-curves-μs-μs-cm.webp)
![Table 2: Paramaters associated to model 1. The number of available sites is fixed at 0.39 mmol/g [13]](https://thumb-eu.123doks.com/thumbv2/123doknet/7774812.257490/20.892.106.817.210.331/table-paramaters-associated-model-number-available-sites-fixed.webp)