HAL Id: hal-01010243
https://hal.archives-ouvertes.fr/hal-01010243
Preprint submitted on 19 Jun 2014HAL is a multi-disciplinary open access archive for the deposit and dissemination of sci-entific research documents, whether they are pub-lished or not. The documents may come from teaching and research institutions in France or abroad, or from public or private research centers.
L’archive ouverte pluridisciplinaire HAL, est destinée au dépôt et à la diffusion de documents scientifiques de niveau recherche, publiés ou non, émanant des établissements d’enseignement et de recherche français ou étrangers, des laboratoires publics ou privés.
A detailed systematic review of the recent literature on
environmental Kuznets curve dealing with CO2
Marie-Sophie Hervieux, Pierre-Alexandre Mahieu
To cite this version:
Marie-Sophie Hervieux, Pierre-Alexandre Mahieu. A detailed systematic review of the recent literature on environmental Kuznets curve dealing with CO2. 2014. �hal-01010243�
EA 4272
A detailed systematic review of the
recent literature on environmental
Kuznets curve dealing with CO2
Marie-Sophie Hervieux*
Pierre-Alexandre Mahieu*
2014/15
(*) LEMNA - Université de Nantes
Laboratoire d’Economie et de Management Nantes-Atlantique Université de Nantes
Chemin de la Censive du Tertre – BP 52231 44322 Nantes cedex 3 – France www.univ-nantes.fr/iemn-iae/recherche Tél. +33 (0)2 40 14 17 17 – Fax +33 (0)2 40 14 17 49
D
o
cu
m
en
t
d
e
T
ra
va
il
W
o
rk
in
g
P
ap
er
A detailed systematic review of the recent literature on
environmental Kuznets curve dealing with CO2
Marie-Sophie HERVIEUX
1LEMNA, University of Nantes
IEMN IAE, Chemin de la Censive du Tertre, BP 52231, 44322 Nantes, France
marie-sophie.hervieux@univ-nantes.fr.
+(33)02 40 14 17 31.
Pierre-Alexandre MAHIEU
LEMNA, University of Nantes
IEMN IAE, Chemin de la Censive du Tertre, BP 52231, 44322 Nantes, France
Abstract
Since the early 90’, many articles have been published on Environmental Kuznets Curve (EKC), especially empirical articles dealing with CO2. In our paper, we provide a detailed
review of the empirical articles dealing with CO2 that were published in 2012 and 2013 in ISI
Web of Knowledge. Our review, which is based on 41 studies, reports many information, such as the outcome of the study or the econometric procedure employed. Our review can be useful for several purposes, such as to perform a meta-analysis or to test the EKC.
Keywords: EKC; CO2; JEL codes: Q56; Q53.
1
1 Introduction
The concept of “Environmental Kuznets Curve” (EKC) is born in 1991 with the Grossman and Krueger's study of the North American Free Trade Agreement (NAFTA) (Grossman and Krueger, 1991; Stern, 2004). According to the EKC hypothesis, economic development would deteriorate environment and then would improve it, hence resulting in an inverted U-shaped curve.
The relationship between environment and development is generally expressed as follows:
= + + +
where E is a proxy for per capita environmental degradation, Y is per capita income, and ε is the normally distributed error term. EKC hypothesis holds if > 0, < 0, and both coefficients are statistically significant. Therefore, the turning point is obtained by setting the first derivation with respect to income of our equation equal to zero.
There is a high heterogeneity in the literature regarding the econometric procedures when testing the EKC hypothesis or when attempting to identify the turning point. Some study use panel data (Dinda et al. (2000)) while others use time series data (De Bruyn et al. (1998)). Likewise, some study use logarithmic form (Panayotou (1993)) while others do not (Wang (2013)). Some authors add a cubic term of income in order to allow for more flexibility (potential N shaped form) (Torras and Boyce, 1998), others choose completely different functional forms such as non parameters functions or non polynomial functional forms (Begun and Eicher (2007)). The choice of the econometric procedure is an important issue since it can affect results (Harbaugh et al., 2002).
We decide to present a snapshot of the publications that were published in ISI Web of Knowledge in 2012 and 2013. Contrary to other past reviews (Borghesi, 1999; Dinda, 2004; He, 2007; Lieb, 2004; Stern, 2004), we provide a systematic review of publications because it allows for replication and also possible future extension of the database. To this end, we
will provide the selection rule as well as the final database. Furthermore, we focus on the carbon dioxide (CO2) because (i) most of the past studies focused on CO2 and (ii) the recent
report of the Intergovernmental Panel on Climate Change (IPCC), stresses the need to better understand the relationship between environment and growth so as to limit global warming. Finally, we only report the most recent studies since state of the art tends to change over time.
Our systematic review might interest readers testing the Environmental Kuznets Curve in the near future who might want to know the most recent econometric procedures and methodology. Furthermore, readers interested in the existence or not of environmental Kuznets curve (or its shape) in a given country or area might want to know the most recent empirical studies since what was true in the past might no longer hold. Finally, it may help to perform a meta-analysis. So far, very few attempts have been made (Cavlovic et al., 2000; Goldman, 2012; Hui et al., 2007). A possible reason is that meta-analysis requires a high level of precision regarding the econometric procedure and methodology used in the selected studies. The rest of the paper is organized as follows: Section 2 details the construction of the database, section 3 presents the database, and section 4 provides a discussion.
2 Methods
We used the ISI Web of Knowledge because it involves a large number of high quality journals. First, we entered the following criteria in ISI: 1) the topic2 is “Environmental Kuznets Curve” or “Kuznets Environmental Curve”, 2) the manuscript is published in 2012 or 2013, 3) the manuscript is an “article”, 4) the article is published in one of the following ISI libraries: Science Citation Index Expanded EXPANDED), Science Citation Index Expanded (SCI-EXPANDED) and Arts and Humanities Citation Index (A&HCI), and 5) the journal is classified
2
in one of the following fields: “economics”, “environmental studies” and “environmental science”. We obtained 111 articles. Then, we browsed the articles to retain only those with an empirical application dealing with CO2. In total, we obtained a sample of 41 studies, after
excluding 60 studies that dealt with other environmental pressure indicators (i.e. deforestation, water pollution, biodiversity, SO2, NOX, land degradation, Suspended
Particulate Matter, Ecological Footprint, wastes, pesticides, etc.) or that were poorly related to the ECK. We also removed 10 studies providing a review of literature, a meta-analysis or a theoretical model.
3 Results
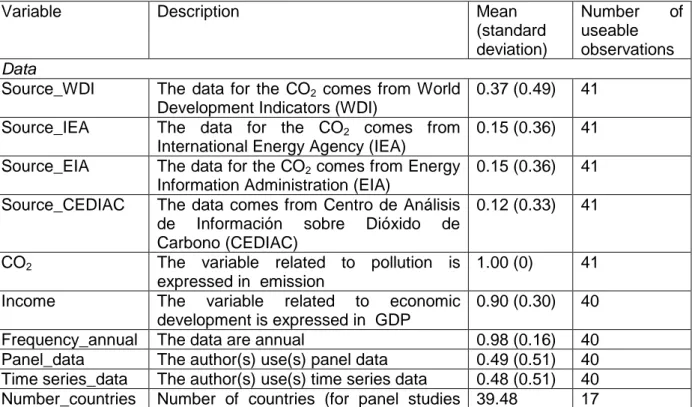
The database is available at this link [ https://docs.google.com/spreadsheets/d/1yw96x0Qkizz86B9jA595P6gxU-1JyoI2NBBpdKl517g/edit?usp=sharing] which is composed of 41 observations. The main variables are described in Table 1.
Table 1 Main variables of the review
Variable Description Mean
(standard deviation) Number of useable observations Data
Source_WDI The data for the CO2 comes from World
Development Indicators (WDI)
0.37 (0.49) 41 Source_IEA The data for the CO2 comes from
International Energy Agency (IEA)
0.15 (0.36) 41 Source_EIA The data for the CO2 comes from Energy
Information Administration (EIA)
0.15 (0.36) 41 Source_CEDIAC The data comes from Centro de Análisis
de Información sobre Dióxido de Carbono (CEDIAC)
0.12 (0.33) 41
CO2 The variable related to pollution is
expressed in emission
1.00 (0) 41
Income The variable related to economic
development is expressed in GDP
0.90 (0.30) 40
Frequency_annual The data are annual 0.98 (0.16) 40
Panel_data The author(s) use(s) panel data 0.49 (0.51) 40
Time series_data The author(s) use(s) time series data 0.48 (0.51) 40 Number_countries Number of countries (for panel studies 39.48 17
only) (43.06)
Time_Span Number of years 44.73
(39.37)
39
Functional form
log_log Both the dependent variable (GDP) and the independent variable (CO2) are
expressed in logarithm
0.75 (0.44) 41
GDP GDP is included linearly in the model 0.22 (0.42) 41
GDP^2 GDP and GDP^2 are included in the
model
0.40 (0.50) 41
GDP^3 GDP, GDP^2 and GDP^3 are included in
the model
0.13 (0.33) 41
Econometrical procedure
Stationarity analysis
Stationarity analysis is performed 0.68 (0.47) 40 Long run analysis Long run analysis is performed 0.61 (0.49) 41 Causality analysis Causality analysis is performed 0.25 (0.44) 40
Outcome
Evidence_CEK Evidence of CEK is found 0.23 (0.43) 30
Figure 1 shows that a sizeable part of the 41 articles are published in economic modelling energy policy and energy economics. Figure 2 shows that studies have been performed in many areas of the world, but few applications have been made in Africa.
Figure 1 Journals ECONOMIC MODELLING 12% ENERGY POLICY 32% ENERGY ECONOMICS 15% OTHER 41%
Figure 2 Countries involved in the studies
Note: The countries involved in the studies are in green
4 Discussion
4.1 Data
We focus on studies which use CO2 data to proxy the environmental degradation. Four main
sources represent about 80% of the observations: WDI for 37%, IEA for 15%, EIA for 15% and CEDIAC for 10%. Moreover all of our studies use CO2 emissions instead of CO2
concentrations, which is standard for this pollutant. Concerning the proxy for economic development, 90% of the studies use the traditional per capita GDP (mostly expressed in term of real GDP).
It is also worth noting that about the half of the studies involves panel data, the other half uses time series data, and only one study uses cross-countries data. At the beginning of EKC field, studies mainly used panel data due to the lack of long run data.
4.2 Functional form
There is still no consensus on the question of the use of data in their logarithmic form, but nevertheless, three-quarters of the studies use logarithms. The functional form mostly used is the traditional quadratic one (40%). Only 13% of our studies add the cubic term of GDP despite the fact that quadratic functional form is often criticized because it puts restrictions on
estimated coefficients. We note that 22% of the studies focus on the linear relationship between GDP and CO2 which discards the possibility of a turning point, therefore without
concluding about the existence of an EKC. On the other hand, 30% of studies choose alternative methods.
4.3 Econometrical procedure
The bias of spurious regression in case of non-stationarity has been fully discussed in past literature (Perman and Stern, 2003). This may explain why 68% of the current studies test the presence of unit root in data. Moreover, stationarity analysis allows for long run analysis which seems pertinent in the case of EKC (long term process). Besides, 61% of studies conduct long-run analysis mostly via cointegration analysis.
4.4 Outcome
In total, 23% of studies support EKC assumptions. The smallest turning point (4,700 US$) is found by Saboori et al. (2012) for Malaysia, while the highest turning point3 (32,855.55 US$) is found by Arouri et al. (2012) in a study that involved twelve countries of Middle East and North African (MENA) countries.
5 Conclusion
In this paper, we provided a detailed review of the empirical articles dealing with CO2 that
were published in 2012 and 2013 in ISI Web of Knowledge. Our review, which is based on 41 studies, reported many information, such as the outcome of the study or the econometric procedure employed. We found that more than 60% of studies analyze the potential presence of unit root and conduct long-run analysis. However, functional forms are still
3
traditional ones (linear, quadratic or cubic) for about two thirds of these studies. Only few studies support EKC assumptions, which is coherent with previous literature.
Bibliography
Arouri, M.E.H., Ben Youssef, A., M'henni, H., Rault, C. (2012). Energy consumption, economic growth and CO2 emissions in Middle East and North African countries. Energy
Policy, 45, 342-349.
Begun, J., Eicher, T.S. (2007). In search of a sulphur dioxide Environmental Kuznets Curve: A bayesian model averaging approach. Working Paper no. 79, Center for Statistics and the Social Sciences, University of Washington.
Borghesi, S. (1999). The environmental Kuznets curve: A survey of the literature. 85, Fondazione Eni Enrico Mattei.
Cavlovic, T.A., Baker, K.H., Berrens, R.P., Gawande, K. (2000). A meta-analysis of environmental Kuznets curve studies. Agricultural and Resource Economics Review, 29, 32-42.
De Bruyn, S.M., Van den Bergh, J.C.J.M., Opschoor, J.B. (1998). Economic growth and emissions: Reconsidering the empirical basis of Environmental Kuznets Curves. Ecological Economics, 25, 161-175.
Dinda, S., Coondoo, D., Pal, M. (2000). Air quality and economic growth: An empirical study. Ecological Economics, 34, 409-423.
Dinda, S. (2004). Environmental Kuznets Curve hypothesis: A survey.Ecological Economics 49, 431-455.
Goldman, B. (2012). Meta-analysis of environmental Kuznets curve studies: determining the cause of the curve’s presence.
Grossman, G.M., Krueger, A.B. (1991). Environmental impacts of a North American Free Trade Agreement. Working Paper 3914, NBER.
Harbaugh, W., Levinson, A., Wilson, D.M. (2002). Reexamining the empirical evidence for an Environmental Kuznets Curve. Review of Economics and Statistics, 84, 541-551.
He, J. (2007). Is the Environmental Kuznets Curve hypothesis valid for developing countries? A survey. (No. 07-03).
Hui, L., Grijalva, T., Berrens, R.P. (2007) Economic growth and environmental quality: a meta-analysis of environmental Kuznets curve studies. Economics Bulletin, 17, 1-11.
Lieb, C.M. (2004). The environmental Kuznets curve and flow versus stock pollution: the neglect of future damages. Environmental and Resource Economics, 29, 483-506.
Saboori, B., Sulaiman, J., Mohd, S. (2012). Economic growth and CO2 emissions in
Malaysia: A cointegration analysis of the Environmental Kuznets Curve. Energy Policy, 51, 184-191.
Perman, R., Stern, D.I. (2003). Evidence from panel unit root and cointegration tests that the Environmental Kuznets Curve does not exist. The Australian Journal of Agricultural and Resource Economics, 47, 325-347.
Stern, D. I. (2004). The rise and fall of the environmental Kuznets curve. World development,
32(8), 1419-1439.
Torras, M., Boyce, J.K. (1998). Income, inequality, and pollution: A reassessment of the Environmental Kuznets Curve. Ecological Economics, 25, 147-160.
Wang, Y. (2013) Functional sensitivity of testing the environmental Kuznets curve hypothesis. Resource and Energy Economics, 35, 451-466.