Study by Hall probe mapping of the trapped flux modification produced by
local heating in YBCO HTS bulks for different surface/volume ratios
Ph Laurent1, J-P Mathieu2, B Mattivi1, J-F Fagnard1, S Meslin3, J G Noudem3, M Ausloos4, R Cloots2 and Ph Vanderbemden1
1 SUPRATECS, Department of Electrical Engineering and Computer Science B28, University of Liège, Sart-Tilman, B-4000 Liège, Belgium 2 SUPRATECS, Chemistry Institute B6, University of Liège, Sart-Tilman, B-4000 Liège, Belgium
3
CRISMAT-ENSICAEN, CNRS/UMR 6508, 6 Boulevard du Maréchal Juin, F-14050 CAEN Cedex, France 4 SUPRATECS, Physics Institute B5, University of Liège, Sart-Tilman, B-4000 Liège, Belgium
Abstract
The aim of this report is to compare the trapped field distribution under a local heating created at the sample edge for different sample morphologies. Hall probe mappings of the magnetic induction trapped in YBCO bulk samples maintained out of thermal equilibrium were performed on YBCO bulk single domains, YBCO single domains with regularly spaced hole arrays, and YBCO superconducting foams. The capability of heat draining was quantified by two criteria: the average induction B decay and the size of the thermally affected zone caused
by a local heating of the sample. Among the three investigated sample shapes, the drilled single domain displays a trapped induction which is weakly affected by the local heating while displaying a high trapped field. Finally, a simple numerical modelling of the heat flux spreading into a drilled sample is used to suggest some design rules about the hole configuration and their size.
1. Introduction
Bulk high temperature superconductors (HTSs) can be used in engineering applications as permanent magnets [1, 2]. At present, the most promising materials are bulk (RE)BCO single domains (where RE denotes a rare earth element such as Y, Dy, Nd...), for which trapped induction values exceeding 15 T have been successfully demonstrated by various laboratories [3], Such trapped fields suggest that single-domain HTSs may replace permanent magnets in the rotor of an AC rotating machine in order to achieve a high torque [1, 4]. The most common characterization technique of such samples consists in mapping the sample top surface with a miniature Hall probe [5-9]. In such a measurement, the sample is always kept at a uniform temperature. In real
applications, however, the temperature of the bulk material is rarely homogeneous.
In the case of a bulk HTS used as a permanent magnet in a rotating machine, the superconductor is often
subjected to a variable magnetic field, e.g. caused by variations of the applied torque on the shaft [10]. Similarly, when superconductors are used in magnetic bearings, the vibration or the irregular magnetization of the
permanent magnet can result in a time-varying magnetic induction [11-14]. This causes vortex motions and heat dissipation inside the material [15].
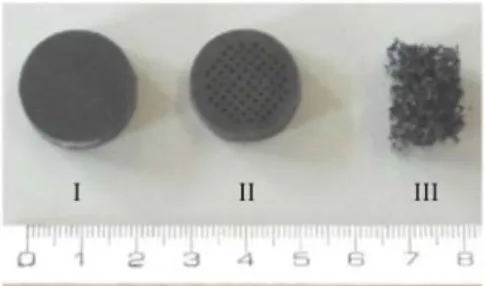
Figure 1: From left to right, photographs of the plain sample (I), the drilled sample (II), and the foam sample (III).
In applications, the superconducting material must show a good ability to evacuate the heat produced inside the material since any increase of the local temperature may severely degrade the superconducting properties. This study aims at comparing the influence of local heating on the trapped field response of various samples with different morphologies: (i) YBCO bulk single domains, (ii) YBCO single domains with artificially patterned columnar holes, and (iii) YBCO superconducting 'foams', i.e. samples with the macroscopic shape of bulk materials but revealing struts with a thickness of a few tenths of a micron. The three studied morphologies are characterized by an increasing surface/volume ratio. In addition to facilitating the oxygen diffusion throughout the material during annealing [16], a large exchanging surface should be beneficial in terms of thermal shock resistance and heat draining. It is therefore of interest to study heat exchange effects through the HTS surface, in particular under conditions similar to those met under field stress, i.e. in the vortex state.
In order to compare the heat draining between the superconducting matrix and the cryogenic coolant, Hall probe mapping was carried out in the presence of an artificial local heating. Since superconducting properties are strongly linked to the sample temperature, the analysis of the trapped flux in the presence of a local heating reflects the temperature distribution inside the material. In the steady state, the heat flux injected into the sample is in equilibrium with the heat flux exchanged between the sample and the cryogenic coolant, resulting in a time independent temperature distribution. Since the three kinds of investigated samples are constituted of the same YBCO phase, the materials themselves—independently of the differences between their exchange surfaces with the liquid nitrogen—are supposed to be characterized by very similar thermal conductivity values. Since the heat flux injected into the sample is kept constant for all experiments, the differences between the temperature and magnetic flux distributions of each sample are thought to be specifically representative of the material exchange surface with the cryogenic coolant.
2. Experimental details
2.1. Sample preparation
The standard Y-Ba-Cu-0 bulk single domains (I) were produced by the top-seeded melt-textured growth process (TSMTG) through a synthesis process detailed elsewhere [17]. The as-obtained single domain does not exhibit macrocracks or other visible defects.
Table 1: Geometrical and physical characteristics of the samples.
Plain sample Drilled sample Foam
Material YBCO YBCO YBCO
Shape Cylinder Cylinder Parallelipipedic
Top surface (mm2) 337 338 194
Height (mm) 7 7 8
Density 6.1 6.2 6.0
Weight/overall volume
ratio (kg dm-3) 6.1 5.6 2.5
Single domains with artificially patterned holes (II) were produced by TSMTG from a drilled preform [16]. The YBCO mixture (YBa2Cu3O6-d (Y-123) + 25 mol% Y2BaCuO5 (Y-211) + 0.5 wt% CeO2 + 0.25 wt% SnO2) was uniaxially pelletized in a cylindrical form, 24 mm in diameter. The pellet was sintered at 920 °C for 12 h in order to make it denser and stronger. The sintered pellet was mechanically drilled parallel to the c-axis; each hole diameter is 1 mm; the holes are arranged in a regular squared pattern (spacing = 1.5 mm). The single-domain growth proceeds by TSMTG starting from a Sm1.8Ba2.4Cu2.4Ox single-grain seed placed on the top and at the
centre of the drilled pellet. After the thermal treatment as in [14], the sample was annealed in flowing oxygen at 430 °C for 150 h. The dimensions of the final sample are smaller than those of the initial pellet due to the shrinkage occurring during the texturing. After polishing, some macrocracks starting from the holes are visible on the top surface of the sample.
Y-Ba-Cu-O single-domain foams (III) were prepared by the infiltration and growth process [18]. First a polyurethane skeleton of 80 ppi (pores per inch) was coated with a Y-211 slurry. The coated structure was thermally treated in order to burn the organic compound and sinter the 211 ceramic [19]. The as-obtained Y-211 foam was infiltrated by a BaO-CuO liquid phase at a temperature slightly above the peritectic temperature of the Y-123 phase. The Y-123 crystal growth then proceeds by slow cooling from a Sm1.8Ba2.4Cu2.4Ox single-grain
seed placed on a Y2O3 cloth on top of the Y-211 foam [20]. The final sample consists of a Y-Ba-Cu-O foam characterized by an open porosity similar to that of the polyurethane foam; the strut thickness ranges from 10 to 100 µm.
For each morphology, two samples have been studied in order to estimate the data reproducibility. The differences from one morphology to another are significant. We have selected for discussion the three samples (one of each type) displaying the highest trapped field in the absence of a temperature gradient. They are shown in figure 1 and their main characteristics summarized in table 1. Notice also that the matter distribution within the foam is highly inhomogeneous. For the drilled and the foam samples, the density—measured by the Archimedes method—differs from the weight/overall volume ratio.
2.2. Measurement set-up
The main experiment consists in carrying out a miniature Hall probe mapping of the sample top surface twice. First, the sample is immersed in liquid nitrogen (T = 77 K) in the presence of a 380 mT induction produced by a copper coil. Before starting the first mapping sequence, 15 min are elapsed in order to reduce the influence of flux creep effects on the trapped field during the measurements [21]. After the first mapping, a heat flux is injected inside the sample from a heater stuck on the sample lateral surface. The thermal steady state is reached after approximately 10 min. Then, a second Hall probe mapping of the residual induction is carried out while the heat flux is kept constant.
Table 2: Trapped flux characteristics of the measured samples.
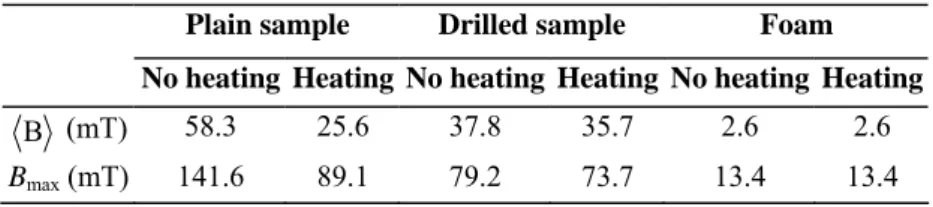
Plain sample Drilled sample Foam No heating Heating No heating Heating No heating Heating
B (mT) 58.3 25.6 37.8 35.7 2.6 2.6
Bmax (mT) 141.6 89.1 79.2 73.7 13.4 13.4
Figure 2: Left: schematic diagram of the sample holder top view. Right: blow-up around the heater location.
The parameters for each Hall probe mapping are (i) a spatial step of 0.5 mm and (ii) a distance between the sample top surface and the probe equal to 1 mm. The Arepoc™ HHP-MFO Hall probe has an active area of 0.01 mm2. In order to generate the heat flux in the sample, a 100 mA current is injected into a 1 kΩ SMD resistor (6.4 x 3.1 x 0.55 mm3) stuck to the lateral surface sample with Apiezion™ M grease; the corresponding dissipated power is equal to 10 W. The sample holder (figure 2) allows the superconductor to be clamped with four small brass screws in order to maximize the exchange surface with the liquid nitrogen bath. One of the screws is also used to hold the heater in contact with the sample. The heater is embedded within a 2 mm thick Teflon™ block in order to minimize the heat loss between the heater and the liquid nitrogen bath. Using numerical modelling, we have estimated that the heat flux penetrating into the sample exceeds 85% of the total heat flux produced by the heater.
3. Results
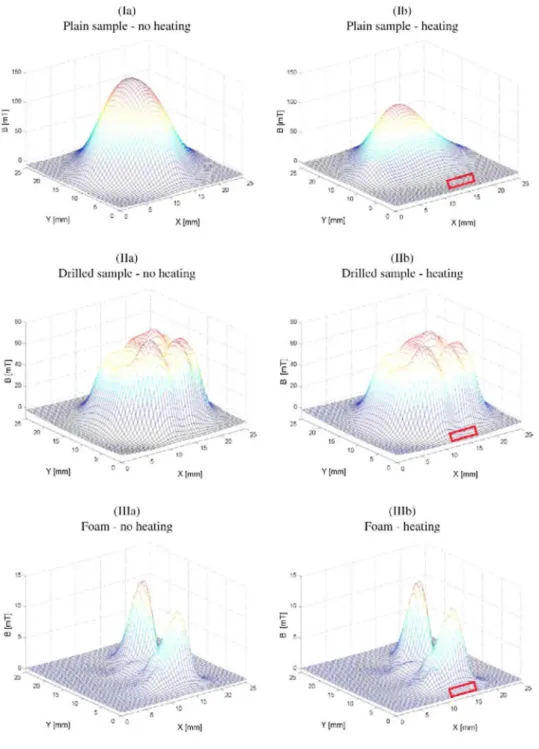
The left-hand side of figure 3 compares the initial trapped flux for the YBCO single-domain bulk (Ia), the YBCO drilled single domain (IIa), and the YBCO superconducting foam (IIIa) without any external heat flux. On the right-hand side of figure 3, the Hall flux mappings of the same samples are shown when the heater is activated. First we examine the left-hand side of figure 3. The trapped induction of the hole-free single domain (figure 3 (Ia)) displays a high axial symmetry and homogeneity, resulting in a well defined maximum. Next, the flux profile of the drilled bulk (figure 3(IIa)) exhibits several smooth maxima very close to each other and slightly emerging from a central bump. The trapped flux of the foam is rather inhomogeneous (figure 3(IIIa)) and exhibits two main peaks.
On the right-hand side of figure 3, the trapped flux profiles are shown after the 10 W heater is turned on. In the case of the plain single domain (figure 3 (Ib)) a significant induction decrease is visible in the vicinity of the heater. As can be seen in figure 3(IIb), the drilled single domain is much less affected by the heater than its hole-free counterpart, resulting in a trapped flux profile very close to that shown in figure 3(IIa). Similarly, the flux profile measured on the top surface of the foam sample in the presence of local heating (figure 3(IIIb)) does not perceptibly differ from the profile measured without heating (figure 3(IIIa)).
Table 2 summarizes the values of the maximum induction Bmax and the mean induction B averaged over the whole sample, i.e.
where S denotes the top surface area of the sample. For the plain single domain, both parameters are significantly reduced by the 10 W heat flux: as an example, the value of the average induction B is reduced from 58.3 to 25.6 mT, leading to a relative decrease exceeding 50%. Such a behaviour differs from that of the drilled sample for which the corresponding induction decrease—from 37.8 to 35.7 mT—is less than 6%. In the case of the foam, both the average and maximum values are found not to be affected by the heating procedure, within the measurement uncertainty.
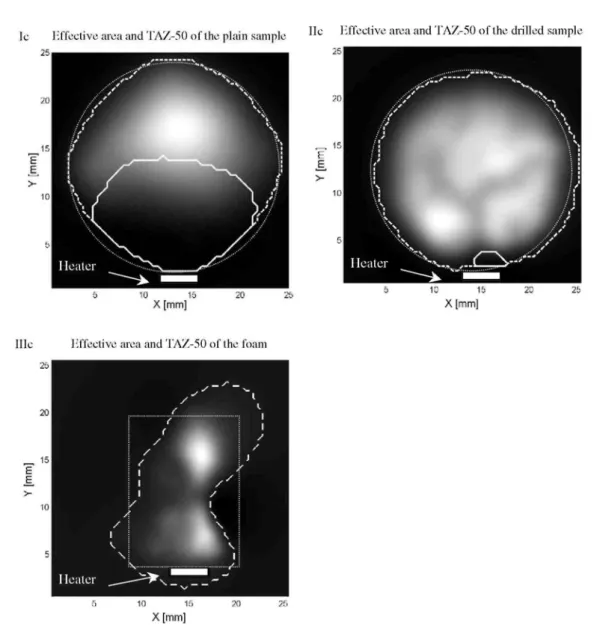
In order to quantify the interpretation of the three Hall-probe mappings with the heater, home-made software was developed in order to determine two areas. The first one, called the 'effective area', includes every point
corresponding to an induction exceeding a given threshold value; this value is chosen such that the surface of the effective area is equal to the true (geometric) sample cross-section. The effective areas of the three investigated samples are represented by a dashed contour in figure 4. As can be seen, the effective contour of the plain (Ic) and the drilled (IIc) single domains are very similar to their circular cross-section. In contrast, the 'effective' contour of the foam sample significantly differs from its rectangular cross-section (see figure 4(IIIc)). The second area represents the so-called 'thermally affected zone' and is shown by a plain line in figure 4. The thermally affected zone at x% (TAZ-x) includes each point experiencing a relative decrease of the induction exceeding x% after the heat flux is injected into the sample. The greater the x value, the smaller the TAZ-x. As an example, TAZ-100 corresponds to the smallest thermally affected zone and contains every point whose induction totally vanishes after heating. In figure 4, the chosen threshold is 50% and the TAZ-50 is delimited by a plain line. For comparison, TAZ-50 and TAZ-10 surface values are given in table 3. The thermally affected zone is always much smaller for the drilled single domain than for the hole-free sample. For the foam, any point of the sample fulfils the TAZ-50 criterion because of the finite resolution of the mapping.
Figure 3: Hall probe mappings of the trapped induction field without heating (LHS) and with heating (RHS): (I) plain sample, (II) drilled sample, and (III) foam. Maximum induction values are found in table 2. The location of the heater is represented by a rectangle.
Table 3: Surfaces of the thermally affected zones of the samples (TAZ).
Plain sample Drilled sample Foam
TAZ-50 (mm2) 140.2 4.1 Non-measurable
4. Discussion
4.1. Initial trapped flux: heater off
First we compare the results without local heating for the different samples (I), (II), and (III). The symmetry of the trapped induction of the hole-free single domain underlines the quality of the material (figure 3(Ia)). The multi-peak structure observed for the drilled sample (figure 3(IIa)) is thought to be due to the presence of a few macrocracks joining some adjacent holes. Such macrocracks were observed on the top surface of the drilled bulk before the measurement sequence. However, these cracks could have been extended by mechanical stresses during the field cooled procedure [18]. In the present case, the average Jc degradation introduced by such cracks and estimated from the maximum value of the trapped induction is less than 50%.
Figure 4: The effective area of the sample and the thermally affected zone (TAZ-50) are respectively represented by a dashed line and a continuous line for each sample. The trapped flux remaining with local heating is shown for the plain sample (I), the drilled sample (II), and the foam (III). The heater location is indicated inside the map by a rectangle. The dotted line gives the true geometry of the top surface.
The trapped flux of the foam is strongly inhomogeneous (figure 3 (IIIa)), because of the non-uniform matter repartition as well as the presence of possible grain boundaries in the sample. The two isolated peaks are expected to result from intricate percolation paths within the material and not from currents flowing parallel to the sample edges. Remarkably, however, the maximum magnetization of the highest peak exceeds 13 mT (cf table 2), although the length scale over which supercurrents flow is very small. From the results shown in figure 4, one can roughly estimate the length scale associated with the highest peak to lie around 2 mm. Since the
maximum magnetization for the 10 mm radius single domain is ~140 mT (cf table 2), a similar 2 mm radius single domain is expected to be characterized by a maximum magnetization of ~28 mT Taking into account that the current lines in the foam travel through tiny struts whose equivalent cross-sectional area is much smaller than for a plain single domain, the measured 13 mT induction suggests that the persistent currents responsible for this peak are intragranular in nature and correspond to high critical current density (Jc) values.
4.2. Residual trapped flux: heater on
Now we focus on the impact of the heater on the trapped flux. The trapped flux modification due to the local heating reflects the material ability for evacuating heat. The following parameters will be used for comparing the samples: (i) the reduction of trapped induction and (ii) the 'thermally affected zone' defined above.
For the plain single domain, the trapped induction is significantly reduced in the vicinity of the heater, resulting in a final average induction B of 25.6 mT (table 2). In contrast, the drilled sample is weakly affected by the local heating and the final average induction is 35.7 mT This demonstrates the superior performances of the drilled bulk in the presence of an inhomogeneous temperature distribution, in spite of the presence of macrocracks which reduce the intrinsic trapped flux in the absence of heating. In a similar way, the heat flux injected inside the superconducting foam does not penetrate deeply because of the efficient cooling due to the open porosity of the foam. Consequently, both the average and maximum values are unaffected by the heating. When comparing the thermally affected zones at 10% (TAZ-10 in table 3), the impact of the heater on the trapped flux is far higher for the whole single domain (TAZ-10 ~ 290 mm2) than for the drilled sample (TAZ-10 ~ 39 mm2). For the foam, the very small value of the TAZ-10 (~9 mm2) confirms the fact that a higher surface exchange with the cryogenic coolant is highly beneficial in reducing the thermally affected zone.
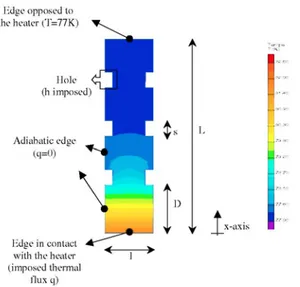
Figure 5: Schematic diagram showing the sample geometry used for numerical modelling and the temperature distribution. Thermal boundary conditions are indicated on the left.
From the above results, it turns out that drilled samples are attractive because they can show a high trapped field at the same time as being less affected by local heating.
4.3. Simulation of temperature distribution for several hole configurations
In order to determine the relevant parameters affecting the steady temperature distribution in the drilled sample, a 2D numerical modelling of the heat flux in the sample containing a regularly spaced hole array was carried out using the Quickfield software. Two parameters are investigated: (i) the hole density and (ii) the distance
(hereafter called D) between the sample edge and the nearest hole. The kind of hole distribution pattern (square, diamond-shaped, hexagonal) is found to have little effect on the temperature distribution. Only the square pattern situation is discussed below. Holes are patterned in such a way that the closest hole to the sample perimeter is separated from the heater by a distance D.
Two simplifications are introduced: (i) the circular hole is replaced by a square with the 'same' area (the side of the square is denoted by s) and (ii) a uniaxial heat flow is assumed along the x-axis (figure 5). The studied system is thus equivalent to a bar-shaped sample of length L, side l, and thermal conductivity k.
The boundary conditions are the following: a constant heat flux q is imposed on the sample edge in contact with the heater, the lateral sides are adiabatic, and a convective exchange coefficient h is imposed on the hole walls. The modelling parameters are listed in table 4.
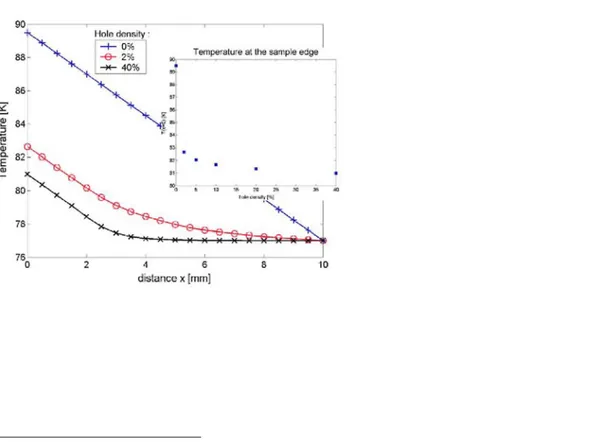
Consider the effect of the hole density d. Figure 6 shows the temperature distribution along the median line for hole density ranging between 0% (plain sample) and 40%. The inset of figure 6 shows the temperature at the sample edge as a function of the hole density d. As can be seen, a hole density of 2% is sufficient to reduce the edge temperature increase from 12.5 to 5.6 K, i.e. a reduction of 55% of the rise in temperature. A further increase of the hole does not significantly improve the sample thermal stability: a hole density of 40% corresponds to a edge temperature of 81 K, i.e. a mere 4 K increase. Such results suggest that a hole density smaller than 10% should be preferentially used. It should be kept in mind however that the efficiency of heat extraction decreases as the hole size decreases. In a very thin hole, the dissipated power may lead to creating gaseous nitrogen bubbles which in turn might drastically reduce the exchange coefficient between the hole wall and the cryogenic fluid*.
Next, consider the influence of the distance D between the sample edge and the nearest hole. Modelling results (figure 7) show that the sample temperature increases with D. This result suggests that some holes should be placed as closely as possible to the sample edge. Again, a warning is in order: it should be emphasized that each hole is a source of macrocracks. Therefore the distance between the outer holes and the sample edge should be preferentially kept above a reasonable threshold. In the case of our drilled YBCO samples, this distance is empirically found be 2.5 mm in order to avoid a fracture of the sample.
Figure 6: Temperature distribution calculated along the mid-line parallel to the sample x-axis for different hole densities: 0% (plain sample), 2% and 40%. Inset: calculated temperature at the sample edge (x = 0) for a hole density ranging from 0% to 40%.
*The boiling points of fluid in reduced dimensionalities and confined geometries are still open problems. Such a phase transition has not
Table 4: Modelling parameters used for the simulation of the temperature distribution.
Description Value Notation Fixed parameters
Sample length 10 mm L
Hole size 0.8 mm s
Thermal conductivity 4 W mK-1
k
Convective heat transfer coefficient imposed at the edge walls
3000 W m-2 K-1
h
Heat flux imposed at the edge 5000 W m-2
q
Sample width for a square pattern 2.5 mm l
Variable parameters
Distance between the sample edge and the nearest
hole Range [0.5; 2.5] mm Default = 2.5 mm D
Hole density Range [0; 40]%
Default = 10%
d
Figure 7: Temperature distribution calculated along the mid-line parallel to the sample x-axis for several values of the distance D between the sample edge and the nearest hole.
5. Conclusions
The main aim of this study is related to the understanding of the trapped field modification produced by a local heating. Three different shapes of YBCO samples were investigated: a single domain, a single domain with artificially patterned holes, and a superconducting foam.
Two main criteria were highlighted for quantify the sensitivity to local heating: the average induction B decay and the size of the thermally affected zone caused by a local heating of the sample. These criteria point out that the foam is the least affected by local heating. However, in spite of acceptable trapped flux values over small parts of the foam, large volume superconducting foams, even though they are the better solution for facing local heating, show an overall trapped flux too small for engineering applications. On the other hand, the highest trapped induction is achieved for the plain single domain but the remnant induction is very sensitive to local heating. The best compromise seems to be drilled single domains, which display simultaneously a satisfying trapped flux and a weak sensitivity to a local temperature increase.
Using a simple numerical modelling of the temperature distribution in the steady state in a drilled sample, the following design rules can be drawn. First, the kind of hole pattern (square, diamond-shaped, hexagonal) has little effect on the temperature distribution. Second, when the main source of heating is located at the sample edge—e.g. when the heating is caused by vortex motion—the holes should be placed as near as possible to the edge. Finally, as far as thermal stability problems are concerned, a hole density exceeding 10% does not lead to a
significant decrease of the sample temperature. It should be kept in mind that the hole density and configuration are likely to affect the current and magnetic flux density distribution. The optimal surface/volume ratio has to result from a compromise between the sample thermal stability and the maximum trapped flux.
Acknowledgments
Part of this work at SUPRATECS was financially supported through the 'Région Wallonne' under contract no RW01 14881 for the University of Liège.
Material preparation and microstructural characterizations are part of the doctorate thesis of J-PM who thanks FRIA (Fonds pour la Formation a la Recherche dans l'Industrie et dans l'Agriculture), Brussels, for financial support.
SM is grateful to the 'Ministère français de la Recherche et de la Technologie' for a PhD fellowship.
The authors also thank the European Supermachines Network (HPRN-CT-2000-0036) for financial support and their members for several comments.
References
[1] Campbell A M and Cardwell D A 1997 Cryogenics 37 567
[2] Yamachi N, Nishikawa T, Tomita M, Sawa K and Murakami M 2002 Physica C 378-381 877
[3] Krabbes G, Fuchs G, Verges P, Diko P, Stöver G and Grass S 2002 Physica C 378-381 636
[4] McCulloch M D and Dew-Hughes D 1998 Mater. Sci. Eng. B 53 211
[5] Chen I G, Liu J, Weinstein R and Lau K 1992 J. Appl. Phys. 72 1013
[6] Jiang X H, Astill D M, Lo W, Cardwell D A, Coombs T A, Campbell A M and Larsen J G 1995 Physica C 249 171
[7] Higuchi T, Sakai N, Murakami M and Hashimoto M 1995 IEEE Trans. Appl. Supercond. 5 1818
[8] Zhang Y H, Parikh A and Salama K 1997 IEEE Trans. Appl. Supercond. 7 1787
[9] Nagashima K, Takebayashi S, Higuchi T, Yoo S I, Fujimoto H and Murakami M 1996 Proc. 8th Int. Workshop on Critical Currents in
Superconductors (Japan: World Scientific) p 403
[10] Tsuboi Y and Ohsaki H 2001 Physica C 357-360 889
[11] Hikihara T and Moon F C 1995 Physica C 250 121
[12] Zeisberger M and Gawalek W 1998 Mater. Sci. Eng. B 53 193
[13] Coombs T A, Campbell A M, Ganney I, Lo W, Twardowski T and Dawson B 1998 Mater. Sci. Eng. B 53 193
[14] Takase K, Shindo S, Demachi K and Miya K 2001 J. Mater. Process. Technol. 108 152
[15] Tsukamoto O, Yamagishi K, Ogawa J, Murakami M and Tomita M 2005 J. Mater. Technol. 161 52-7
[16] Noudem J G, Meslin S, Harnois C, Chateigner D and Chaud X 2004 Supercond. Sci. Technol. 17 931
[17] Mathieu J P, Cano I G, Koutzarova T, Rulmont A, Vanderbemden Ph, Dew-Hughes D, Ausloos M and Cloots R 2004 Supercond. Sci.
Technol. 17 169
[18] Mathieu J P, Koutzarova T, Rulmont A, Fagnard J F, Laurent P, Mattivi B, Vanderbemden Ph, Ausloos M and Cloots R 2005
Supercond. Sci. Technol. 18 136
[19] Reddy E S, Herweg M and Schmitz G J 2003 Supercond. Sci. Technol. 16 608
[20] Reddy E S and Schmitz G J 2002 Supercond. Sci. Technol. 15 L21