Understanding Position Transducer Technology for Strength and
Conditioning Practitioners
Nigel K. Harris, PhD,1 John Cronin, PhD,1,2 Kristie-Lee Taylor,2,3 Jidovtseff Boris, PhD,4,1 and Jeremy Sheppard, PhD3
1 Sport Performance Research Institute New Zealand, AUT University, Auckland, New Zealand; 2
School of Exercise, Biomedical and Health Sciences, Edith Cowan University, Joondalup, Western Australia, Australia; 3
Physiology Department, Australian Institute of Sport, Belconnen, Australia; and 4 Sports Science Department, University of Liège, Allée des sports, Liège, Belgium
SUMMARY
Strength and power assessments in conditioning practice have typically involved rudimentary measures such as 1 repetition maximum. More complex laboratory analysis has been available but because of the price and
portability of equipment, such analysis remained impractical to most practitioners. Recently, a number of devices have become available that are reasonably inexpensive and portable and offer a great deal of information that can be used to guide programming and training to better effect. One such device is the linear position transducer. This article discusses this piece of technology from its design to how it may be used to inform practice. KEYWORDS: power assessment ; strength testing ; force profiling ; power profiling
INTRODUCTION
Strength and power are thought critical to many athletic tasks and simple day-to-day activities. To improve the development of these qualities, it has been proposed that 3 interrelated factors need to be addressed (1). First, the development of valid and reliable instruments to quantify changes in the expression of strength and power in movements that are relevant to successful athletic performance. Second, the mechanical and physiological determinants and adaptations that underlie strength and power development need to be identified, and finally, the successful implementation of training strategies to enhance strength and power. Clearly development in any 1 of these 3 areas is contingent on progress in the other 2. For example, the better a practitioner's assessment, the better their understanding will be of the mechanical and physiological determinants of strength and power. Better assessment should also guide programming to better effect. With the aim of improving assessment practice in mind, this article focuses on the use of linear position transducer (LPT) technology in strength and power assessment because this type of technology is becoming increasingly prevalent not only in research but also in the training environment. The aim of this article is to foster greater understanding of this technology and its applications, which will hopefully assist the reader in their mechanical and physiological appreciation of strength and power and improve strength and conditioning practice.
UNDERSTANDING POSITION TRANSDUCER TECHNOLOGY
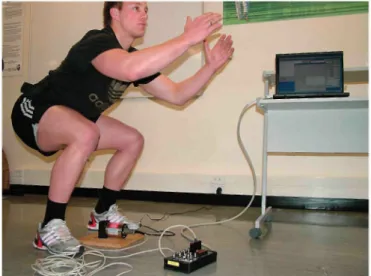
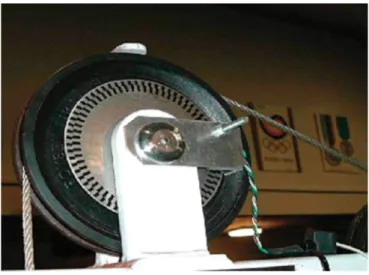
The displacement of an object can be directly measured via an LPT. A transducer is a device, usually electrical that converts a physical attribute (such as change in position of a cable) into another form (e.g, voltage) for various purposes including measurement or information transfer. Typically the LPT is connected to a personal computer via a signal conversion box (Bayonet Neill-Concelman (BNC) block). The personal computer is loaded with software that is generally available or customized for a specific use. Figure 1 illustrates an example setup. The LPT is basically composed of 4 main parts: measuring cable, spool, spring, and a rotational sensor such as a potentiometer or encoder (Figure 2). Inside the transducer's housing, a stainless steel cable is wound on a precisely machined constant diameter cylindrical spool that turns as the measuring cable reels and unreels. To maintain cable tension, a spring is coupled to the spool. The spool is coupled to the shaft of a rotational sensor (an encoder or potentiometer). As the transducer's cable extends along with the movable object, it causes the
spool and sensor shafts to rotate. The rotating shaft creates an electrical signal proportional to the cable's linear extension or velocity.
As intimated above, 2 types of rotational sensors can be used. A potentiometer is a 3-terminal resistor with a sliding contact that forms an adjustable voltage divider, producing an output voltage (Vout) that is a fraction of its
input voltage (Vin). In terms of the potentiometer, the change in voltage from one position to another is calibrated
with the change in displacement associated with that voltage change.
The second type of rotational sensor that is commonly used in the strength and conditioning fraternity is a linear or rotary encoder. A linear encoder is a sensor, paired with a scale that encodes position. The sensor reads the scale to convert the encoded position into an analog or digital signal, which can then be decoded into position by a digital readout. A rotary encoder is an electromechanical device used to convert the angular position of a shaft or axle to an analog or digital code. An example of a rotary encoder is shown in Figure 2, where a metal disc containing a set of concentric rings of openings is affixed to the pulley of a seated row machine. A light source and photodetector array read the optical pattern that result from the disc's position at any one time. To
summarize, a rotary encoder is similar to a linear encoder but measures rotational position, rather than in a straight line.
Figure 1. Example linear position transducer (LPT) setup. The athlete performs a jump with LPT attached to waistbelt. LPT (Unimeasure, Corvallis, OR) connected to laptop via Bayonet Neill-Concelman (BNC) block.
FACTORS TO CONSIDER WHEN PURCHASING A LINEAR POSITION TRANSDUCER Resolution refers to the smallest change that can be detected by a transducer. It has been suggested that for human power output testing, a minimum resolution of 1/10 of 1% of full scale is required (14). Both the LPTs shown in the Table satisfy these resolution requirements. In terms of measurement range, the reader needs to be aware of the distances that they intend measuring and then buy an LPT accordingly. For example, we have had a 50-m LPT constructed for measuring sprint ability. For most weightlifting movements, 3.5-m cables would be adequate, but always base your purchase/construction on the tallest athlete that you are likely to assess in an overhead lift. Accuracy refers to the maximum amount that the correct output from the LPT deviates from the actual output, the standards similar to resolution. As can be observed in the Table, both transducers are similar in this regard and fulfill the required accuracy requirements. Temperature can affect the accuracy of the output, that is, changes may be because of temperature rather than actual changes in the measured parameter. The large thermal ranges that both LPTs can work within without the need of special temperature compensatory circuitry are shown in the Table. The Table also shows the excitation voltage ranges over which the transducers can operate. This excitation output is dependent on the power source, with lower voltage requirements enabling the use of batteries instead of alternating circuit (AC) power.
DATA COLLECTION AND ANALYSIS
For measuring jump height and related variables, the LPT cable is attached to a bar, for example (3,19,35), weight stack (8), or attached to the subject's waist (7), allowing displacement-time data to be collected. Sampling rate
Most devices such as the LPT sample and record data at regular periods throughout the measurement period of interest. The number of samples or data points collected every second is known as the sampling frequency or sampling rate and is usually recorded as hertz (Hz), for example, 500 Hz means that 500 data points were collected in each second of the movement of interest. During the analysis of movement, it is important to be able to record changes in key variables over a period. That is, if we use a slow sampling rate (25 Hz) for a very fast movement, it is quite likely that we miss some very important peaks and troughs in the movement. In this diagram, we note that the peak (e.g., velocity or force) occurs between 2 samples, and therefore, if the peak value was an important determinant of performance or variable to measure, this sampling rate would not have captured the true peak value.
Before starting any monitoring or analysis of athletic performance, it is important to give some thought as to the ideal sampling frequency that should be used. This is usually done by applying the sampling theorem. Interested readers may want to read more about the sampling theorem, which is sometimes called the Nyquist-Shannon sampling theorem or the Whittaker-Nyquist-Kotelnikov-Shannon sampling theorem after the scientists credited with its development. However, for the sake of simplicity, when recording movements that strength and conditioning coaches are interested in, the minimal sampling rate should be 200 Hz and 500-1,000 Hz is desirable (20).
Figure 2. Picture of a rotary encoder attached to a pulley system.
Table : Descriptive characteristics of two makes of position transducers
Variable Celesco Unimeasure
Resolution Essentially infinite Essentially infinite
Measurement range 0-250 inches (0-6.35 m) As requested
Accuracy ±0.10 to ±0.25% full ±0.10 to ±0.25% full
Repeatability ±0.02% full ±0.015% full
Thermal effects -40 to 90°C -40 to 95°C
Differentiation
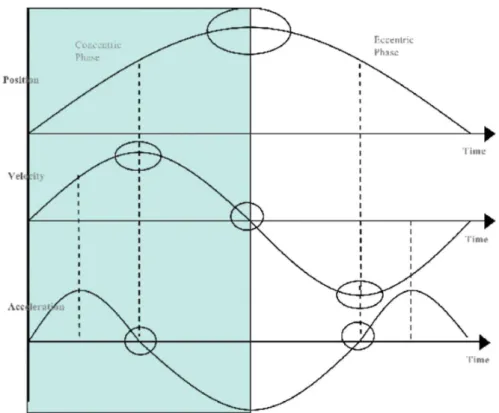
As mentioned previously, the displacement of an object can be measured with an LPT. When velocity is calculated from displacement and time [velocity = displacement (s)/time (t)] and acceleration is calculated from velocity and time [acceleration = velocity (v)/time (t)], the mathematics is called differentiation and the solution of differentiation is called the derivative. The most common method to calculate the derivative is via a method called the finite-difference technique. In practice, this is a simple method and is based on the equations for calculating average velocity (Equation 1) or average acceleration (Equation 2).
Hence, so-called "double differentiation" of displacement data permits the calculation of acceleration. The relationship between displacement, velocity and acceleration are shown in Figure 3. Once we have the acceleration curve, we can calculate all other variables of interest. It should be remembered that acceleration because of gravity and the acceleration exerted by the individual needs to be factored into the calculations. The force signal will have the exact shape as the acceleration curve, but every point on that curve will be multiplied by a scalar, that is, the subject's mass (force = mass × acceleration). For example, if a subject's mass is 100 kg, every point on the acceleration curve will be multiplied by 100. Further, multiplying the force-time and velocity-time curves allows the calculation of a power-velocity-time curve.
Filtering and smoothing
The displacement signal is made up of a "real" component and a "noise" or error component; therefore, data smoothing is needed to reduce the effect of errors. The validity of the LPT to measure force output depends greatly on the data smoothing and/or filtering procedures used during data analysis because errors are magnified when first and second derivatives (i.e., velocity and acceleration from displacement data) are calculated. That is, when finite-difference technique is implemented on the raw displacement data that contains errors, the effect of the error is magnified in the velocity calculation and magnified even further in the acceleration calculation. The errors can be reduced by applying an algorithm to smooth (or filter) the data. A common smoothing algorithm is the Hanning, also described as a "moving average" algorithm, and was used by Cronin et al. (7) to smooth LPT data with a cutoff frequency of 10 Hz. The algorithm is termed a moving average because it averages the first 3 data points (i.e., points 1, 2, and 3) and then moves on 1 point to average the next 3 data points (i.e., points 2, 3, and 4) and so on through the data set.
Filters are simply applied using software programs, some of which come with preset filtering options, and other software programs allow you to change the filter type and cut off frequencies. Simply stated, you use a filter that smoothes the signal (noise) while not altering the shape of the signal to any great magnitude, for example, substantially reducing peak values or shifting values to the right or left.
The most commonly used and versatile smoothing algorithm is the Butterworth fourth order (3,15,19). The Butterworth fourth order is often applied twice to combat the phase shift (data shifted forward in time) in the signal that naturally occurs when smoothing data. This phase shift is corrected if the algorithm is applied for a second time in the reverse direction, that is, working from the last data point to the first. This is often called a Butterworth fourth order zero-lag filter. Oversmoothing however, may induce errors that can be amplified during derivation. In fact, the use of very low cutoff frequency may alter peak values, especially for acceleration, force, and power measurement that involve a double derivate (40).
UNDERSTANDING STRENGTH AND POWER MEASUREMENT Strength and power variables
There is no doubt that if we are to improve strength and conditioning practice, we must begin instrumenting bars and machines to assess the force-time characteristics of muscle specific to the movement of interest. This practice is becoming prevalent in professional sporting organizations and regional and national sporting institutes that are charged with elite athlete development. However, the great diversity in the approaches and terminology used for studying strength and power do not make for easy understanding or comparisons across research/ laboratories and or institutions. As LPT allows the study of a myriad of strength and power-related variables, this section briefly introduces some of the issues the reader should be aware of in measurement of the strength and power variables of interest.
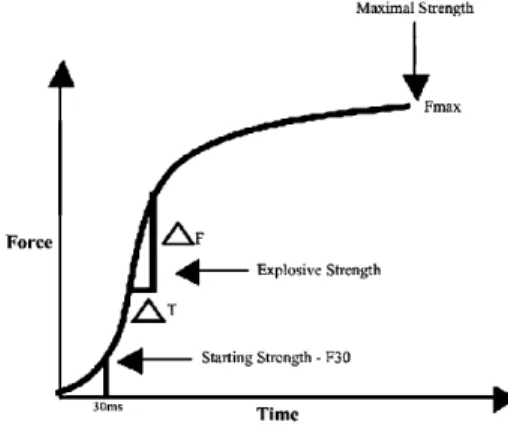
As mentioned in the previous paragraph, there is a great diversity in terminology used by practitioners and scientists; this diversity is readily apparent when studying the variety of measures used to quantify the force (strength) capability of muscle. For example, starting strength (force at 30 milliseconds, F30 ms), initial rate of force development (RFD), and S-gradient for the most part measure a similar construct but use different portions of the force-time curve (34,37,43). Zatsiorsky (43) used terms such as the index of explosive strength, reactivity coefficient, S-gradient, and A-gradient to describe various portions of the force-time curve (Figure 4). The index of explosive strength refers to the ability to exert maximal forces in minimal time. The reactivity coefficient expresses the index of explosive strength relative to body mass and is reportedly highly correlated to jumping performance, particularly with body velocity at takeoff (43). The S-gradient characterizes the RFD at the beginning phase of muscular effort, whereas the A-gradient quantifies the RFD in the late stages of muscular effort (43). Tidow (37) used different parts of the force-time curve (Figure 5) but talked to similar constructs; speed strength index = Fmax/Tmax; explosive strength was calculated as the change in force over change in time;
starting strength defined as the force in 30 milliseconds from the onset of the contraction and maximal strength as the maximum or peak force measured. Young et al. (42) used F30ms, described peak force as "maximum dynamic strength," defined explosive strength as maximum RFD, and then introduced forces and impulses in specified times.
Apart from the descriptions and the actual formulae themselves, the reliability and significance of these strength qualities and their relationships to other strength qualities or functional performance are for the most part unexplored and therefore confound understanding in this area. A comprehensive understanding of the reliability
of a measure is important to confidently interpret observed changes as those that are outside (real change) or within the typical error (TE) limits (18). This is addressed in greater detail later in this article. In addition, if it is unknown whether a measure is able to discriminate between performance levels within a sport, the importance of improving results observed in the variable is questionable. Consensus is needed as to the force-time measures of practical significance and thereafter define and use in a manner that is clear and of value to the strength and conditioning community.
Power does not seem to suffer from the same diversity of terminology that strength does. Power can be defined as the rate at which mechanical work is performed or as the product of force and velocity (1). However, the confusion and lack of understanding is still evident given that the literature dealing with the development of power tends to use terminology more commonly associated with the force-time curve rather than the power-time curve. For example, power has been associated with the ability to exert great force in a short amount of time (impulse) (17) and explosive strength or RFD (13). Newton and Kraemer (29), in considering methods to increase muscular power, devoted much of their discussion to the importance and development of RFD. Sapega and Drillings (32) in a discussion of the confusion that abounds concerning the measurement of power detail how one set of authors have calculated peak power by dividing peak torque by the duration of the contraction and 2 other studies have used initial RFD as measures of power. We need to ensure that as strength and
conditioning coaches, we have a clear understanding of kinematics and kinetics and their practical significance in assessment and programming.
Understanding the importance of kinematics and kinetics is obvious when studying the implications of the force-velocity, work-energy, and impulse-momentum relationships. For example, impulse is the product of force and time or the area under a force-time curve. Impulse seems to get very little press given its functional importance because the impulse-momentum relationship is fundamental to most movement. That is, the magnitude of the force and the time over which it acts determine the momentum (mass × velocity) of an object. As the mass of an object does not change or changes little during an event, impulse profoundly affects the velocity of an object. Given this information, it would seem logical to assess and develop impulse. However, there seems a preoccupation assessing other variables, perhaps, which may be less important than impulse.
Figure 4. Schematic of some of the force-time measures adapted from Zatsiorsky (43).
Point and curve analysis
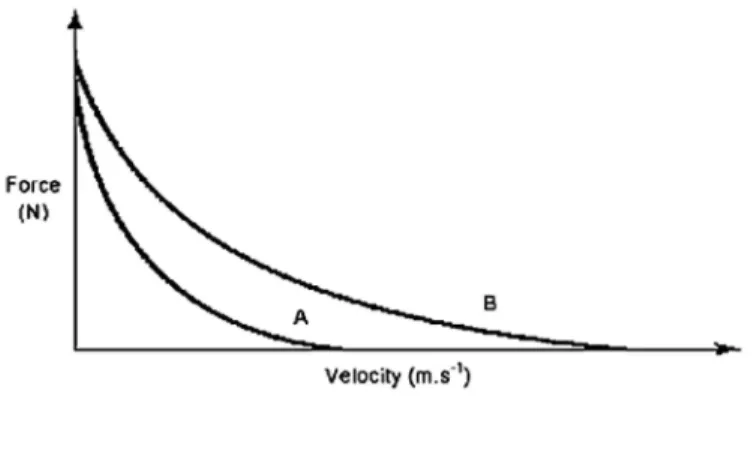
We contend that even though looking at peak values obtained during athletic movements (e.g., peak force, peak velocity, peak power, etc) may be of interest, it is possible that by using only 1 point of the movement, important information may be missed (24). For example, after a training intervention, the peak force of your athlete did not change; however his/her time to peak force decreased by 50 milliseconds, which for some athletes could be of major benefit. By monitoring the change in the shapes of the curves, you have far greater insight into the athlete's progress and your program efficacy. For example, ballistic training or training with chains might have a
rightward shift (A to B) in the force-velocity curve (Figure 6). As such, we can conclude that this type of training affected the individual's velocity capability more so than force capability of muscle.
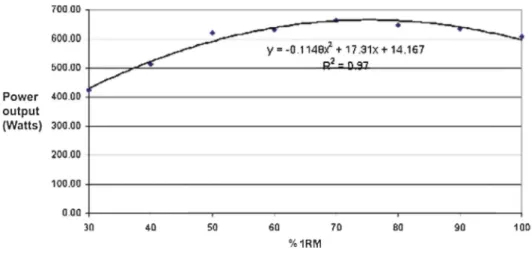
Furthermore, we can use curve analysis to predict loads that might maximize a specific adaptation. For example, to maximize power output, many believe that we should train at the load that maximizes mechanical power output (Pmax). To determine this, the mean and/or peak powers are calculated over a spectrum of loads (e.g.,
10-100% of 1 repetition maximum [1RM] or body mass) and thereafter a curve generated (16). An example of this is shown for a competitive rower in Figure 7. The load found to maximize power output of the seated row for this athlete was 75% 1RM. Other interesting information can be interpreted from the graph such as the plateau in power output across a number of loads. For this athlete, a change in 10% 1RM either side of the load that maximized power output resulted in only a 1.7% decrease in power output, perhaps indicating that identifying
Pmax may not be as important as many think, and that a bandwidth of loads can be used depending on the desired
effect, for example, velocity versus force adaptation. It should be remembered that the combination of force and velocity and the load that maximizes mechanical power output will depend on the contraction type (static versus dynamic), exercise (flexors versus extensors), the athlete, and their training status.
Figure 6. Isometric and concentric force-velocity relationship of muscle. Also depicted is a rightward shift (A to B) in the relationship.
LINEAR POSITION TRANSDUCER APPLICATIONS
Monitoring the progress of an athlete's training is an essential role of the strength and conditioning coach. The monitoring process allows the efficacy of prescribed training schedules to be evaluated and indicates whether modifications to these schedules are necessary. The LPT is easily transportable and offers a myriad of alternatives for field-based assessment of athletes. This section briefly introduces the reader to a range of potential applications for such technology.
Instant feedback
Many LPT systems now include software that provides feedback on power output in real time. For example, as an athlete progresses through a set, he/she may receive an audible signal if their power output per repetition drops below a predetermined level set by their strength coach or a previous best effort. Such feedback provides motivation to the athlete and quantifiable real-time evidence of training effort level to the coach.
Power profiling
Normative data on strength performance typically allows only a rudimentary insight into underlying neuromuscular training adaptations. For example, even if 1RM does not change significantly over a training period, velocity capabilities may still have improved at various loads. It may be that there should be less preoccupation with increasing load lifted and greater focus on moving set loads at higher velocity in the development of explosive muscular performance (15). Strength and conditioning practitioners should therefore identify how different interventions affect the power-force-velocity-load spectrum or, at the very least, monitor the velocity changes of set loads. Examination of a range of kinetic and kinematic data with the LPT provides for a detailed diagnostic and prognostic tool, allowing such an approach.
Profiling power and velocity at different loads with an LPT is also of use for intersubject comparisons. As illustrated in Figure 8, muscular power and velocity characteristics may be very different even though the athlete's 1RM scores are the same. Furthermore, if identifying the point on the load spectrum where power is maximized (Pmax) is of interest to the practitioner, LPTs also allow a quick and reliable means to determine Pmax
load (16). Practitioners may choose to identify individual and exercise-specific Pmax loads to customize training
prescription rather than arbitrarily setting homogenous group programs regardless of individual differences. Tracking change in the kinetic and kinematic variables also allows for a better understanding of contraction force and velocity-specific adaptations.
One repetition maximum prediction from submaximal loads
In settings where it is not practical or desirable to assess 1RM such as working with patients or frail individuals, monitoring change in kinetic and kinematic data at light loads may be useful. Estimation of 1RM has typically been calculated from the number of submaximal repetitions completed to failure (26,30). Recently, it has been suggested that prediction of 1RM from the submaximal load-velocity relationship may be determined (25). By measuring velocity with an LPT at 2 or 3 increasing loads, the load-velocity relationship may be estimated with a regression equation. The slope of this relationship and the intercept point with the load axis should give critical information for 1RM prediction. Jidovtseff et al. (25), using the bench press exercise, reported a correlation of 0.95 between the actual and predicted 1RM and a standard error of estimate of 3 kg. Moreover, this method allows for concurrent 1RM prediction and velocity and power profiling across a load spectrum, which is an intuitively appealing approach to assessment.
Figure 8. Example bench press power and velocity profile of 2 athletes with the same one repetition maximum.
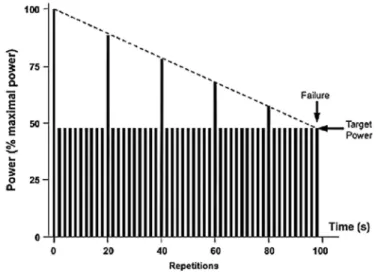
Figure 9. Example power endurance protocol with termination at 2 consecutive repetitions at <50% Pmax.
Strength and power endurance testing
The ability to maintain explosive power output during sustained dynamic exercise appears to be essential in several sports (22,41), thus requiring valid assessment and monitoring procedures. Test protocols may be customized cognizant of their respective sports-specific context. For example, Figure 9 illustrates an example protocol that necessitates maintaining a target power output until failure. In the example represented below, effort level is set at 50% of Pmax. The number of repetitions achieved until 2 or more consecutive repetitions fall
below the set power output is recorded (indicated by arrow). The protocols allow for more metabolically specific testing and training (i.e., the ability to maintain power output in a semifatigued state across a period) than the singular efforts to failure characteristic of many traditional strength and power tests.
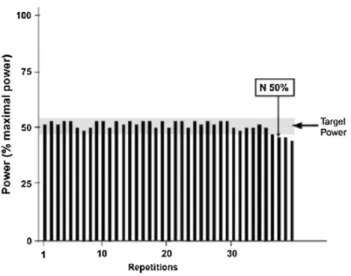
A derivation of this multiple repetition testing is using the LPT to measure decrease in bench press performance, for example, during sustained maximal exercise. The decrement in performance can be measured in 2 ways: the first consists of measuring the decrement with a fatigue index (FI), denoting how performance decreases during a given number of repetitions (Figure 10); the second consists of measuring the number of repetitions that induce a reduction in power output below a predetermined threshold. For example, N50% in Figure 10 represents the number of repetitions that have been performed before power drops below 50% of maximal power.
Yet, another derivation of this LPT multiple repetition testing is inspired by Vollestad's isometric test (39). The protocol consists of measuring how maximal performance is affected during a prolonged submaximal and standardized bout of intermittent maximal power efforts interspersed with repeated consecutive submaximal (Figure 11) repetitions (23).
Such a protocol is particularly useful for determination of fatigue profiles in repeat high-intensity intermittent sports where maintaining power output is critical.
Figure 11. Schematic representation of an intermittent multiple repetition protocol.
Analysis of temporal data
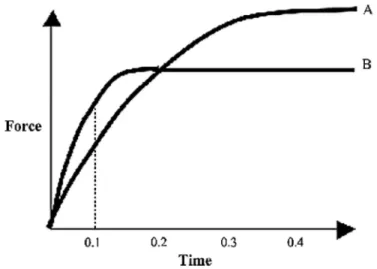
Given the theoretical importance of force and power production during the first 50-200 milliseconds to functional performance, the capacity of the LPT to determine kinetic and kinematic variables at specifically identified portions of the force curve is of great value. For example, foot contact durations during top speed sprinting are approximately 90-100 milliseconds (27). Given the force-time curves for the squat jump depicted in Figure 12, which athlete would be the better sprinter if all other determinants of sprint performance were equal? Obviously, athlete B, who can generate greater force in 100 milliseconds, despite the fact that athlete A can produce greater peak forces or maximal strength. Researchers also benefit from the ability to analyze a full range of kinetic and kinematic data in the search for meaningfully useful strength qualities.
Other applications
Typically isokinetic analysis is favored in clinical settings, for the assessment of unilateral and agonist/antagonist imbalances in patients. LPT technology may provide a more accessible and affordable tool for such analysis. However, a great deal of research is needed to develop normative data for such analysis and determine
practically/ clinically significant thresholds of asymmetry. LPT technology can also be used to measure velocity and acceleration in the horizontal plane. For example, an LPT attached to the trunk of subjects has been used to measure movement velocity during lunge performance (9).
METHODOLOGICAL CONSIDERATIONS
It can be surmised from the previous section that the LPT enables practitioners and researchers to collect information on a large range of variables associated with the expression of athletic strength and power. There are, however, a number of methodological considerations that should be addressed when collecting data using an LPT to ensure that the measured outcomes are in fact representative of an athlete's true performance capacity. Methodological considerations pertinent to all forms of assessment are reliability and validity. To enable a meaningful interpretation of test results, an assessment method or measurement technique must meet various requirements, including that it be reliable (18), that it is representative of an athlete's typical performance (28), and ideally that it conforms to results obtained from a gold standard measurement technique or method. The following sections describe the above methodological concepts in the context of the types of exercises most commonly examined with LPT technologies and considering the practical significance of the calculated outcome variables that have been previously discussed.
Reliability
Reliability refers to the reproducibility or consistency of repeated performance by the same individual. High test-retest reliability of a test or performance measure implies better precision for single measurements and is considered critical in the ability of tests to determine changes in athletic performance over time. Establishing the typical or expected variation of performance measures assists coaches and sports scientists in confidently assessing the effects of training interventions, by taking into account the changes that are likely because of the "noise" involved in the testing methods as well as typical daily biological variation present within an athlete or group of athletes. Good reliability of a measurement or performance variable is also critical for it to be considered valid.
Figure 12. Schematic of force-time curves for 2 athletes (A and B).
Limited studies have reported detailed reliability data for LPTs in isolation. Cronin et al. (7) have reported good reliability for force-related variables measured with an LPT during a coun-termovement jump (CMJ), with coefficient of variation (CV) values ranging between 2.1 and 7.4%. Hori et al. (19) similarly reported generally
acceptable trial-to-trial reliability for a range of kinematic and kinetic variables with CVs ranging from 2.5 to 11.1%. However, the study of Hori et al. (19) found that the variation for peak force was substantially higher than that observed by Cronin et al. (7) (CVs of 9.0 and 2.9%, respectively), highlighting that reliability outcomes are dependent on a number of factors within the experimental design. These factors may include technical sources of variation such as the type of equipment used, the sampling rate, and data filtering techniques. Reliability also depends on the parameter to be considered. For example, in several studies, power appears to be less reliable than velocity, not surprising because power measurement gathers the error included in the
calculation of velocity (single derivate) and the calculation of force (double derivate). Additionally, differences in the population used to obtain reliability estimates such as age, training background, familiarity with the testing techniques, and the time of day that the assessment is conducted may also influence the reliability of a test. Finally, the type of exercise, including the specifics of the testing protocols (e.g., Smith machine versus free weight exercises, concentric-only versus stretch-shortening cycle activities, and the load tested), will also be important when interpreting reliability studies. These issues will be explored in the subsequent sections. Validity
Other issues concerning athletic assessment focus on the validity of the assessments that we use. We will focus on 2 aspects of validity. First, we are interested in establishing that the assessments measure what they are supposed to measure (i.e., external or criterion validity). To determine validity in this context, we usually compare a device with a "gold standard device," which in the case of force measurement is a force platform. In addition to using an LPT to calculate force-related variables, Cronin et al. (7) simultaneously used a force platform to directly measure peak force, mean force, and time to peak force during a number of jumps. All variables were highly correlated between the 2 systems (r = 0.86-0.99) with small differences in mean force (0.1-0.4%), peak force (3.2-7.9%), and time to peak force (0.7-2.1%) observed. In addition to generating similar values for each of the above variables, the reliability statistics were also practically similar for both systems. Chiu et al. (3) reported similar findings with high correlations between LPT and force plate measurement, concluding that because the force outputs and temporal characteristics of loaded jumps were similar between both forms of measurement, the use of an LPT was a valid and reliable means of collecting force data.
To compare power-related variables between an LPT and a gold standard measurement technique, Drinkwater et al. (11) measured power during a free weight bench press, a Smith machine back squat, and a Smith machine 40-kg bench press throw using an optical encoder and cinematography (analyzed for time and position data). They concluded that there was almost no probability that true differences existed between the systems for mean and peak power. In contrast, Hori et al. (19) reported significant differences in power output values when an LPT was compared with data from a force plate. Furthermore, the reliability values between the 2 systems were substantially different for peak force, peak power, and mean power (CV = 1.8-3.6% for force platform method and 9.0-11.1% for LPT method). Hori et al. (19) also compared the reliability of the LPT and force platform with a method that used both measurement devices and calculated the variables based on direct measurement of displacement-time data from the LPT and force-time data from the force platform. They found that this method, which is commonly used in research examining the effectiveness of a variety of training interventions, also differed substantially from the force platform-only method, producing higher peak velocity and power values and greater variation. The authors recommend that practitioners be aware that the power output values calculated using these different methods are basically different quantities.
The second aspect of validity of importance in the assessment of athletic performance is ensuring that the assessment results are in fact representative of an athlete's typical performance. Bates et al. (2) stated that because variability is inherent in all human performance, the validity of using a single-performance trial for obtaining results considered representative of a generalized performance capacity is questionable. Many studies have strongly suggested that multiple trial protocols are necessary for obtaining stable results in the assessment of lower limb function in a variety of activities. For example, Rodano and Squadrone (31) reported that a 12-trial protocol was needed for establishing stable results for power outputs of the ankle, knee, and hip joints during vertical jumping. Using similar procedures, James et al. (21) indicated that a minimum of 4 and possibly as many as 8 trials should be performed to achieve performance stability of selected ground reaction force variables during landing experiments. Considering that most published research using LPTs rely on the mean or best results from a 3 to 5 trial protocol, the validity of such results may be questionable. Additionally, practitioners should be aware that it might take athletes more than the prescribed number of trials to attain maximal performance outcomes. For example, Doan et al. (10) reported that it often took trained jumpers more than 3 trials to attain maximal height. It therefore holds that the number of trials performed during assessments of maximal strength and power is a critical component of the methodological design and that it is important for practitioners to be aware of the representativeness of their results with regard to maximal or generalized athletic
performance capacities. Exercise selection
The assessment of strength and power is intuitively dependent on the type of exercise used to examine the neuromuscular qualities of interest. However, although it is important to choose an exercise appropriate for assessing the desired performance characteristics, the methodological considerations previously discussed should also be considered when the type of exercise is chosen. It is important for users to have an appreciation of how different exercise types may affect the reliability and validity of the variables of interest.
In research, LPTs have most commonly been used to assess various kinetic and kinematic variables during vertical jumping exercises or bench throws in a Smith machine. However, in the regular training environment, the kinetics and kinematics of a wide array of exercises may be of interest to the practitioner. Dependent on the purpose of the assessment, exercises common to most resistance exercises programs may be monitored and include a wide array of machine exercises (e.g., seated row or leg press), dynamic free weight exercises (e.g., bench press or back squat), ballistic movements (e.g., jump squats or bench throws), and weightlifting movements (e.g., hang power clean or clean pull). A number of factors need to be considered when measuring force- and power-related variables in these different contexts as discussed below.
Loaded versus unloaded. Although limited data are available on the reliability of LPTs used in isolation,
numerous authors have reported on the reliability of loaded jumps (CMJ or SJ) using a variety of other
equipment. In these studies, the reliability coefficients for jump height (CV = 2.1-8.3%), peak power output (CV = 3.0-9.5%), mean power (CV = 2.3-7.9), and peak velocity (CV = 2.4-7.3) were found to be consistent for adults irrespective of jump type and the load used. Only Vittasalo (38) observed greater variation in jump height as the barbell loads increased; however, this study was conducted with children with relatively little exposure to jumping under load. Therefore, apart from the above finding it seems that the reliability of CMJs and SJs are not adversely affected by the addition of loads up to 70% of 1RM.
Smith machine versus free weight exercises. It is common practice for practitioners to conduct strength and
power testing protocols using a Smith machine or similar device, with many believing that the restriction of the movement to the vertical-only plane will enhance the reliability and validity of the measurements. Recently, Shep-pard et al. (36) examined this theory and found no significant differences for a range of variables when jump squats were performed in the Smith machine or in a free weight condition. Only mean power differed with higher values recorded in the free weight condition. Additionally, they reported similar reliability between both conditions for all variables except mean power. This study was conducted however in a population of highly trained volleyball players who were very familiar with the free weight protocol. It may be that these results would not be replicated in athletes who were less proficient in this testing/training mode. It is therefore
suggested that the familiarity of the athletes with the testing protocol be considered when choosing between the above testing modes.
Inclusion of system mass
The inclusion or exclusion of body weight from power calculations is another important consideration when selecting assessment protocols and interpreting test results. That is, dependent on the type of exercise and whether the practitioner is interested in determining the power applied to the ground or to the barbell, the inclusion of body mass into the calculations may or may not be appropriate. For example, it is generally accepted that for lower-body movements, where body mass must be moved in addition to any additional external load, the resulting force, velocity, and power are determined by the athlete's ability to accelerate the total system mass (i.e., the external load + body mass) (6,12). Conversely, for upper-body exercises or static exercises (e.g., machine exercises like the leg press), the inclusion of body mass is not warranted, and the power applied to the barbell or machine is the variable of interest. However, numerous authors have failed to make this distinction, leading to discrepancies in reported power outputs in various populations.
Reliability and validity of derived variables
An early criticism of LPTs in the strength and conditioning profession was that these devices were viewed as a type of "black box technology" (33), which provided vast amounts of data that were not always interpreted with the required precision or understanding. Although relatively few comprehensive analyses of reliability of the extensive range of outcome variables obtainable from an LPT have appeared in the literature to date, the increasing prevalence of such undertakings is illustrated by the numerous abstracts presented in the past 4-5
years at the National Strength and Conditioning Association conference. Although it is beyond the scope of this article to detail these findings, readers should be aware that there could be substantial differences in reliability between derived and calculated variables. For the most part, however, it appears that during instrumented jumps, peak and mean power, peak and mean force, peak velocity, and peak displacement can be used to reliably monitor changes in performance. Time-dependent variables such as RFD and time to peak force seem to be less reliable, especially during CMJs. Weightlifting movements such as the hang power clean have been briefly investigated, with peak velocity being the only variable displaying acceptable reliability. This is likely because of the characteristics of the weightlifting movements, where the body's center of mass (COM) does not generally move in parallel with the barbell, thus violating the assumption that the movement of the barbell is representative of the movement of the COM of the entire system (19). Upper-body exercises such as the bench throw, which have been used extensively in the research literature, have suffered a lack of attention when it comes to reliability analyses.
Based on the myriad of variables available from the data collected by the LPT, it seems clear that additional research is likely required to assist practitioners in choosing variables that meet the acceptable reliability standards. Following this, further work should aim to elicit which of those variables are most practically useful in reflecting changes in athletic performance.
Accounting for extraneous movements
The use of an LPT to measure kinetic and kinematic variables during explosive athletic movements requires that certain assumptions are met. One of these assumptions during vertical jumping is that the movement examined does not involve any horizontal motion (4,5). The validity of a single LPT for measuring force and power during loaded jump squats has been questioned in the literature because some amount of horizontal displacement is likely to occur in any free weight condition. Cormie et al. (4) used a novel method for calculating such
extraneous horizontal movement during free weight jump squats (using 2 LPTs arranged in a triangular fashion above the lifter). They then compared this system of measurement with the use of a single LPT attached to one side of the barbell and found significant differences in peak velocity, peak force, and peak power. They went on to suggest that the 4-5 cm of horizontal movement that they measured throughout the jump was responsible for the differences. More recently, however, LPTs have become commercially available that incorporate a sensor near the bottom of the tether that enables the measurement of the angle that the tether leaves the spool (GymAware; Kinetic Performance Technologies, Canberra, Australia).
This allows the vertical-only displacement to be accurately measured by correcting for any horizontal movement (using basic trigonometry). Such methodology would also be useful for measuring kinetic and kinematic outcomes of a variety of exercises where there is a significant amount of movement outside the vertical plane (e.g., most weightlifting movements).
BENEFITS AND LIMITATIONS OF THE LINEAR POSITION TRANSDUCER TO THE STRENGTH AND CONDITIONING COACH
An LPT is a relatively cost-effective evaluation tool in comparison to laboratory-based equipment such as a force platform or isokinetic assessment devices. The LPT is also highly portable, and most are simple to use; therefore, the LPT can be used in multiple areas of the strength and conditioning environment. The portability of the LPT also allows the strength and conditioning coach to use an LPT as a testing and monitoring tool when traveling with teams (competition, training camps) to enhance training (e.g, through use of the training function) and to assist in decision making on training readiness of the athletes.
An LPT is particularly useful to the strength and conditioning coach, and to sport scientists, in evaluating the performance of barbell movements such as the clean, snatch, and weightlifting training movements. Because the LPT can be attached to the barbell, it can directly measure the movement and speed of the barbell itself In other words, the speed the athlete moves the barbell is directly measured. This differs from using a force plate to assess performance in these movements because the force plate collects ground reaction force (kinetic) data. Although this can be used to determine speed of movement (kinematics), these data will be valid for the kinetics and kinematics of the athlete's body and the barbell as a system, not for the work applied to the barbell itself. It should be noted, however, that data obtained from the LPT quantifying force and power relies on double differentiation from the displacement-time data. This process can reduce the validity of the estimation as discussed previously, as any error in the original differentiation is magnified when further variables are
calculations that are performed using LPT data can result in different values in comparison to data obtained directly, that is, force collected directly from a force platform. The comparison of data between athletes and studies is problematic in such circumstances. However, if the same device is used for monitoring the same athlete over time, then this limitation becomes less of an issue.
SUMMARY
Concerns regarding reliability, validity, expense, ease of administration, and portability should determine selection of the test/s and dynamometry used to assess the functional ability of an athlete. The use of LPT technology certainly addresses many of these concerns and can provide a great deal of information to the strength and conditioning coach for relatively minimal cost. LPTs can provide information regarding the assessment of training readiness to determining the efficacy of certain training programs, ergogenic aids, and recovery strategies. This technology enables so much more than the monitoring of the usual load × repetitions × sets or tonnage lifted in a session that has been common practice in the past. Macrocylces with a training emphasis on velocity of movement or power output can be monitored, thresholds for each repetition determined, and a set terminated when a substantial decrease in repetition velocity or power are observed. Hopefully, it is apparent that with the frequent and continued use of such technology by strength and conditioning coaches, assessment and monitoring strategies will improve and a more in-depth understanding of the mechanical and physiological determinants of strength and power should result; the product improved programming, subsequent strength and conditioning practice, and, ultimately, athlete development and performance.
Nigel K. Harris is a senior lecturer in Sport and Exercise Science at AUT University and a strength and conditioning coach.
John Cronin is a professor in Strength and Conditioning at AUT University and holds an adjunct professorial position at Edith Cowan University.
Kristie-Lee Taylor is currently completing her PhD at Edith Cowan University in conjunction with the Department of Physiology at the Australian Institute of Sport.
Boris Jidovtseff is senior lecturer in Strength and Conditioning at the University of Liège, Belgium, and is currently completing postdoctoral research at AUT University.
Jeremy Shep-pard is senior strength scientist and strength and conditioning coach at Queensland Academy of Sport, Australia.
REFERENCES
1. Abernethy P, Wilson G, and Logan P. Strength and power assessment: Issues, controversies and challenges. Sports Med 19: 401-417, 1995.
2. Bates B, Dufek J, and Davis H. The effect of trial size on statistical power. Med Sci Sports Exerc 24: 1059-1068, 1992.
3. Chiu L, Schilling B, Fry A, and Weiss L. Measurement of resistance exercise force expression. J Appl Biomech 20: 204-212, 2004.
4. Cormie P, Deane R, and McBride J. Methodological concerns for determining power output in the jump squat. J Strength Cond Res 21: 424-430, 2007.
5. Cormie P, McBride J, and McCaulley GO. Validation of power measurement techniques in dynamic lower body resistance exercises. J
Appl Biomech 23: 103-118, 2007.
6. Cormie P, McCaulley G, Triplett T, and McBride J. Optimal loading for maximal power output during lower-body resistance exercises.
Med Sci Sports Exerc 39: 340-349, 2007.
7. Cronin J, Hing R, and McNair PJ. Reliability and validity of a linear position transducer for measuring jump performance. J Strength
Cond Res 18: 590-593, 2004.
8. Cronin J, Jones J, and Hagstrom J. Kinematics and kinetics of the seated row and implications for conditioning. J Strength Cond Res 21: 1265-1270, 2007.
9. Cronin JB, McNair PJ, and Marshall RN. Lunge performance and its determinants. J Sports Sci 21: 49-57, 2003.
10. Doan B, Kwon Y, Newton R, Shim J, Popper E, Rogers R, Bolt L, Robertson M, and Kraemer W. Evaluation of a lower-body compression garment. J Sports Sci 21 : 601-610, 2003.
11. Drinkwater E, Galna B, McKenna M, Hunt P, and Pyne D. Validation of an optical encoder during free weight resistance movements and analysis of bench press sticking point power during fatigue. J Strength Cond Res 21: 510-51 7, 2007.
12. Dugan E, Doyle T, Humphries B, Hasson C, and Newton R. Determining the optimal load for jump squats: A review of methods and calculations. J Strength Cond Res 1 8: 668-674, 2004.
13. Haff GG and Potteiger JA. A brief review: Explosive exercise and sports performance. Strength Cond J 22: 13-20, 2001.
eds. Champaign, IL: Human Kinetics, 2006. pp. 93-118.
15. Harris N, Cronin J, Hopkins W, and Hansen K. Relationship between sprint times and the strength/power outputs of a machine squat jump. J Strength Cond Res 22: 691-698, 2008.
16. Harris NK, Cronin JB, and Hopkins WG. Power outputs of a machine squat-jump across a spectrum of loads. J Strength Cond Res 21: 1260-1264, 2007.
17. Hedrick A. Literature review: High speed resistance training. Strength Cond J 15: 22-30, 1993.
18. Hopkins W. Measures of reliability in sports medicine and science. Sports Med 30: 1-15, 2000.
19. Hori N, Newton R, Andrews W, Kawamori N, McGuigan M, and Nosaka K. Comparison of four different methods to measure power output during the hang power clean and the weighted jump squat. J Strength Cond Res 21: 314-320, 2007.
20. Hori N, Newton RU, Kawamori N, McGuigan MR, Kraemer WJ, and Nosaka K. Reliability of performance measurements derived from ground reaction force data during countermovement jump and the influence of sampling frequency J Strength Cond Res 23: 874-882, 2009.
21. James CR, Herman JA, Dufek JS, and Bates BT. Number of trials necessary to achieve performance stability of selected ground reaction force variables during landing. J Sports Sci Med 6: 126-134, 2007.
22. Jensen RL, Freedson PS, and Hamill J. The prediction of power and efficiency during near maximal rowing. Eur J Appl Physiol Occup
Physiol 73: 98-1 04, 1 996.
23. Jidovtseff B, Croisier JL, Demoulin C, and Crielaard JM. Inertial assessment: Current status and perspectives. Sci Sports 23: 107-117, 2008.
24. Jidovtseff B, Croisier JL, Scimar N, Demoulin C, Maquet D, and Crielaard JM. The ability of isoinertial assessment to monitor specific training effects. J Sports Med Phys Fitness 48: 55-64, 2008.
25. Jidovtseff B, Quièvre J, Hanon C, and Crielaard JM. Les profils musculaires inertiels permettent une définition plus précise des charges d'entraînement. Sci Sports 24: 91-96, 2009.
26. Mayhew JL, Prinster JL, Ware JS, Zimmer DL, Arabas JR, and Bemben MG. Muscular endurance repetitions to predict bench press strength in men of different training levels. J Sports Med Phys Fitness 35: 108-113, 1995.
27. Mero A and Komi PV. EMG, force, and power analysis of sprint-specific strength exercises. J Appl Biomech 10: 1-13, 1994.
28. Mullineaux D, Bartlett R, and Bennett S. Research design and statistics in biomechanics and motor control. J Sports Sci 19: 739-760, 2001.
29. Newton R and Kraemer W. Developing explosive muscular power: Implications for a mixed methods training strategy. Strength Cond J
6: 36-41, 1994.
30. Pereira Ml and Gomes PS. Muscular strength and endurance tests: Reliability and prediction of one repetition maximum-Review and new evidences. Rev Bras Med Esporte 9: 336-46, 2003.
31. Rodano R and Squadrone R. Stability of selected lower limb joint kinetic parameters during vertical jump. J Appl Biomech 18: 83-89, 2002.
32. Sapega AA and Drillings G. The definition and assessment of muscular power. J Orthop Sports Phys Ther 5: 7-19, 1983.
33. Schilling B, Weiss L, Haneishi K, Moore C, Falvo M, and Fry A. Reliability and validity of velocity and power obtained using a simple resistance exercise dynamometer. J Strength Cond Res 19: e27, 2005.
34. Schmidtbleicher D. Strength training (part two): Structural analysis of motor strength qualities and its application to training. In:
Science Periodical on Research and Technology in Sport: Physical Training/Strength W-4. September 1985. pp. 1-10.
35. Sheppard J, Cormack S, Taylor K, McGuigan M, and Newton R. Assessing the force-velocity characteristics of the leg extensors in well-trained athletes: The incremental load power profile. J Strength Cond Res 22: 1320-1326, 2008.
36. Sheppard J, Doyle T, and Taylor K. A methodological and performance comparison of free weight and Smith-machine jump-squats. J
Aust Str Cond 16: 5-9, 2008.
37. Tidow G. Aspects of strength training in athletics. New Stud Athletics 1: 93-11 0, 1990.
39. Vollestad NK. Measurement of human muscle fatigue. J Neurosci Methods 74: 219-227, 1997.
40. Winter D. Biomechanics and Motor Control of Human Movement (3rd ed). Hoboken, NJ: Wiley, 2005.
41. Yoon J. Physiological profiles of elite senior wrestlers. Sports Med 32: 225-233, 2002.
42. Young W, McLean B, and Ardagna J. Relationship between strength qualities and sprinting performance. J Sports Med Phys Fitness 35: 13-19, 1995.