HAL Id: hal-01360029
https://hal.archives-ouvertes.fr/hal-01360029
Submitted on 5 Sep 2016
HAL is a multi-disciplinary open access
archive for the deposit and dissemination of sci-entific research documents, whether they are pub-lished or not. The documents may come from teaching and research institutions in France or abroad, or from public or private research centers.
L’archive ouverte pluridisciplinaire HAL, est destinée au dépôt et à la diffusion de documents scientifiques de niveau recherche, publiés ou non, émanant des établissements d’enseignement et de recherche français ou étrangers, des laboratoires publics ou privés.
Distributed AAA framework for MANET: performance
analysis
Sondes Larafa, Maryline Laurent
To cite this version:
Sondes Larafa, Maryline Laurent. Distributed AAA framework for MANET: performance analysis. [Research Report] Dépt. Logiciels-Réseaux (Institut Mines-Télécom-Télécom SudParis); Services ré-partis, Architectures, MOdélisation, Validation, Administration des Réseaux (Institut Mines-Télécom-Télécom SudParis-CNRS). 2009, pp.34. �hal-01360029�
Distributed AAA Framework for MANET:
performance analysis
LOgiciels-R´eseaux Sondes LARAFA 09009-LOR Maryline LAURENT-MAKNAVICIUS 2009
Distributed AAA Framework for MANET: performance analysis —oOo—
Abstract
Access control AAA infrastructures are traditionally used by the service providers so as to charge their subscribers. Given the easiness and the cheapness of MANET de-ployment and provided that charging is possible, service providers are likely to offer their services over MANET. In previous works [1] and [2], we presented a distributed AAA framework for MANET. We propose to evaluate the overhead of this framework authentication protocol by modeling and simulating typical cases that are fairly repre-sentative of the reality and can easily be extended. Results show that when routes are already established, the authentication overhead is about three times smaller than the overhead due to routing. Hence the overhead doesn’t appear to be an impediment to distributed AAA infrastructures implementation.
Key-words: Mobile Ad-Hoc Networks (MANET), access control, Distributed Coordi-nation Function (DCF) basic access mechanism, modelization, simulations.
R´esum´e
Les infrastructures de contrˆole d’acc`es de type AAA sont traditionnellement utilis´ees par les prestataires de services afin de facturer leurs abonn´es. Compte tenu de la facilit´e de d´eploiement de MANET et de leur bas prix, et `a condition que la facturation des abonn´es soit possible, les prestataires de services sont susceptibles d’offrir leurs services au-dessus de MANET. Dans de pr´ec´edents travaux de recherche [1, 2], nous avons pr´esent´e une architecture AAA distribu´ee pour MANET. Nous nous proposons d’´evaluer les d´elais introduits par l’ex´ecution du protocole d’authentification de cette architecture, et cela grˆace `a la mod´elisation et `a la simulation de cas typiques qui sont assez repr´esentatifs de la r´ealit´e et qui peuvent ˆetre facilement ´etendus. Les r´esultats montrent que lorsque les routes sont d´ej`a ´etablies, le d´elai d’authentification est environ trois fois plus petit que la surcharge due au routage. Ainsi, le d´elai d’authentification ne semble pas ˆetre un obstacle `a la mise en oeuvre des infrastructures AAA distribu´ees. Mots-cl´es : R´eseaux ad-hoc, contrˆole d’acc`es, DCF, mod´eelisation, simulations.
—oOo—
Sondes LARAFA Maryline LAURENT-MAKNAVICIUS Doctorant Professeur
TELECOM & Management SudParis - D´epartement LOR - CNRS 9 rue Charles Fourier 91011 Evry Cedex
{sondes.larafa|Maryline.Maknavicius}@it-sudParis.eu
Contents
Introduction 6
1 State of the Art 8
1.1 Authentication Protocol within a MANET Distributed AAA infrastructure 8
1.2 Basic Access Mechanism of the Distributed Coordination Function . . . 10
2 Protocol Modelization for a Theoretical Evaluation of the Authentica-tion Overhead 12 2.1 Model Features . . . 14
2.2 Overhead Evaluation . . . 19
3 Protocol Simulation for a Practical Evaluation of the Authentication Overhead 21 3.1 Simulation Parameters . . . 22
3.2 Motionless Nodes Scenario . . . 22
3.3 Moving Nodes Scenario . . . 25
3.4 Protocol Performance . . . 27 4 Impact of the Computing Time Overhead within the Motionless
Sce-nario 30
List of Figures
1.1 Four-way authentication protocol . . . 9
1.2 DCF basic access mechanism: example . . . 11
2.1 Events sequence of the first message MSG1 . . . 13
2.2 Delay on a 3-hop link . . . 14
2.3 First round-trip of the authentication protocol (n = 3, hops = 3) . . . 18
2.4 Max model. On the left-hand side: overhead vs. #AAA servers. On the right-hand side: overhead vs. #hops . . . 20
3.1 Nodes placement in simulations flat-grid (n = 3, hops = 3) . . . 21
3.2 Motionless simulations. On the left-hand side: overhead vs. #AAA servers. On the right-hand side: overhead vs. #hops . . . 22
3.3 On the left-hand side: actions execution in the real case. On the right-hand side: actions execution in NS simulations . . . 23
3.4 Sum model. On the left-hand side: overhead vs. #AAA servers. On the right-hand side: overhead vs. #hops . . . 23
3.5 Trajectory of relaying nodes . . . 26
3.6 Influence of the relaying nodes movement on the network graph connected-ness. On the left-hand side: minimum distance between node 21 and nodes 11, 12 and 13. On the right-hand side: minimum distance between node 31 and nodes 21 and 22 . . . 26
4.1 Impact of the computing time on the authentication overhead for the mo-tionless scenario. On the left-hand side, in the ”max” model. On the right-hand side, with the simulation . . . 30
List of Tables
1.1 Contention window values for the three PHY specified by the 802.11 stan-dard: FHSS (Frequency-Hopping Spread Spectrum), DSSS (Direct
Se-quence Spread Spectrum), and IR (Infra-Red) . . . 10
2.1 Probability computing using the binary exponential backoff rules . . . 15
2.2 Parameter values used in the model . . . 20
Introduction
Mobile Ad-hoc Networks (MANET) are basically wireless networks where terminals are mobile and contribute themselves to the routing operations of the network. MANET are self-configuring and infrastructure-less networks, with no need for any centralized entities and operators’ management.
The easiness of deployment and the resulting financial gain are among the most in-teresting features of ad-hoc networks. Service providers and network operators are highly likely to take advantage of ad-hoc networks by providing to ad-hoc customers their or-dinary and newly-defined services. Therefore access control infrastructures (e.g. AAA: Authentication, Authorization, and Accounting) are a hot topic in this kind of networks as they will help to support subscribers charging.
In two previous articles[1] and [2], we proposed a theoretical AAA framework that allows a joining node JN to authenticate itself to a group of AAA servers in a MANET. When the authentication succeeds, the servers deliver an Access Token to the JN thanks to which the neighboring nodes can check the legitimacy of the JN, before granting access. An authentication protocol is executed between the JN and the AAA servers during the authentication phase. This protocol is located at the upper-layer of the TCP/IP stack. It is so strongly conditioned by the performance of the underlying layers. Moreover the more the number of the AAA servers increases, the bigger the number of exchanged messages is. Hence, there is an interest analyzing the overhead inherent to this protocol. This is the purpose of our report.
The report is outlined as follows. In the first chapter, we give a reminder of the distributed AAA infrastructure that we detailed in [1] and [2]. In addition we present some important features of the basic access mechanism of DCF (Distributed Coordination Function) in order to understand what follows. The two following chapters deal with the evaluation of the overhead using two methods: modelization and simulations. The second chapter is dedicated to the modelization part where we make some hypothesis to establish our model. The third chapter is dedicated to the simulations part. NS simulations led us to adjust our model and validate it thereafter. The non-modified model remains, however, more faithful to the reality and performs better than the modified model. In the third chapter, two simulation scenarios were considered, the case where nodes are motionless and the case where nodes move. Finally, the fourth chapter examines the influence of
the computing time within the nodes on the total overhead due to the authentication protocol.
1
State of the Art
AAA protocols are classically implemented in the application layer e.g. Radius [3] is an application over UDP and Diameter [4] is an application over TCP. Likely, our AAA protocol is running at the application layer over UDP. You will find an overview of this AAA authentication protocol in the section 1.1.
In order to build a model for it, we were conducted to have a closer look to the lower layers operations, especially those of the MAC layer, because the transmitted messages can be subject to collisions or to broken routes. This is addressed by the IEEE 802.11 standard [5] that provides for retransmissions by means of the Distributed Coordination Function (DCF). We were interested in the basic access mechanism which is one of the two DCF technics. It is briefly summarized in the section 1.2.
1.1
Authentication Protocol within a MANET
Dis-tributed AAA infrastructure
A centralized AAA infrastructure is traditionally composed of a AAA server, a AAA client located in a Network Access Server, and a client (a subscriber) who authenticates itself to the AAA server via the AAA client before accessing to the operator’s network. To distribute this architecture and make access control possible in ad-hoc networks, we replaced the single server by a group of AAA servers and we placed the AAA client directly into the client (subscriber) device. As such, an ad-hoc node (any node from the ad-hoc network) is either a AAA server or a AAA client. AAA clients and AAA servers form the distributed AAA framework.
An authentication protocol takes place between a AAA client, e.g. a Joining Node JN, and the group of AAA servers. Both parties authenticate themselves using RSA asymmetric cryptography. During the authentication phase, the JN connects to the AAA servers. Actually, by means of threshold cryptography ([1, 6, 7]), it requests authentication to at least a threshold number of them. The ad-hoc network may bootstrap this number by following a procedure defined by the ad-hoc network-exploiting operator. Its value can later change according to the network evolution. For the sake of simplicity, we take the threshold number equal to the number of AAA servers in this report.
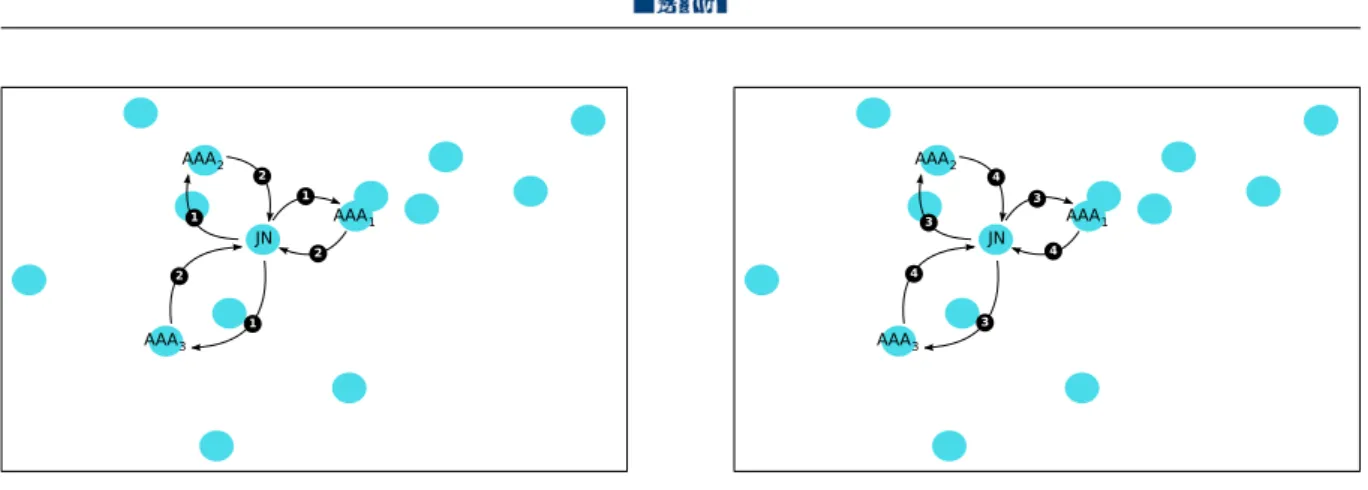
JN AAA1 AAA2 AAA3 1 2 1 1 2 2 JN AAA1 AAA2 AAA3 4 3 3 3 4 4
Figure 1.1: Four-way authentication protocol
Figure 1.1 shows the execution of the authentication protocol between a JN and three AAA servers:
(1) JN sends to each server a request for authentication that includes its identity (present in its public key certificate), MSG1: {IDJ N}.
(2) The servers respond with a challenge in the form of a random number [1], MSG2: {RAAA}.
(3) JN generates a random number RJ N. Then it signs, using its RSA private key, both
random numbers in addition to the identity of the group of AAA servers (IDAAA). Next,
it answers each server sending this signature accompanied by its public key certificate, its random number, and the identity of the AAA service, MSG3: {certJ N, RJ N, IDAAA,
SignJ N(RJ N, RAAA, IDAAA)}.
(4) If the servers succeed to decipher JN’s signature and to establish the integrity, each one of them computes a signature piece [7] using its RSA key-share [6] on both random numbers and on the identity of JN (this is one of the threshold cryptography aspects). They also generate an access token TJ N for the JN that is sent with the signature pieces
accompanied by the public key certificate of the AAA service and the identity of the JN, MSG4: {certAAA, IDJ N, SignAAA(RAAA, RJ N, IDJ N), TJ N}
These steps are inspired from the ISO-three way protocol (ISO [9798-3] [8]) that we adapted to our distributed context.
Once the JN successfully validates the integrity of the servers signature pieces (by combining them first [7]), the mutual authentication between the JN and the servers is considered as successful. JN is henceforward authorized to access the network. The legitimacy of its future traffic will be controlled by the relaying nodes before they will route it. This control will be done by checking the validity of JN’s access token.
So far, authentication and authorization have been addressed in this framework. The accounting function is not yet supported, but, as a hot topic, it will be addressed in future works.
1.2
Basic Access Mechanism of the Distributed
Co-ordination Function
As standardized by the 802.11 protocol [5], Distributed Coordination Function (DCF), a fundamental mechanism to access the medium, is based on the Carrier Sense Multiple Ac-cess with Collision Avoidance (CSMA/CA) protocol. It describes two technics to employ for packet transmission. The basic access mechanism is the default technic and it consists in a two way handshaking mechanism. The Request-to-send/Clear-to-send (RTS/CTS) mechanism is the second technic and it consists in a four-way protocol. In this report, we employed the basic access mechanism because it is more appropriate to our context since authentication packets length does not exceed 3000 bytes. RTS/CTS mechanism is rather applicable for longer packets.
Before transmitting a new packet, a node monitors the channel activity. If the channel is idle for a period of time equal to a Distributed Inter-Frame Space (DIFS), the node transmits. Otherwise, if the channel is sensed busy (either immediately or during the DIFS), the node persists to monitor the channel until it becomes idle for a DIFS. At this point, the node generates a random backoff time during which it waits before transmitting (this is the Collision Avoidance feature of the protocol), to minimize the probability of collision with packets being transmitted by the other nodes. In addition, to avoid channel capture, a node must wait a random backoff time between two consecutive new packet transmissions, even if the medium is sensed idle in the DIFS time.
For efficiency reasons, DCF employs a discrete-time backoff scale. The time imme-diately following an idle DIFS is slotted, and a node is allowed to transmit only at the beginning of each slot time. The slot time size, θ, depends on the physical layer and is set equal to the time needed at any node to detect the transmission of a packet from any other node.
Table 1.1: Contention window values for the three PHY specified by the 802.11 standard: FHSS (Frequency-Hopping Spread Spectrum), DSSS (Direct Sequence Spread Spectrum), and IR (Infra-Red)
PHY Slot Time (θ) CWmin CWmax
FHSS 50 µs 16 1024 DSSS 20 µs 32 1024 IR 8 µs 64 1024
DCF adopts binary exponential backoff rules. Before each packet transmission, a random number r is uniformly chosen in the range (0, cw − 1), and the node waits for the backoff time rθ. The value cw is called the contention window, and depends on the number of transmissions failed for the packet. At the first transmission attempt, cw is set
equal to the minimum contention window, CWmin. After each unsuccessful transmission,
cw is doubled up to a maximum value CW max = 2mCW
min. The values CWmin and
CWmax are PHY-specific and are summarized in table 1.1.
The backoff time counter is decremented as long as the channel is sensed idle, ”frozen” when a transmission is detected on the channel, and reactivated when the channel is sensed idle again for more than a DIFS. The node transmits when the backoff time reaches zero. The CSMA/CA mechanism does not rely on the capability of the nodes to detect a collision by hearing their own transmission. That is why an ACK is transmitted by the destination node to notify the successful packet reception. The ACK is immediately sent at the end of the packet reception and after a period of time called Short Inter-Frame Space (SIFS). As the SIFS is shorter than a DIFS, no other node will detect the channel idle until the end of the ACK. If the source node does not receive the ACK within a specified ACK Timeout, or if it detects the transmission of a different packet on the channel, it reschedules the packet transmission [9].
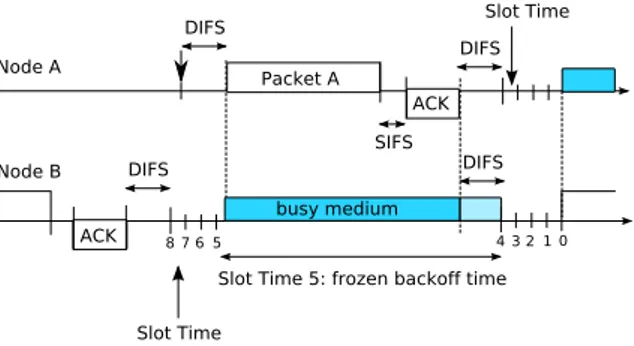
Node A Node B Packet A DIFS ACK SIFS DIFS busy medium DIFS ACK DIFS Slot Time Slot Time 5 6 7 8 43210
Slot Time 5: frozen backoff time
Figure 1.2: DCF basic access mechanism: example
Figure 1.2 illustrates the operations of the basic access mechanism. Two nodes A and B share the same wireless channel. At the end of the packet transmission, node B waits for a DIFS and then chooses a backoff time equal to 8, before transmitting the next packet. We assume that the first packet of node A arrives at the time indicated with an arrow in the figure. After a DIFS, the packet is transmitted. Note that the transmission of packet A occurs in the middle of the Slot Time corresponding to a backoff value, for node B, equal to 5. As a consequence of the channel sensed busy, the backoff time is frozen to its value 5, and the backoff counter decrements again only when the channel is sensed idle for a DIFS [9].
2
Protocol Modelization for a
Theoretical Evaluation of the
Authentication Overhead
The present chapter outlines the reasoning for building a model and computing the over-head of the authentication protocol exposed in section 1.1. It starts by analyzing the events sequence at the nodes from the construction of the first message MSG1 by the JN until its reception by one of the AAA servers, call it AAAj (cf. Figure 2.1). Once the
overhead of MSG1 with one single server is known, the reasoning simply applies to the other three messages of the protocol, MSG2, MSG3, and MSG4, and for the remaining servers, AAA1, AAA2, ..., AAAn if n is the number of servers.
Our reasoning is based on some schemes that follow the following guidelines:
1. In a static network, the routes between the nodes are considered as fixed. We will represent them by straight segments.
2. Along a given route there maybe some relay nodes. The transmission delay between two successive nodes is due to hardware and software treatment but, according to the high velocity of electromagnetic waves (3 µs/km), is quite independent from the distance between them. Hence, nodes will be represented equally spaced along the segment. The segment will appear cut into shorter segments that define the hops. The length of a route is simply the number of hops it involves.
3. Routes between the JN and the AAA servers maybe be of different lengths . As a matter of fact, we could simply consider that all the routes have the same length equal to the length of the longest one. This will give an upper bound of the delays, which is sufficient for our purpose.
4. Finally, the scheme abstracting the connections between the JN and the AAA servers appears as an equal-length star-shaped graph, which is not very accurate comparing to the real geometry of the net but sufficient for the correctness of the reasoning. In this work, computations were made by mean of the MAPLE Computer Algebra
System (CAS). We do not report all the stages of this computations but only a few significant results.
AAA Application Layer
Transport Layer (UDP)
Network Layer
Link Layer (MAC 802.11)
Physical Layer
AAA Application Layer
Transport Layer (UDP)
Network Layer
Link Layer (MAC 802.11)
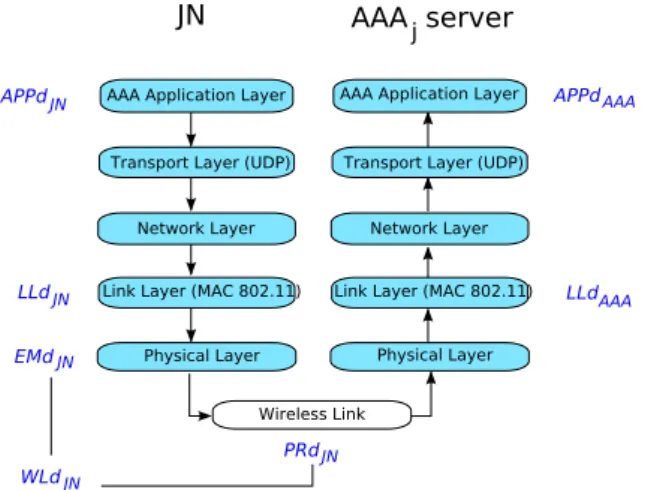
Physical Layer Wireless Link JN APPd LLd EMd PRd LLd APPd WLd AAA serverj JN JN JN JN JN AAA AAA
Figure 2.1: Events sequence of the first message MSG1
Figure 2.1 illustrates the events sequence when the JN and the server are one-hop away from each other. At the JN:
1. AAA Application Layer generates the first message containing the identity of the JN. The delay is AP P dJ N (Application delay).
2. After going through the Transport and the Network Layers, which takes a negligible time, the resulting packet enters the buffer of the Link Layer. The time spent in the Link Layer is LLdJ N (Link Layer delay).
3. During transmission on the Wireless Link, the packet might be subject to collisions or broken routes. Transmission delay (W LdJ N) has to take into account the
pos-sible packet retransmissions [5], as well as the emission delay (EM dJ N) and the
propagation delay P RdJ N. Considering the speed of electromagnetic waves in the
air, the latter is actually insignificant (about 3 µs/km) At the AAAj server:
1. Packets coming from the JN are placed in a buffer of the Link Layer. A packet is treated after LLdAAA time.
2. After going through the Network and the Transport Layers, the packet is processed by the AAA Application Layer during AP P dAAA.
Thereby, the delay d1j for the first packet generation, transmission to AAAj and
2.1
Model Features
From now, we suppose that computing operations within the nodes (so within JN and AAAj) is fast enough to neglect the delays AP P dJ N and AP P dAAA. We also suppose
that there is practically no other packets, except the authentication packets, in the Link Layers of the nodes, so LLdJ N and LLdAAA are negligible, too. Thereby:
d1j = W LdJ N
WLd1 WLd 2 WLd 3
JN AAAJ
Figure 2.2: Delay on a 3-hop link
Besides, let us consider the case where the JN and AAAj are not necessarily at one
hop from each other but at a number of hops hops = 3 (cf. Figure 2.2); and suppose that the routes are fixed once and for all between all the nodes, so between JN and AAAj (we
shall relax this hypothesis in section 3.3). Hence the relaying nodes do routing operations in a fixed time supposed equal to zero. Thus:
W LdJ N = W Ld1+ W Ld2+ W Ld3
So, if hops is any number of hops:
W LdJ N = W Ld1+ W Ld2+ ... + W Ldhops and: d1j = hops X k=1 W Ldk (2.1)
The delay W Ldkis a positive random variable having as a distribution function FW Ldk.
It takes into consideration the prospective retransmissions of a packet as described by the DCF basic access mechanism. The maximum number of retransmissions is equal to seven as defined in the IEEE 802.11 specifications [5]. If p is the probability of retransmission for a packet in the wireless channel, and X the number of retransmissions (X is a discrete random variable that covers the values of the set {1..7}), then:
P (X = i) = pi(1 − p) f or 0 ≤ i ≤ 6 P (X = 7) = p7 P (X = i) = 0 f or i ≥ 8
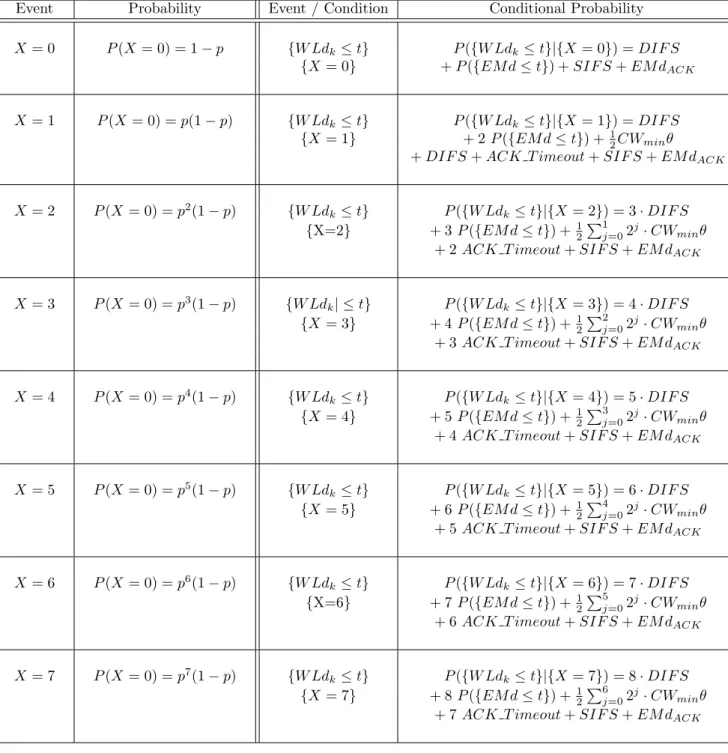
Table 2.1: Probability computing using the binary exponential backoff rules
Event Probability Event / Condition Conditional Probability
X = 0 P (X = 0) = 1 − p {W Ldk ≤ t} P ({W Ldk≤ t}|{X = 0}) = DIF S
{X = 0} + P ({EM d ≤ t}) + SIF S + EM dACK
X = 1 P (X = 0) = p(1 − p) {W Ldk ≤ t} P ({W Ldk≤ t}|{X = 1}) = DIF S
{X = 1} + 2 P ({EM d ≤ t}) +12CWminθ
+ DIF S + ACK T imeout + SIF S + EM dACK
X = 2 P (X = 0) = p2(1 − p) {W Ldk ≤ t} P ({W Ldk ≤ t}|{X = 2}) = 3 · DIF S {X=2} + 3 P ({EM d ≤ t}) +12P1
j=02 j· CW
minθ + 2 ACK T imeout + SIF S + EM dACK
X = 3 P (X = 0) = p3(1 − p) {W Ldk| ≤ t} P ({W Ldk ≤ t}|{X = 3}) = 4 · DIF S {X = 3} + 4 P ({EM d ≤ t}) +1 2 P2 j=02 j· CW minθ + 3 ACK T imeout + SIF S + EM dACK
X = 4 P (X = 0) = p4(1 − p) {W Ldk ≤ t} P ({W Ldk ≤ t}|{X = 4}) = 5 · DIF S {X = 4} + 5 P ({EM d ≤ t}) +1 2 P3 j=02 j· CW minθ + 4 ACK T imeout + SIF S + EM dACK
X = 5 P (X = 0) = p5(1 − p) {W Ld k ≤ t} P ({W Ldk ≤ t}|{X = 5}) = 6 · DIF S {X = 5} + 6 P ({EM d ≤ t}) +1 2 P4 j=02 j· CW minθ + 5 ACK T imeout + SIF S + EM dACK
X = 6 P (X = 0) = p6(1 − p) {W Ld k ≤ t} P ({W Ldk ≤ t}|{X = 6}) = 7 · DIF S {X=6} + 7 P ({EM d ≤ t}) +12P5 j=02 j· CW minθ + 6 ACK T imeout + SIF S + EM dACK
X = 7 P (X = 0) = p7(1 − p) {W Ld k ≤ t} P ({W Ldk ≤ t}|{X = 7}) = 8 · DIF S {X = 7} + 8 P ({EM d ≤ t}) +12P6 j=02 j· CW minθ + 7 ACK T imeout + SIF S + EM dACK
The Total Probability Law [10] allows to write the following formula: FW Ldk(t) = P (W Ldk ≤ t) = 7 X i=0 P ({W Ldk≤ t}|{X = i}) · P ({X = i}) (2.2)
Given the binary exponential backoff rules (cf. section 1.2) and as it is exposed in table 2.1:
P ({W Ldk ≤ t}|{X = i}) = (i + 1)DIF S + (i + 1) · P ({EM d ≤ t}) +
1 2 i−1 X j=0 2j· CWminθ
+ i ACK T imeout + SIF S + EM dACK
where DIF S, θ, SIF S, and ACK T imeout are DCF timers, CWmin is the minimum
contention window, EM dACK is the emission time of an ACK at the byte-rate of 1 Mbps
[5], and EM d the emission time of a message of l bytes at the byte-rate λ.
If we suppose that the emission time necessary to deliver one byte is a positive continu-ous random variable, following an exponential distribution with parameter λ (the average byte-rate), then the necessary mean time to deliver l bytes is l/λ. Since l indicates the length of an authentication message, l is large enough (cf. table 2.2) to apply the Central Limit Theorem [11]. Thus, the emission time of l bytes is a positive continuous random variable, EM d, following a gaussian distribution of mean l/λ and variance l/λ2 [11].
Hence, ∀i ∈ [0, 7] , W Ldk, conditionally in {X=i}, is a positive random variable
following a gaussian distribution of mean µi and variance σi2 where:
µi = (i + 1)DIF S + (i + 1) l λ+ 1 2 i−1 X j=0
2j · CWminθ + i ACK T imeout + SIF S + EM dACK
and
σ2i = (i + 1) · l λ2
Consequently, using the classical erf function [12]: FW Ldk(t) = 1 2 + 1 2 6 X i=0 pi(1 − p) · erf(1 2 √ 2(t − µi) σi ) + 1 2p 7 · erf(1 2 √ 2(t − µ7) σ7 ) (2.3) with a mean: µW Ld = 6 X i=0 pi(1 − p)µi+ p7µ7
and a variance: σ2W Ld = (−µ26+ 2µ7µ6− µ27)p 14+ (−2µ 7µ6+ 2µ26− 2µ6µ5+ 2µ7µ5)p13 + (−2µ6µ4 − 2µ7µ5+ 4µ6µ5− µ26µ 2 5 + 2µ7µ4)p12 + (−2µ7µ4 + 2µ25− 2µ6µ3− 2µ6µ5− 2µ5µ4+ 4µ6µ4+ 2µ7µ3)p11 + (−2µ7 µ3+ 2µ7µ2− 2µ6µ2+ 4µ6µ3− µ25− 2µ6µ4+ 4µ5µ4 − µ24 − 2µ5µ3)p10 + (2µ7µ1− 2µ4µ3− 2µ7µ2+ 2µ24− 2µ6µ3+ 4µ6 µ2+ 4µ5µ3− 2µ5µ2− 2µ5µ4− 2µ6µ1)p9+ (4µ4µ3− µ23+ 4 µ6µ1µ24+ 4µ5µ2− 2µ6µ0+ 2µ7µ0 − 2µ5µ3 − 2µ5µ1 − 2µ4µ2− 2µ6µ2− 2µ7µ1)p8+ (4µ6µ0σ62− 2µ6µ1− 2µ7 µ0− µ26+ µ 2 7− 2µ4µ3+ 4µ5µ1− 2µ5µ0+ 4µ4µ2− 2µ5µ2 − 2µ3µ2+ σ27+ 2µ 2 3− 2µ4µ1)p7+ (µ62− 2µ3µ1− µ25+ 4µ5 µ0+ σ62− µ23− µ22− σ52− 2µ6µ0− 2µ4µ2+ 4µ3µ2+ 4µ4 µ1− 2µ5µ1− 2µ4µ0)p6 + (σ52+ 4µ4µ0− 2µ3µ0− 2µ5µ0 − 2µ2µ1+ µ25+ 4µ3µ1− 2µ3µ2− 2µ4µ1+ 2µ22− µ 2 4− σ 2 4)p 5 + (−2µ3µ1 − µ21− µ 2 2− µ 2 3+ σ 2 4 + µ 2 4− 2µ4µ0+ 4µ2µ1− σ23 − 2µ2µ0+ 4µ3µ0)p4 + (−2µ3µ0+ 4µ2µ0+ σ32− 2µ1µ0+ 2µ21 − 2µ2µ1µ22+ µ 2 3− σ 2 2)p 3 + (−σ21 − 2µ21+ σ22+ µ22 + 4µ1 µ0− 2µ2µ0− µ20)p 2+ (σ2 1+ µ 2 1 − 2µ1µ0 + µ20σ 2 0)p + σ 2 0 µW Ld1 and σ 2
W Ld1 are independent from k because all the wireless links are assumed
identical.
Accordingly, the positive random variables {W Ldk}1≤k≤hops follow the same
probabil-ity law. Since each transmission of a packet on a specific hop is independent from the transmission of the same packet on another hop, these random variables are independent and the Central Limit Theorem [11] applies again. Hence, given the equality (2.1), d1j
follows a gaussian distribution of mean:
µd1j = hops · µW Ld1 and variance: σ2d 1j = hops · σ 2 W Ld1
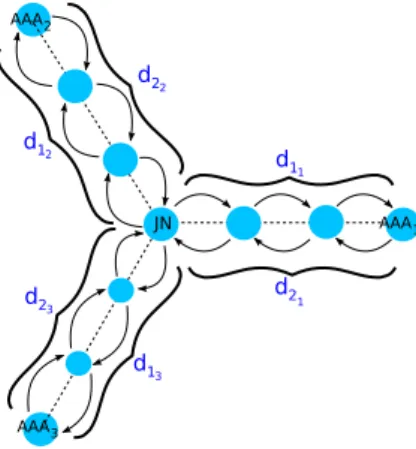
AAA1 AAA2 AAA3 JN d1 d2 1 1 d22 d12 d23 d13
Figure 2.3: First round-trip of the authentication protocol (n = 3, hops = 3) functions as d1j (only the length of their corresponding messages differs). Let d12j =
d1j+ d2j and d34j = d3j+ d4j be the delay for respectively the first and the second
round-trip of the protocol through the server AAAj, and n the number of AAA servers. The
delays {d12j}1≤j≤n (respectively {d34j}1≤j≤n) are different for each server (because the
transmissions on the links between the JN and the AAA servers can not be exactly the same for each link and at any moment), however they follow the same probability law i.e. they have the same gaussian distribution function Fd12 of mean µ12 = µd1j + µd2j
(respectively) and variance σ212= σ2d
1j + σ 2 d2j : Fd12(x) = Z x −∞ 1 √ 2πσ12 e −(t−µ12)2 2σ2 12 dt (2.4)
Also, suppose that the number of hops between the JN and each server is the same i.e. equal to hops (cf. the example of Figure 2.3 when hops = 3 and n = 3). During the first round-trip and for threshold cryptography reasons, JN has to wait for all the servers responses before triggering the second round-trip with all the servers. The total delay D12max to achieve the first round-trip with all the servers is the maximum of the
{d12j}1≤j≤n:
D12max = max{d12j}1≤j≤n (2.5)
As {d12j}1≤j≤n follow the same probability law, the distribution function of D12max is:
FD12max = (Fd12)
n (2.6)
If D34maxindicates the total delay to achieve the second exchange with all the servers and
D the total delay for an achieved authentication, then:
Since the expected value (or mean [11]) is a linear operator:
E(D) = E(D12max) + E(D34max) (2.8)
where E(D) is the expected value of the total delay i.e. the authentication protocol overhead. Its expression and its profile are given in the next section.
Summary of our assumptions:
1. threshold number equal to servers number n 2. authentication method uses RSA cryptography 3. computing time within the nodes is negligible 4. Link Layer treating time is negligible
5. same number of hops between the JN and each AAA server
6. routes are already established
7. retransmission probability (p) equal 0.1
2.2
Overhead Evaluation
The overhead E(D) depends on the length of the four messages, the byte-rate, the spread spectrum technic employed by the Physical layer, the probability of retransmissions, the number of hops, and the number of servers. Their values are summarized in table 2.2 except for the number of servers and the number of hops that we varied: n ∈ {1, ..., 6} and hops ∈ {1, ..., 10}. The spread technic we employed is DSSS. The length of messages were indicated according to their content (cf. section 1.1) and following the example given in [13].
Taking into account the parameters of table 2.2, (2.8) gives:
E(D) = Z +∞ −∞ 866.7284917 t (−0.5000000002 erf(0.6144945009 10 −8(−0.25 1012 t + 0.287777519 109 hops) √ hops )
+ 0.5000000002)(n−1)ne(−0.3776034916 10−16 (−0.25 1012 t+0.287777519 109 hops)2hops )/phops dt
+ Z +∞ −∞ 385.8159001 t (−0.5000000000 erf(0.3419204391 10 −8(−0.2 1012t + 0.747232111 109 hops) √ hops )
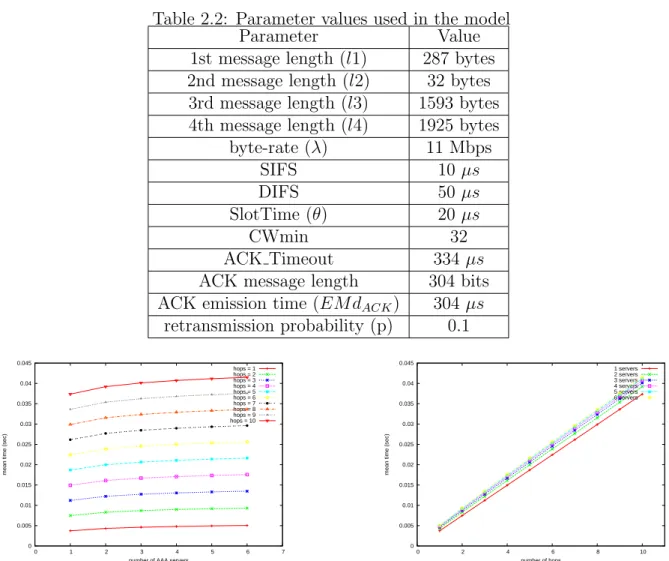
Table 2.2: Parameter values used in the model Parameter Value 1st message length (l1) 287 bytes 2nd message length (l2) 32 bytes
3rd message length (l3) 1593 bytes 4th message length (l4) 1925 bytes byte-rate (λ) 11 Mbps SIFS 10 µs DIFS 50 µs SlotTime (θ) 20 µs CWmin 32 ACK Timeout 334 µs ACK message length 304 bits ACK emission time (EM dACK) 304 µs
retransmission probability (p) 0.1 0 0.005 0.01 0.015 0.02 0.025 0.03 0.035 0.04 0.045 0 1 2 3 4 5 6 7
mean time (sec)
number of AAA servers
hops = 1 hops = 2 hops = 3 hops = 4 hops = 5 hops = 6 hops = 7 hops = 8 hops = 9 hops = 10 0 0.005 0.01 0.015 0.02 0.025 0.03 0.035 0.04 0.045 0 2 4 6 8 10
mean time (sec)
number of hops 1 servers 2 servers 3 servers 4 servers 5 servers 6 servers
Figure 2.4: Max model. On the left-hand side: overhead vs. #AAA servers. On the right-hand side: overhead vs. #hops
Figure 2.4 depicts the evolution of the overhead E(D) when the number of AAA servers and the number of hops increase. As expected, E(D) increases when n rises and when hops rises. The form of the curves when n increases is not exactly a line segment whereas that of the curves when hops increases is roughly a line segment. The values range is between about 0.003 sec for n = 1 and hops = 1 and 0.04 sec for n = 6 and hops = 10, which is largely acceptable from the QoS point of view. However, it still necessary to confront these results to the simulations. This is treated in the next chapter.
3
Protocol Simulation for a
Practical Evaluation of the
Authentication Overhead
Simulations were conducted on NS-2.33 [14]. In a nutshell, NS-2 is a discrete event network simulator that provides several configuration possibilities for wireless scenarios. It can correctly simulate a hundred wireless nodes in one run. The core of NS-2 is written in C++. OTCL scripts are used to specify scenarios.
We mainly wrote two OTCL scripts for our simulations. In the first one, we assumed that the routes were already established as for the model of the chapter 2 and that the nodes don’t move. This first scenario allowed us to validate our model. In the second one, nodes were set into motion to evaluate the impact of the movement on the overhead.
AAA1
AAA2
AAA3
JN
100 m 100 m 100 m
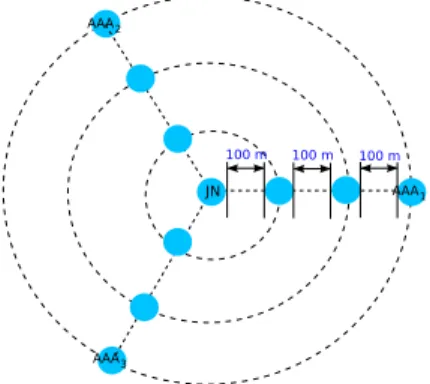
Figure 3.1: Nodes placement in simulations flat-grid (n = 3, hops = 3)
We also wrote a C program to automatically place the nodes at a given number of hops and for a given number of servers (cf. Figure 3.1). Nodes are placed on concentric circles of the same center: the joining node JN. Servers are on the outermost circle of radius 100 · hops meters. They are placed in such a way that angles are equal between them. Relaying nodes are at the intersection of the lines joining the JN to the servers with the circles of radius r ∈ {100, ...., 100 · (hops − 1), 100 · hops}.
scenario for different values of n and hops.
The following section gives some important NS commands that were used in OTCL scripts. It also specifies some relevant parameters for the simulations.
3.1
Simulation Parameters
Table 3.1 summarizes the simulation parameters. To be sure that the obtained results are not influenced by the simulation duration or length of the queue, their values were chosen sufficiently large: simulation duration: 600 sec, length of the queue: 1000 packets.
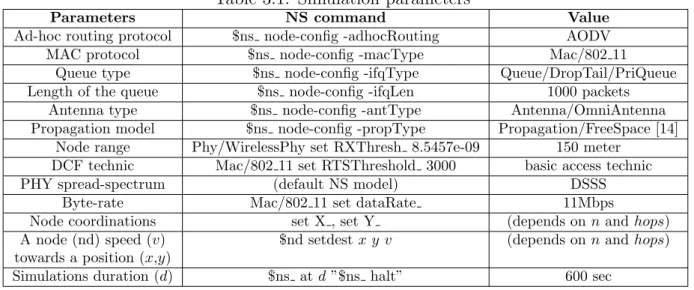
Table 3.1: Simulation parameters
Parameters NS command Value
Ad-hoc routing protocol $ns node-config -adhocRouting AODV
MAC protocol $ns node-config -macType Mac/802 11
Queue type $ns node-config -ifqType Queue/DropTail/PriQueue
Length of the queue $ns node-config -ifqLen 1000 packets
Antenna type $ns node-config -antType Antenna/OmniAntenna
Propagation model $ns node-config -propType Propagation/FreeSpace [14]
Node range Phy/WirelessPhy set RXThresh 8.5457e-09 150 meter
DCF technic Mac/802 11 set RTSThreshold 3000 basic access technic
PHY spread-spectrum (default NS model) DSSS
Byte-rate Mac/802 11 set dataRate 11Mbps
Node coordinations set X , set Y (depends on n and hops)
A node (nd) speed (v) $nd setdest x y v (depends on n and hops)
towards a position (x,y)
Simulations duration (d) $ns at d ”$ns halt” 600 sec
3.2
Motionless Nodes Scenario
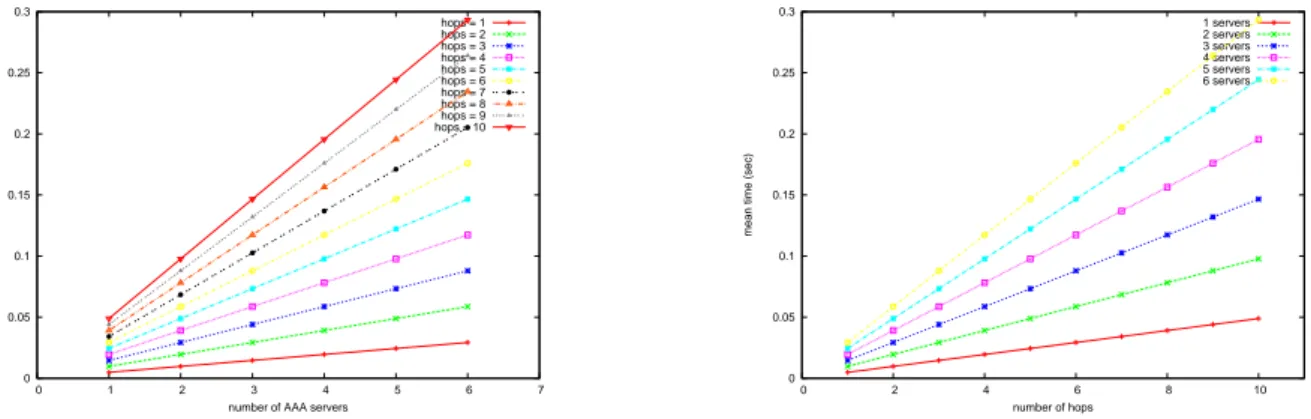
0 0.05 0.1 0.15 0.2 0.25 0.3 0.35 0 1 2 3 4 5 6 7
mean time (sec)
number of AAA servers
hops = 1 hops = 2 hops = 3 hops = 4 hops = 5 hops = 6 hops = 7 hops = 8 hops = 9 hops = 10 0 0.05 0.1 0.15 0.2 0.25 0.3 0.35 0 2 4 6 8 10
mean time (sec)
number of hops 1 servers 2 servers 3 servers 4 servers 5 servers 6 servers
Figure 3.2: Motionless simulations. On the left-hand side: overhead vs. #AAA servers. On the right-hand side: overhead vs. #hops
This scenario utilizes fixed routes during the whole simulation time. A route from the JN to a AAA server is composed of the nodes at the intersections between the line joining
the JN to the server and the concentric circles (cf. Figure 3.1). We ran NS for each couple (n, hops) and traced the results showed in Figure 3.2.
AAA AAA MSG2 i j t 1 t2 MSG2 t 3 AAA AAA MSG2 i j t 1 t2 MSG2 t 3
Figure 3.3: On the left-hand side: actions execution in the real case. On the right-hand side: actions execution in NS simulations
The resulting curves are increasing like for the model (cf. chapter 2). However their shape and the values range are significantly different. This stems essentially from a main trait of NS that is ”sequentiality”. NS indeed can not simulate two actions that overlap [14]. Figure 3.3 illustrates that when the servers AAAi and AAAj respond to JN (during
the first round-trip). AAAi sends its response, MSG2, to the JN at t1. The transmission
ends at t3. AAAj sends its response MSG2 at t2 (t1 ≤ t2 ≤ t3). In the real case, this
response is effectively sent at t2. In NS simulations, it can not be sent until the end of
MSG2 of AAAi i.e at t3. 0 0.05 0.1 0.15 0.2 0.25 0.3 0 1 2 3 4 5 6 7
mean time (sec)
number of AAA servers
hops = 1 hops = 2 hops = 3 hops = 4 hops = 5 hops = 6 hops = 7 hops = 8 hops = 9 hops = 10 0 0.05 0.1 0.15 0.2 0.25 0.3 0 2 4 6 8 10
mean time (sec)
number of hops 1 servers 2 servers 3 servers 4 servers 5 servers 6 servers
Figure 3.4: Sum model. On the left-hand side: overhead vs. #AAA servers. On the right-hand side: overhead vs. #hops
We modified the model to take the ”sequentiality” feature into consideration and obtained the results of Figure 3.4. In the modified model, instead of computing the maximum of {d12j}1≤j≤n, we computed their sum. Hence the delay D12sum to achieve the
first round-trip with all the servers is: D12sum =
n
X
j=1
d12j
is a linear operator: E(D12sum) = E( n X j=1 d1j) + E( n X j=1 d2j) = n · (hops · µW Ld1) + n · (hops · µW Ld2) = n · hops · (µW Ld1 + µW Ld2)
Similarly the delay D34sum to achieve the second round-trip with all the servers verifies:
E(D34sum) = E( n X j=1 d3j) + E( n X j=1 d4j) = n · (hops · µW Ld3) + n · (hops · µW Ld4) = n · hops · (µW Ld3 + µW Ld4)
So the total delay for a successful authentication is: E(D) = E(D12sum) + E(D34sum)
= n · hops · (µW Ld1 + µW Ld2 + µW Ld3 + µW Ld4)
= n hops (4 p3ACK T imeout λ + 4 p ACK T imeout λ + 2 p CWmin λ
+ 4 p DIF S λ + 4 p5 ACK T imeout λ + 4 p7ACK T imeout λ + 128 p7 CWmin λ + 4 p4ACK T imeout λ + 16 p4 CW min λ
+ 4 p4 DIF S λ + 32 p5 CW min λ + 4 p5 DIF S λ
+ 4 p2 ACK T imeout λ + 4 p2 CW min λ + 4 p2 DIF S λ + 4 p6 DIF S λ + 4 p6 ACK T imeout λ + 64 p6CW min λ
+ 8 p3 CW min λ + 4 p3 DIF S λ + 4 p7 DIF S λ + 4 λ SIF S + l4
+ l2+ l1+ l3+ 4 λ DIF S + 4 λ EdACK + p3 l3+ p6 l3+ p4 l3
+ p5 l4+ p3 l4+ p4 l4+ p6 l4+ p7 l4+ p4 l2 + p l2+ p2 l3
+ p5 l3+ p7 l3+ p6 l2+ p l4+ p l3+ p2 l4+ p5 l2+ p7 l2
+ p3 l2+ p2 l1+ p5 l1+ p7 l1+ p3 l1+ p4 l1 + p6 l1+ p l1
+ p2 l2)/λ
The similarity between Figure 3.2 and Figure 3.4 is weighty. The range of values is slightly larger for the simulations. The largest difference of values is about 0.08 sec for n = 6 and hops = 9. This slight difference is due to the accumulated delays of transmissions and receptions of the packets between the layers of the nodes. In the model, we supposed that they were negligible. This is confirmed by the simulations with less than 0.08 sec.
model curves, we deduce that this tiny difference is proportional to the number of hops and the number of servers: when the number of crossed nodes increases, the number of crossed layers rises, so that the number of transmissions and receptions between the layers rises, as well.
These findings are of great importance because they prove that our model is valid. They also prove that the authentication protocol is scalable for different numbers of servers and different numbers of hops. They remain valid for the ”max” model where the maximum of the message delays through the servers was computed rather than their sum: the maximum is indeed at most equal to the sum.
Indeed, notice that the ”max” model gives a better overhead than the ”sum” model and its corresponding simulations. The overhead is almost nine times better for the ”max” model than for the ”sum” model.
Anyway, the second scenario simulations were also carried with NS to evaluate the impact of the nodes movement on the overhead.
3.3
Moving Nodes Scenario
This scenario simulations were also carried out with NS-2 to evaluate the impact of the nodes movement on the overhead. Initially routes are established likely to the previous section. At t = 300sec, nodes that are one-hop away from the JN, are put into motion in the trigonometric (anticlockwise) direction. At the same time, nodes that are two-hops away from the JN, are put into motion in the clockwise direction. Each node moves linearly at a speed of 5m/s towards the next node on the same circle as itself.
Trajectories were thought in a manner that nodes from the first and the second hop begin to move away from each others without disconnecting definitely from the network. At the end of the movement, they indeed place themselves at the previously defined intersections (cf. the beginning of chapter 3).
During the movement and when authentications are attempted, routes are recalculated by AODV [15]. Sometimes, some nodes find themselves beyond the scope of the other nodes and hence become unreachable. This can happen when n ≥ 3 and hops ≥ 3. For n < 3, all the nodes are situated on the same line whatever the value of hops is, so moving nodes never become unreachable (when n = 1, there is one node at the first hop and one node at the second hop, so they do not move. When n = 2, there is a couple of nodes at the first hop and a couple of nodes at the second hop, all situated on the same line. Each couple nodes move towards each other, so remain within the scope of each other).
For hops < 3 and whatever the value of n is, the network graph never becomes disconnected. The cases n ∈ {1, 2} were already proved in the previous paragraph, and
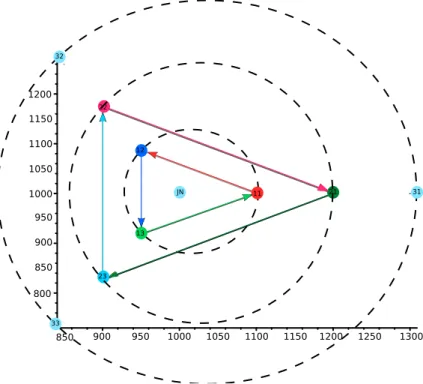
800 900 1000 1100 1200 900 1000 1100 1200 1300 900 950 1000 1050 1100 1150 1200 1250 1300 850 900 950 1000 1050 1100 1150 21 22 23 JN 11 12 13 31 32 33 1200 800 850
Figure 3.5: Trajectory of relaying nodes lines joining the servers to the JN shrink as n increases.
Figure 3.5 depicts the case where n = 3 and hops = 3. Nodes 31, 32 and 33 designate the AAA servers. At the first hop, node 11 (respectively 12 and 13) moves towards node 12 (respectively 13 and 11). At the second hop, node 21 (respectively 22 and 23) moves towards node 23 (respectively 21 and 22). Beyond the second hop, nodes do not move.
60 70 80 90 100 110 120 0 10 20 30 40 50 60 70 u 300 310 320 330 340 350 360 730 d (m) 120 110 100 90 80 70 60 t (sec) 11 13 12 120 140 160 180 200 220 240 260 0 10 20 30 40 50 60 70 u 300 310 320 330 340 350 360 370 260 240 220 200 160 140 120 180 d (m) t (sec) 21 22 150
Figure 3.6: Influence of the relaying nodes movement on the network graph connectedness. On the left-hand side: minimum distance between node 21 and nodes 11, 12 and 13. On the right-hand side: minimum distance between node 31 and nodes 21 and 22
It is obvious that JN is never disconnected from nodes 11, 12 and 13 because they remain inside the circle of 100 meters radius (cf. table 3.1). Besides, the study of the distances between on one hand node 21 and on the other hand nodes 11, 12 and 13 demonstrates that 21 is never disconnected from the network, neither. As shown by
Figure 3.6, the minimum distance between node 21 and nodes 11, 12 and 13 is always less than 150 meters (i.e. nodes range). Between 300 sec and 314 sec, node 11 is the nearest node to 21. Between 315 sec and 334 sec, node 13 becomes the nearest node to 21. Finally, between 335 sec and 368 sec, node 12 becomes the nearest node to 21. Each time the nearest node to 21 changes, we observed that it is soon selected by AODV to become the relaying node between the JN and node 21. For symmetry reasons, this reasoning is valid for nodes 22 and 23.
Furthermore, the study of the distances between the node 31 and the nodes 21 and 22 demonstrates that 31 becomes disconnected from the network between 312 sec and 357 sec (cf. Figure 3.6). Message relaying from the JN to 31 is insured by 21 before 311 sec and by 22 after 358 sec. For symmetry reasons, the same reasoning applies for 32 and 33. Hence for n = 3 and hops = 3, authentication can not be successful from 312 sec to 357 sec because of the non connectedness of the network graph.
Note that the more n increases the shorter is the interval of disconnection and that disconnections occur for hops ≥ 3.
3.4
Protocol Performance
For each couple (n,hops) where n ∈ {1..6} and hops ∈ {1..10} and at each second between the beginning and the end of the movement, an authentication was attempted. After that, we computed the success ratio τ defined as the number of successful authentications di-vided by the total number of authentications:
τ = #successf ul authentications #attempted authentications
The computed success ratio is equal to 0.69 i.e. 69% of the authentications were successful. The investigation of the trace files (produced by NS after each simula-tion) showed that unsuccessful authentications were often due to disconnectedness of the network graph, as explained in the previous section. In that case, authentication message is dropped by the source node and the error NRTE: drop, no route is available appears in the trace file as identified in the following example:
d -t 319.000000000 -Hs 0 -Hd -2 -Ni 0 -Nx 1000.00 -Ny 1000.00 -Nz 0.00 -Ne -1.000000 -Nl RTR -Nw NRTE -Ma 0 -Md 0 -Ms 0 -Mt 0 -Is 0.2 -Id 3.0 -It udp -Il 347 -If 0 -Ii 0 -Iv 30 -Pn udp -Ps 3 -Pa 0 -Pf 0 -Po 0
is dropped and the error COL: drop, collision appears in the trace file as illustrated here: d -t 339.094004956 -Hs 7 -Hd 7 -Ni 7 -Nx 919.10 -Ny 1058.78 -Nz 0.00 -Ne -1.000000 -Nl MAC -Nw COL -Ma 13a -Md 7 -Ms 0 -Mt 800 -Is 0.1 -Id 2.0 -It udp -Il 1711 -If 0 -Ii 0 -Iv 30 -Pn udp -Ps 4 -Pa 0 -Pf 0 -Po 0
When the number of retransmissions reaches seven (cf. section 1.2) for an authenti-cation message, the latter is dropped according to the IEEE 802.11 802.11 standard [5]. The error that appears in the trace file is RET: drop, retry count exceeded, as shown below (note: s for send):
s -t 339.098445441 -Hs 7 -Hd 13 -Ni 7 -Nx 919.10 -Ny 1058.78 -Nz 0.00 -Ne -1.000000 -Nl MAC -Nw — -Ma 13a -Md d -Ms 7 -Mt 800 -Is 0.1 -Id 2.0 -It udp -Il 1711 -If 0 -Ii 0 -Iv 29 -Pn udp -Ps 4 -Pa 0 -Pf 1 -Po 0
s -t 339.126988442 -Hs 7 -Hd 13 -Ni 7 -Nx 919.10 -Ny 1058.78 -Nz 0.00 -Ne -1.000000 -Nl MAC -Nw — -Ma 13a -Md d -Ms 7 -Mt 800 -Is 0.1 -Id 2.0 -It udp -Il 1711 -If 0 -Ii 0 -Iv 29 -Pn udp -Ps 4 -Pa 0 -Pf 1 -Po 0
s -t 339.185584239 -Hs 7 -Hd 13 -Ni 7 -Nx 919.10 -Ny 1058.78 -Nz 0.00 -Ne -1.000000 -Nl MAC -Nw — -Ma 13a -Md d -Ms 7 -Mt 800 -Is 0.1 -Id 2.0 -It udp -Il 1711 -If 0 -Ii 0 -Iv 29 -Pn udp -Ps 4 -Pa 0 -Pf 1 -Po 0
s -t 339.187391148 -Hs 7 -Hd 13 -Ni 7 -Nx 919.10 -Ny 1058.78 -Nz 0.00 -Ne -1.000000 -Nl MAC -Nw — -Ma 13a -Md d -Ms 7 -Mt 800 -Is 0.1 -Id 2.0 -It udp -Il 1711 -If 0 -Ii 0 -Iv 29 -Pn udp -Ps 4 -Pa 0 -Pf 1 -Po 0
s -t 339.221528837 -Hs 7 -Hd 13 -Ni 7 -Nx 919.10 -Ny 1058.78 -Nz 0.00 -Ne -1.000000 -Nl MAC -Nw — -Ma 13a -Md d -Ms 7 -Mt 800 -Is 0.1 -Id 2.0 -It udp -Il 1711 -If 0 -Ii 0 -Iv 29 -Pn udp -Ps 4 -Pa 0 -Pf 1 -Po 0
s -t 339.234775746 -Hs 7 -Hd 13 -Ni 7 -Nx 919.10 -Ny 1058.78 -Nz 0.00 -Ne -1.000000 -Nl MAC -Nw — -Ma 13a -Md d -Ms 7 -Mt 800 -Is 0.1 -Id 2.0 -It udp -Il 1711 -If 0 -Ii 0 -Iv 29 -Pn udp -Ps 4 -Pa 0 -Pf 1 -Po 0
s -t 339.243102655 -Hs 7 -Hd 13 -Ni 7 -Nx 919.10 -Ny 1058.78 -Nz 0.00 -Ne -1.000000 -Nl MAC -Nw — -Ma 13a -Md d -Ms 7 -Mt 800 -Is 0.1 -Id 2.0 -It udp -Il 1711 -If 0 -Ii 0 -Iv 29 -Pn udp -Ps 4 -Pa 0 -Pf 1 -Po 0
d -t 339.244839564 -Hs 7 -Hd 13 -Ni 7 -Nx 919.10 -Ny 1058.78 -Nz 0.00 -Ne -1.000000 -Nl MAC -Nw RET -Ma 13a -Md d -Ms 7 -Mt 800 -Is 0.1 -Id 2.0 -It udp -Il 1653 -If 0 -Ii 0 -Iv 29 -Pn udp -Ps 4 -Pa 0 -Pf 1 -Po 0
couple (n,hops). ρ is defined as:
ρ = overhead in motionless scenario overhead in moving nodes scenario
The mean value of ρ was computed and is equal to 0.23, which means that a successful authentication in the moving nodes scenario produces approximately four times more overhead than the authentication in the motionless nodes scenario. As such, the routing overhead is three times more important than the authentication overhead in the motionless scenario.
The values of τ and ρ demonstrate that the success of an authentication and the amount of its overhead are conditioned by the routing process. However when the au-thentication is successful, its overhead is lower than 1.4 sec.
4
Impact of the Computing Time
Overhead within the Motionless
Scenario
0 0.01 0.02 0.03 0.04 0.05 0.06 0.07 0 1 2 3 4 5 6 7mean time (sec)
number of AAA servers
hops = 1 hops = 2 hops = 3 hops = 4 hops = 5 hops = 6 hops = 7 hops = 8 hops = 9 hops = 10 0 0.05 0.1 0.15 0.2 0.25 0.3 0.35 0.4 0 1 2 3 4 5 6 7
mean time (sec)
number of AAA servers
hops = 1 hops = 2 hops = 3 hops = 4 hops = 5 hops = 6 hops = 7 hops = 8 hops = 9 hops = 10
Figure 4.1: Impact of the computing time on the authentication overhead for the motion-less scenario. On the left-hand side, in the ”max” model. On the right-hand side, with the simulation
In addition to the routing overhead, we evaluated the computing mean time of the authentication messages content on a machine of 2 GHz processor:
• Random number generation: 0.000 ms • RSA signature generation: 9.883 ms • RSA signature verification: 0.391 ms • Token generation: 9.873 ms
These values were integrated to the ”max” model and the motionless nodes scenario (cor-responding to the ”sum” model) (cf. Figure 4.1). In the ”max” model, the overhead rose by about 0.025 sec. However it increased by about 0.5 sec in the motionless simulation. This is logical because in the ”max” model the computing time is added once, however in the motionless simulations corresponding to the ”sum” model, it is added n times. Hence, again, there is an interest for the ”max” model.
Conclusions and Future Works
In the report, we analyzed the overhead resulting from the authentication of a joining node by a distributed AAA infrastructure within a mobile ad-hoc network. The built model demonstrates that when routes are already established, the overhead increases as the number of servers rises and as the number of hops rises, as well. Its value does not exceed 40 milliseconds for a maximum of 6 servers and 10 hops. Simulations that were conducted following to the model pointed out that NS-2 is not the ideal simulator for distributed contexts where parallelism is needed. We modified the model to fit NS-2 simulation results. The obtained overhead values had again an upward trend as the number of servers and the number of hops increase, however their range is about nine times bigger. We conclude that because the simulations fit to the ”sum” model and that this model has the same foundations as the ”max” model, the ”max” model is valid because the maximum is at most equal to the sum.
When some nodes are moving and AODV has to re-establish the routes, on average, the range of the produced overhead is multiplied by four for the successful authentica-tions. The routing overhead is hence three times larger than the authentication overhead produced in the motionless case. On average, we can expect a full authentication accom-plishment after at most 1.4 seconds for a number of servers less than 6 and a number of hops less than 10 (excluding the cases where routes can not be established because some nodes have been momentarily disconnected from the network). So the protocol is scalable when nodes move, too. This leads us to think that the authentication overhead won’t be one of the serious impediments to distributed AAA framework implementations. Troubles will be more related to the AAA framework initialization and the accounting accomplishment.
Concerning the authentications that haven’t been successful, their re-initialization has to be considered so that the necessary time to their completion can be estimated. The case when the number of joining nodes increases is to be treated, as well. Later, a trade-off has to be found between the number of AAA servers to use and the maximum accepted overhead.
Acknowledgment
We are thankful to ANR (Agence Nationale de la Recherche) financing the TLCOM MobiSEND project.
We are also thankful to the CEREGMIA department of the UAG (Universite des Antilles et de la Guyane) for their collaboration during the years 2007 and 2008.
Bibliography
[1] S. Larafa, M. Laurent-Maknavicius, and H. Chaouchi. Light and distributed AAA scheme for mobile ad-hoc networks. In Proc. First Workshop on Security of Au-tonomous and Spontaneous Networks (SETOP 2008), pages 93–103, Loctudy, France, october 2008.
[2] S. Larafa and M. Laurent-Maknavicius. Protocols for distributed AAA framework in mobile ad-hoc networks. In Proc. Workshop on Mobile and Wireless Networks Security (MWNS 2009), pages 75–86, Aachen, Germany, May 2009.
[3] C. Rigney, S. Willens, and A. Rubens. Remote authentication dial in user service (RADIUS). RFC 2865, June 2000.
[4] P. Calhoun, J. Loughney, E. Guttman, G. Zorn, and J. Arkko. Diameter base pro-tocol. RFC 3588, September 2003. http://tools.ietf.org/html/rfc3588.
[5] IEEE Computer Society. Wireless LAN medium access control (MAC) and physical layer (PHY) specifications. IEEE Standard 802.11, June 1999.
[6] A. Shamir. How to share a secret. In Communications of the ACM, volume 22, pages 612–613, November 1979.
[7] V. Shoup. Practical threshold signatures. In EUROCRYPT 2000, volume 1807, pages 207–220, 2000.
[8] ISO [9798-3]. http://www.iso.org/iso/fr/search.htm?qt=9798-3&published= on&active_tab=standards.
[9] Giuseppe Bianchi. Performance analysis of the IEEE 802.11 distributed coordination function. IEEE Journal on Selected Areas in Communications, 18:535–547, March 2000.
[10] Daniel Zwillinger and Stephen Kokoska. CRC Standard Probability and Statistics Tables and Formulae. CRC Press, 2000.
[11] Maurice Kendall, A. Stuart, and J.K. Ord. The Advanced Theory of Statistics, vol-ume 1. Wiley, 2009.
[12] Milton Abramowitz and Irene A. Stegun. Handbook of Mathematical Functions with Formulas, Graphs, and Mathematical Tables. Dover, New York, 1964.
[14] UC Berkeley, LBL, USC/ISI, and Xerox PARC. The NS manual (formerly ns notes and documentation), January 2009. http://www.isi.edu/nsnam/ns/ ns-documentation.html.
[15] C. Perkins, E. Belding-Royer, and S. Das. Ad hoc on-demand distance vector (AODV) routing. RFC 3561, July 2003. http://tools.ietf.org/html/rfc3561.