Titre:
Title: The effect of holding a research chair on scientists’ productivity
Auteurs:
Authors: Seyed Reza Mirnezami et Catherine Beaudry
Date: 2016 Référence:
Citation:
Mirnezami, Seyed Reza et Beaudry, Catherine (2016). The effect of holding a research chair on scientists’ productivity. Scientometrics, 107(2), p. 399-454. doi:10.1007/s11192-016-1848-y
Document en libre accès dans PolyPublie
Open Access document in PolyPublie URL de PolyPublie:
PolyPublie URL: http://publications.polymtl.ca/2318/
Version: Version finale avant publication / Accepted versionRévisé par les pairs / Refereed Conditions d’utilisation:
Terms of Use: CC BY-NC-ND
Document publié chez l’éditeur commercial Document issued by the commercial publisher
Titre de la revue:
Journal Title: Scientometrics Maison d’édition:
Publisher: Springer URL officiel:
Official URL: http://dx.doi.org/10.1007/s11192-016-1848-y Mention légale:
Legal notice: The final publication is available at Springer via http://dx.doi.org/10.1007/s11192-016-1848-y
Ce fichier a été téléchargé à partir de PolyPublie, le dépôt institutionnel de Polytechnique Montréal
This file has been downloaded from PolyPublie, the institutional repository of Polytechnique Montréal
The Effect of Holding a Research Chair on
Scientists’ Productivity
Seyed Reza Mirnezami*, Catherine Beaudry**†
*seyed-reza.mirnezami@polymtl.ca - **catherine.beaudry@polymtl.ca Polytechnique Montreal, P.O. Box. 6079, Montreal, QC, H3C 3A7, Canada
†Corresponding author
Keywords: Scientist Publication, Research Funding, Matching Techniques, Research Chair
Abstract
Having combined data on Quebec scientists’ funding and journal publication, this paper tests the effect of holding a research chair on a scientist’s performance. The novelty of this paper is to use a matching technique to understand whether holding a research chair contributes to a better scientific performance. This method compares two different sets of regressions which are conducted on different data sets: one with all observations and another with only the observations of the matched scientists. Two chair and non-chair scientists are deemed matched with each other when they have the closest propensity score in terms of gender, research field, and amount of funding. The results show that holding a research chair is a significant scientific productivity determinant in the complete data set. However, when only matched scientists are kept in data set, holding a Canada research chair has a significant positive effect on scientific performance but other types of chairs do not have a significant effect. In the other words, in the case of two similar scientists in terms of gender, research funding,
Introduction
Scientists’ academic performance has been extensively discussed and many of its determinants are currently known as potential motives for publishing papers in peer-reviewed journals. Among others, age, gender, private and public funding, institutional setting, field and context are the most important determinants. Funding definitely plays a major role in knowledge production and in shaping scientific productivity: its positive effect on scientific productivity has been extensively demonstrated in the literature (Crespi and Geuna, 2008; Pavitt, 2000, 2001; Salter and Martin, 2001).
The name and prestige of research centers may generally affect scientific productivity. For instance, Turner (2005) showed the outstanding research performance of ‘Grandes Ecoles’ in France. Beside the name and brand of academic institutions, centers with specific research orientations such as ‘centers for excellence’ are also effective on the level of scientific productivity (Niosi, 2002). Other desirable factors, similar to ‘centers for excellence’, may increase an individual’s research motivation and influence the willingness or ability of a scientist for conducting original research. In this paper, we focus on the effect of holding a ‘research chair’ as a possible determinant of scientific publication. On the one hand, it may help the holder of this chair to be liberated from the constant quest for research funds or to have time to construct a more effective network, which may result in propelling future knowledge production. On the other hand, greater scientific productivity may simply be the effect of the past performance of a scientist, implying an intrinsic ability of scientists in conducting research and/or in mobilising effectively its extensive networking capacity.
Using an appropriate econometric model, this paper tests whether ‘holding a chair’ has a significant effect on scientific productivity. The rest of paper is organised as follows: section 1 reviews the literature and proposes a theoretical framework that leads to two hypotheses. Section 2 explains how
data is gathered and describes the variables used in the econometric models. Section 3 presents the results of the regressions in regard to testing the hypotheses. Finally, section 4 concludes and summarizes the results of the paper.
Section 1 - Theoretical framework
The literature relevant to this article brushes on the importance of having a prestigious academic position or affiliation. Focusing on the role of university prestige in academic performance, Long et al. (1979) found a positive and significant correlation between the prestige of the scientist alma matter and the prestige of subsequent employment affiliation. The authors also indicated that graduating from a prestigious university has a positive effect on citations (but not on publication counts). The paper also provides a justification for the effect of prestige arguing that the best students are admitted to the most prestigious universities and subsequently the graduates of the prestigious universities are generally recruited by other similar institutions. Furthermore, such scientists who studied in and have been recruited by prestigious universities are better able to interact with new gifted students (Long et al., 1979). This paper argued that academic prestige can push forward research and its quality. More recently, Zhou et al. (2012) showed that papers cited by prestigious scientists, regardless of the number of citations, are of a higher quality than papers which are cited by ‘ordinary’ scientists.
Prestige can be seen from the reverse direction of causality. West et al. (1998) investigated the relationship between departmental climate, such as degree of formalization, support for career development and support for innovation on the one hand, and officially rated effectiveness of universities on the other hand. They conclude that the causality direction is from former to latter,
showing that the prestige of universities is an effect and not a cause for appropriate departmental climate and necessary institutional setting for conducting research.
Measuring and quantifying prestige have been discussed in some articles. Frey and Rost (2010) compared three types of university ranking based on the number of articles, number of citations, and membership of editorial board or of academic associations. The authors indicated that these rankings are not compatible with each other and suggested the use of multiple measurements. Van Raan (2005) criticized the applicability of university rankings such as the Shanghai ranking for evaluating
academic excellence by noting that the ‘affiliation’, as an important factor reflecting research atmosphere, is not well addressed in those ranking. In addition to the university ranking, it is
important to assess individual research productivity to have a better sense of prestige. Henrekson and Waldenström (2007) introduced three types of indicators, measuring research performance: (1) measures based on weighted journal publications, (2) measures based on citations to most cited works, and (3) measures based on the number of publications.
To measure prestige with a more robust measure, it is possible to consider awards as a measure of prestige, which is awarded based on a deliberate assessment in specialized and independent committees. Different types of research chairs are examples of awards. In Canada, there are three types of research chair: (1) research chairs which are awarded by industry and generally referred to as industrial chairs; (2) research chairs which are awarded by Canadian federal funding agencies such as the Natural Science and Engineering Research Council (NSERC) and the Canadian Institutes of Health Research (CIHR); and (3) the ‘Canada research chairs’, whose holders are assumed to already achieve research excellence in one of the main fields of research: engineering and the natural
sciences, health sciences, humanities, and social sciences. The purpose of this latter program is to “improve […] depth of knowledge and quality of life, strengthen Canada’s international
competitiveness, and help train the next generation of highly skilled people through student
supervision, teaching, and the coordination of other researchers’ work”1. Considering holding a chair
as some kind of measure of prestige, we aim to elucidate the effect of being a ‘chair-holder’ on scientific productivity. Our first hypothesis therefore reads as:
Hypothesis 1: Holding a chair increases a scientist’s performance measured in terms of number of
publications.
Hypothesis 1 tests the performance of chair-holders compared to other scientists and as such does not seek to prove causality. Considering the fact that chair-holders are the well-funded scientists too, this hypothesis cannot detach the funding effect of the chair from its other effects (mainly from prestige and networking effect). In other words, despite the evidence in literature about the benefits and goals of the research chair programs other than funding, hypothesis 1 is not able to disentangle them. A number of authors tried to highlight the functions and characteristics of research chairs. Cantu et al. (2009) showed the research chair program would be a good strategy for implementing knowledge-based development. In study on German universities, Schimank (2005) argued that chair-holders are small businessmen with high job security and no bankruptcy in addition to a good level of freedom of teaching and research, indicating that research chairs have the characteristics of job security and sovereignty.
According to official documents, influencing scientific productivity is not the direct goal of a research chair. In the tenth-year evaluation report for Canada research chair (CRC)2 programme, the authors
conclude that CRC program is an effective way for Canadian universities to “attract and retain
leading researchers” from other countries (page 4). The report does not say that holding a research chair is a determining factor of a chair’s scientific production: “the extent to which this success can be related directly to the CRC is difficult to quantify” (page 5). Furthermore, holding a research chair does not imply a higher salary. Courty and Sim (2012) showed that although having Canada Research Chair (CRC) initially increases the professors’ salary, such an increase erodes quickly over the time. This means that getting a research chair does not necessarily result in long-term salary jump.
It is possible to look at the research chair as a result of scientists’ characteristics and achievements (for instance number of articles, and number of citations). A chair-holder may experience an effect specific to holding chair on his/her scientific production in addition to the contribution of his/her characteristics and past achievements. To disentangle the exclusive effect of chair from the effect of scientists’ characteristics, we propose our second hypothesis:
Hypothesis 2: Keeping a scientist’s main characteristics (gender, research field, and amount of
grants) constant, holding a research chair does not have a significant positive effect on his/her scientific production.
This hypothesis can be tested using a matching technique, which will be explained in the
methodology section. In addition to our two hypotheses, a number of factors have been shown in the literature to influence research productivity. These will be used as control variables in our regression models. Among others, age, gender, funding, research field, and university characteristics are the most important determinants of scientific production which should be controlled when the effect of research chair on scientific productivity is being tested.
In terms of age, two strands of the literature about its effect on scientific productivity are in opposition to one another. First, some authors argue for the life cycle trend in economic activity,
referring to the non-linearity of human productivity during life (Becker, 1962). Those articles show that productivity follows an inverted U-shape format (Kyvik, 1990; Kyvik and Olsen, 2008), which can be justified by the optimization of the trade-off between cost of human capital investment at a younger age and its return as a benefit at an older age. For instance, Bernier et al. (1975) showed an increase in quality and quantity of publications until the age of 44 and a fall after that age. The second strand of the literature generally finds that scientists’ academic performance (number of articles and number of citations) decreases with age (Bonaccorsi and Daraio, 2003; Diamond, 1986; Levin and Stephan, 1991).
Gender is also known as a significant determinant of scientific productivity in the literature. Nakhaie (2002) showed that Canadian female scientists have a lower scientific productivity compared to their male colleagues. Long (1990) explained that women’s opportunities for collaboration are
significantly less than those of men’s because women have young children. However, in another study, Long (1992) showed that women are less productive in the first decade of their career but are more productive afterwards. Moreover, Xie and Shauman (1998) and Abramo et al. (2009) argue that gender differences in research productivity have declined over time, while at the same time the population of female scientists has proportionally increased.
Research funding is another important determinant of scientific productivity. In a review article on the effect of funding, Salter and Martin (2001) suggested the following six types of contribution of publicly funded research: source of new useful knowledge, new instrumentation and methodologies, skills developed by those involved in carrying out basic research, expansion of national and
international networks, dealing with complex problems3, and creation of spin-off companies. Pavitt
(2001) also referred to the importance of public support for scientific infrastructure development and highlights its role in the effectiveness of public grants. In another study, Pavitt (2000) argued that funding for infrastructure of expertise, equipment and networks is necessary for the development and implementation of research.
Another body of literature investigates the effect of university characteristics on scientific
productivity. Heinze et al. (2009) showed that the small size of a research group, sufficient access to the various technical skills, and an appropriate leadership all result in an improvement in research productivity. Similarly, Carayol and Matt (2006) found that in a smaller laboratory, individual researchers publish more, compared with individuals working in a large laboratory. Other authors focused on the effect of faculty size. Buchmueller et al. (1999) indicated that graduate school faculty size is a significant determinant of the research proficiency of graduates. Jordan et al. (1988, 1989) suggested that research productivity is positively associated with department size but that the effect becomes weaker as the size increases. In contrast, Kyvik (1995) rejected both hypotheses that large departments are more productive and that faculty members of large departments better assess the research environment.
In terms of university governance, Jordan et al. (1989) found significant evidence that private institutions have a greater average productivity, but Golden and Carstensen (1992) found no
difference between public and private universities in terms of research productivity when controlling for research support from leading research foundations and department faculty rating. Golden and Carstensen argued that public and private institutions are solely different in a way that public institutions have a greater teaching load, which may affect scientific productivity.
Differences between fields and context are also noted by a number of authors. Blackburn et al. (1978) showed that the fields of humanities and sciences have different patterns of scientific production. To justify the differences between disciplines, Baird (1986) for instance showed that large research laboratories in chemistry, the scholarly apprenticeship approach in history, and research over practice in psychology are important field-dependent factors in scientists’ productivity. In another
comprehensive study, Baird (1991) referred to the productivity and citation pattern differences among disciplines and argues that size, internal university support and federal support can explain such differences. The evidence from the literature clearly suggests that scientific productivity may depend on academic prestige and on other control variables such as funding, gender, age, and university-specific characteristics.
Section 2 - Data and methodology
Data and variablesIn order to validate our two hypotheses, we built a data set based on the integration of data on funding and journal publications for Quebec scientists. For publications, Thompson Reuters Web of Science provides information on scientific articles (date of publication, journal name, authors and their affiliations). The dependent variable of our model therefore counts the yearly number of articles [nbArticle] published by an individual researcher in any given year. For each publication, the
database also provides the number of co-authors. To control for team size, we therefore calculate the average number of co-authors [nbAuthors] over all the articles published by an individual researcher in any given year.
In terms of funding, we use a database of Quebec university researchers (Système d’information sur
and Sports. This database lists the grants and contracts information, including yearly amount, source, and type for the period of 2000-2012 for all Quebec university scientists4 and the title of each specific
research project for which funding was granted. The titles of research project are being used to generate dummy variables identifying whether a scientist has a research chair; the title field clearly states: “chair in…”. As mentioned above, three types of chair are available in Canada: (1) industrial research chairs [dIndChair]; (2) research chairs awarded by Canadian federal granting councils [dGCChair ]; and (3) Canada research chairs [dCRC ]. In addition, we created a dummy variable [dIndGCChair ] indicating whether the scientist is an industrial chair or a chair assigned by Canadian federal granting councils (the combination of dIndChair and dGCChair). Finally, the dummy variable [dChair] is equal to 1 for scientists with any type of chair (the combination of dIndChair, dGCChair,
and dCRC). Appendix 1 reviews the names and description of the variables in the data set and
appendix 2 summarizes the variables’ descriptive statistics.
The next set of variables in the data set measures funding information. In terms of source, the
research funding can be awarded by the public sector, the private sector, or organizations with social and political missions, which we classify as not-for-profit (NFP) organisations. Our research will concentrate on operational cost5 research funding to ensure that the three fields6 examined are more
comparable – there is relatively little infrastructure investment in the humanities and social sciences compared to health sciences and the engineering and natural sciences. The three funding variables to
4 When the funding is attributed to more than one recipient researcher, the total amount of funding is divided by the number of
researchers in the team within the same university. The SIRU data accounts for all interuniversity transfers and funds are counted where they have been transferred and spent. Unfortunately, we have no means by which to sum the funds from the same grants that are transferred to other universities, as the reporting does not allow a match between the data.
5 Research funds may serve two purposes: they may be directly used for research cost and researchers’ salary as operational costs (O) or indirectly help research teams in buying instruments or laboratory infrastructure (I). It is therefore possible to generate six research funding variables for each researcher [PublicfundingO, PublicfundingI, PrivatefundingO, PrivatefundingI, NFPfundingO, and NFPfundingI]. In reality, research infrastructure funding stems mainly from public sources and the private and not-for-profit sources (PrivatefundingI, NFPfundingI) are too sporadic, i.e. rarely different from 0, to be used effectively in our models.
be considered are therefore [PublicfundingO, PrivatefundingO, and NFPfundingO] for the public, private and not-for-profits sectors respectively. The funding variables are measured in three-year averages to smooth out large variations in yearly funding.
In addition, age and gender of scientist are also available in dataset [Age, dFemale] and provide useful controls for scientific productivity, as was highlighted in the theoretical framework. This information was disambiguated by the Observatoire des sciences et des technologies (OST) for all Quebec academics.
Methodology and econometrics model
To measure the effect of ‘holding a research chair’ on a scientist’s performance, we use a panel regression model where the left-hand-side (LHS) variable the number of articles [nbArticle] is a measure of scientific productivity. On the right-hand-side (RHS), the main independent variables are the research chair dummy variables described above [dIndChair, dGCChair, dCRC, dIndGCChair,
dChair]. The other independent variables are our controls, among others age [Age], gender
[dFemale], as well as funding, and are described in the next paragraphs.
In terms of funding, this research only focuses on the effect of the operational budget because funding for the purpose of buying instruments or laboratory infrastructure does not have a regular pattern, implying that it depends on the research needs, field, and handiness of updated research instruments. Hence we only use the variables of operational costs [PublicfundingO, PrivatefundingO,
NFPfundingO] to control for the effect of funding. We also measure the interactive effect of funding
and holding a chair on scientific productivity in regression models to find out whether there is a difference between the funding effect of chair-holders and of non-chair-holders.
Age [Age] and its square are inserted in regression to investigate a non-linear effect of age on
scientific productivity. We also control for university, year, and research division fixed effect in order to account for any impact that our explanatory variables may not cover. For example, McGill
University and University of Montreal (UdeM) produce more scientific publications (figure 17). In
terms of research divisions, Science, Engineering, Medical Science, and Health Science (figure 2) are more productive than others. We also add year dummy variables to account for year-specific
characteristics of the research system as exemplified by the evolution of article counts over time (figure 3).
Figure 1 – Trend of scientists’ number of articles in universities
7 The small universities are grouped according to their active disciplines and other institutional similarities. The University of Quebec and Bishop University are in the same group. The second group includes "École de technologie supérieure" (ETS), "Université du Québec à Montréal" (UQAM), and Institut national de la recherche scientifique (INRS).
0 .5 1 1. 5 N umn be r o f Art icl es 2000 2001 2002 2003 2004 2005 2006 2007 2008 2009 2010 year
U. of Quebec & Bishop U. Laval U. U. of Montreal Concordia U. McGill U. U. of Sherbrooke UQAM & ETS & INRS
Figure 2 – Trend of scientists’ number of articles in different divisions
Figure 3 – Average number of articles in each year
0 .5 1 1. 5 2 N umn be r o f Art icl es 2000 2001 2002 2003 2004 2005 2006 2007 2008 2009 2010 year
Medical Business and Management Education Engineering
Health Science Humanities Non-Health Science Science Social Science .7 .8 .9 1 1. 1 N umn be r o f a rti cl es 2000 2001 2002 2003 2004 2005 2006 2007 2008 2009 2010 year
The possible reason behind yearly differences is that science and research policies may change over time. Hence funding and institutional support may have different formats over the years. In addition, the norms and standards for publication and motivations for research are different across divisions and universities. University dummies and research division dummies may thus account for part of the impact on scientific productivity8. Considering the mentioned explanatory variables, the resulting
model is given by9:
ln nbArticle
(
it+1)
= fln PublicFundingO
(
it+1)
,ln PrivateFundingO(
it+1)
, ln NFPFundingO(
it+1)
,ln nbAuthor(
it)
,(dIndChair |GCChair | dCRC | dIndGCChair | dChair)it,
dFemalei, Ageit, Ageit2, D
Field, DUniversity, DYear
æ è ç ç ç ç ç ö ø ÷ ÷ ÷ ÷ ÷
It is important to note that two variables [PublicfundingO] and [nbArticle] are determined by each other and co-evolve over time, which is a potential source of endogeneity. As a consequence, ordinary least square regressions (for panel data) are biased. The main reason for this potential endogeneity is that scientists are assessed for public funding based on their CV and past performance while at the same time, publication and research quality significantly depends on the funding
available to researchers. We have also conducted Durbin–Wu–Hausman test for endogeneity, in which the residuals of the endogenous right-hand side variable (as a function of all exogenous
variables) are put in the original panel OLS model. By showing that the coefficient of the residuals is significant, it is possible to conclude about existence of endogeneity10.
8 The “Year 2000”, “McGill University”, and the research division of “Medical science” are selected as reference points and are thus the excluded dummy variables.
9 It should be noted that variables measuring funding and number of articles are transformed by natural logarithm function to have normal distribution and satisfy the necessary conditions for running regression equations.
Using instrumental variables (IV) is a common suggested method in literature to address endogeneity problems. There are two main requirements for using IVs: (1) the instruments must be correlated with the endogenous variable, and (2) the instruments should not be correlated with the error term in the main regression equation, which means that the instruments must not suffer from the same
endogeneity problem. If there is more than one instrument for an endogenous variable, it is necessary to perform a two-stage regression, in which the first stage estimates the endogenous variable (the instrumented variable) based on a list of instrumental variables and the independent variables of the second-stage regression. Such an estimation removes the error term of the first stage and keeps the estimated amount for the second stage. Neglecting the error term of the endogenous variable and putting the estimated amount in the main regression equation should generally solve the endogeneity problem.
A number of instruments for the amount of public funding were tested during the course of this research and three were retained. The number of scientists in a university [nbScientistUni] is an
indication of university size. It is expected that a university with a higher number of scientists may benefit from sharing of research costs and expenditures, which reduces the need for larger amounts of individual funding, hence benefitting from some kind of economies of scale.
The rank of previous funding obtained by an individual scientist can predict the future amount of funding. We would call this an echo effect, indicating that highly funded scientists are better able to find new sources of research funds in the future. The rationale behind this argument is that successful researchers have an effective networking capacity (Winter et al., 2006) to generate and benefit from funding opportunities in a country such as Canada (Salazar and Holbrook, 2007). The difference between funding and rank of funding is that the rank of funding is just an ordinal variable and as such does not have information about amounts of funding (it meets the requirements of being an
instruments, benefit from the panel format of the data without imposing an autoregressive structure to the model), while the amount of funding is informative about capacity of conducting original
research. Therefore, we can use the rank of funding as an instrument of funding amount. The rank of a scientist in his/her research division in terms of three-year average amount of funding for the purpose of operational costs and direct expenditure of research [PubORank] is the second instrument retained in this research. Using the same rationale we can use the rank of a scientist in his/her
research division in terms of three-year average number of articles [PublRank] as the third instrument. Regarding the mentioned instruments, in the first stage, the amount of public funding [PublicfundingO] is estimated by the instruments with one-year lag to avoid simultaneity problems. Considering the mentioned explanatory variables, the resulting model is given by:
1 -1 1 st nd , ,ln , 1 Stage: ln 1 ln 1 ,ln 1 , ln 1 ,ln 2 Stage:ln 1 it it it it it it it itPubORank PublRank nbScientistUni
PublicFundingO g
variables from second stage
PublicFundingO PrivateFundingO NFPFu nbArticle f ndi Ong
2 , ( | | | | ) , , , , , , it it i it it Field University YeardIndChair GCChair dCRC dIndGCChair dChair dF
nbAut
emale Age Age D D D
hor
In a well-specified model, the RHS variables (including instrumental variables) should not be highly correlated with each other. The low correlation refers to good level of independence and explanatory power of RHS variables. The correlation matrix is reported as appendix 3 and the correlation
coefficients are acceptable for estimating the regression equations and are thus appropriate choices from this point of view.
The main purpose of this research is to show whether holding a research chair as an external support is important and significant in promoting scientific publication. To test the first hypothesis, it is
sufficient to run the two-stage panel regression on the entire data set to determine whether ‘holding a research chair’ is a significant RHS variable, either as a real cause or a channel for other
variables/causes.
According to the chair characteristics, the networking and prestige effect of ‘holding a research chair’ may be mixed with the effect of funding. To address this issue, we use a matching technique and compare two ‘chaired’ and ‘non-chaired’ scientists who have similar funding, the same gender, and work in the same research field as each other. Following the methodology employed by Bérubé and Mohnen (2009), it is possible to find pairs of chair-holders and non-chair-holders by using the psmatch2 command in Stata and then to remove the unmatched records. The selection is made by generating propensity scores and choosing the pairs of scientists with the closest scores to each other. The new data set consists of ‘twin’ scientists who are similar to each other in terms of funding, gender, and research fields.
Controlling with funding, gender, and research field, and keeping only the matched scientists in the regressions allows to disentangle the prestige effect from the funding effect of the chair and hence, ‘holding a research chair’ becomes a better and more informative signal for the prestige of scientists. In this case, the effect of ‘holding a chair’ on scientific productivity does not include funding effect or it is not related to the field or gender of the scientist. To test the second hypothesis, only matched pairs of scientists are being used in the regression analysis to identify whether holding a research chair has a significant effect on scientific productivity.
One of the important stages of the matching technique consists in validating the quality of matching. This implies that there should be no difference between the averages of the selection criteria (gender, funding, and research fields) when the comparison is made between chair holders and non-chair
holders among the matched pairs. There can however be a difference when the comparison is made between the original database and the matched database. Table 1 summarizes these comparisons and shows that the matching is of acceptable quality for dCRC, dIndGCChair, and dchair.
Table 1 – Mean comparison between holders and non-holders of chairs for the matched and non-matched samples to show the quality of the matching
Gender Funding NSE Health Field11 Nb. of scientists
dCRC=1 0.2000 $463,465 0.2779 0.1661 293
dCRC=0 (before matching) 0.2963 $85,994 0.2516 0.2262 7356
Significance level of difference12 *** *** >0.1 ***
dCRC=0 (after matching) 0.1023 $403,051 0.3583 0.1808 293
Significance level of difference *** >0.1 >0.1 >0.1
dIndGCChair=1 0.1319 $351,835 0.743 0.0694 144
dIndGCChair=0 (before matching) 0.2957 $95,728 0.2432 0.2268 7508 Significance level of difference *** *** *** ***
dIndGCChair=0 (after matching) 0.1111 $369,080 0.6944 0.0902 144 Significance level of difference >0.1 >0.1 >0.1 >0.1
dchair=1 0.1809 $420,693 0.4238 0.1357 418
dchair=0 (before matching) 0.2991 $81,953 0.2427 0.229 7231
Significance level of difference *** *** *** ***
dchair=0 (after matching) 0.1483 $364,117 0.4880 0.1770 418
Significance level of difference >0.1 >0.1 >0.1 >0.1
Section 3 - Result and discussion:
Based on the models presented in methodology section, we first need to estimate the regressions on the entire dataset (tables 2, 3, and 4) to show that all types of chair have a positive and significant effect on scientific productivity. Then, after keeping only the matched scientists in the dataset, who are similar to each other in terms of gender, funding, and research field, the regression results indicate
11 The matching is done based on the dummy variables of NSE (Natural Science and Engineering) and HEALTH (Medical and Health Science). The third dummy is considered as the reference point.
12 To find out whether two variables are indifferent, we validated three null hypotheses: inequality, greater amount, smaller amount. If any of the hypotheses is validated at 1%, then we can say that the difference is significant at the level of 1% (***). Otherwise, the difference is not significant.
a significant and positive result only for the Canada research chair (tables 5, 6, and 7). Industrial chairs and chairs appointed by Canada research council (NSERC, SSHRC, and CIHR) do not have an independent positive effect on scientific productivity. However holding any kind of research chair [dChair] still has significant and positive effect mainly due to higher number of Canada research chairs included in the dChair dummy variable.
Table 2 – Regression results over the entire sample and using dCRC (the second stage of 2SLS)
xtivreg1 xtivreg2 xtivreg3 xtivreg4 xtivreg5 xtreg6
ln(PublicfundingOit+1) 0.0227 *** 0.0210 *** 0.0210 *** 0.0211 *** 0.0211 *** 0.0083 *** (0.0009) (0.0009) (0.0009) (0.0009) (0.0009) (0.0005) ln(PrivatefundingOit+1) 0.0085 *** 0.0084 *** 0.0084 *** 0.0077 *** 0.0077 *** 0.0094 *** (0.0006) (0.0006) (0.0006) (0.0006) (0.0006) (0.0006) ln(NFPfundingOit+1) 0.0059 *** 0.0058 *** 0.0058 *** 0.0058 *** 0.0058 *** 0.0066 *** (0.0005) (0.0005) (0.0005) (0.0005) (0.0005) (0.0005) dFemalei -0.0591 *** -0.0546 *** -0.0499 *** -0.0548 *** -0.0506 *** -0.0666 *** (0.0076) (0.0075) (0.0076) (0.0075) (0.0076) (0.0071) Ageit -0.0054 ** -0.0038 * -0.0039 * -0.0038 * -0.0039 * 0.0049 *** (0.0021) (0.0021) (0.0021) (0.0021) (0.0021) (0.0018) Ageit2 3.30E-05 * 2.00E-05 2.10E-05 2.10E-05 2.10E-05 -1.10E-04 ***
(2.0E-05) (2.0E-05) (2.0E-05) (2.0E-05) (2.0E-05) (1.7E-05)
ln(nbAuthorit) 0.4656 *** 0.4654 *** 0.4654 *** 0.4657 *** 0.4657 *** 0.4855 *** (0.0036) (0.0036) (0.0036) (0.0036) (0.0036) (0.0032) dCRCit 0.2449 *** 0.2760 *** 0.2021 *** 0.2321 *** 0.2414 *** (0.0173) (0.0192) (0.0192) (0.0213) (0.0198) dCRCit*dFemalei -0.1529 *** -0.1358 *** -0.1311 *** (0.0420) (0.0420) (0.0393) dCRCit*ln(PrivatefundingOit+1) 0.0114 *** 0.0108 *** 0.0095 *** (0.0023) (0.0023) (0.0021) Constant 0.0236 -0.0166 -0.0152 -0.0156 -0.0143 0.0406 (0.0557) (0.0554) (0.0554) (0.0553) (0.0553) (0.0483) Number of observations 80775 80775 80775 80775 80775 88422 Number of scientists 7651 7651 7651 7651 7651 7660 χ2 40352.2 *** 41196 *** 41247 *** 41369.1 *** 41398.8 *** 47253.6 *** R2 within groups 0.1854 0.1868 0.1868 0.1866 0.1867 0.2079 R2 overall 0.5456 0.5503 0.5505 0.5509 0.5511 0.5512 R2 between groups 0.7631 0.7681 0.7684 0.7692 0.7695 0.7562
Notes: *, **, and *** show the significance level at 0.1, 0.05, and 0.01 respectively - Year dummies, research division dummies, and university dummies are significant. The minimum year activity, average year activity, and maximum year activity are 1, 10.55, and 12 respectively. The amount of χ2 for Durbin–Wu–Hausman test is 4901.85 and significant at level of 0.01, implying that endogeneity exists.
Table 3 - Regression results over the entire sample and using dIndGCChair (the second stage of 2SLS)
xtivreg1 xtivreg2 xtivreg3 xtivreg4 xtivreg5 xtreg6
ln(PublicfundingOit+1) 0.0227 *** 0.0224 *** 0.0224 *** 0.0224 *** 0.0224 *** 0.0087 *** (0.0009) (0.0009) (0.0009) (0.0009) (0.0009) (0.0005) ln(PrivatefundingOit+1) 0.0085 *** 0.0083 *** 0.0083 *** 0.0082 *** 0.0082 *** 0.0097 *** (0.0006) (0.0006) (0.0006) (0.0006) (0.0006) (0.0005) ln(NFPfundingOit+1) 0.0059 *** 0.0058 *** 0.0058 *** 0.0059 *** 0.0059 *** 0.0067 *** (0.0005) (0.0005) (0.0005) (0.0005) (0.0005) (0.0005) dFemalei -0.0591 *** -0.0591 *** -0.0580 *** -0.0591 *** -0.0580 *** -0.0736 *** (0.0076) (0.0076) (0.0077) (0.0076) (0.0077) (0.0071) Ageit -0.0054 ** -0.0054 ** -0.0054 ** -0.0054 *** -0.0054 ** 0.0038 ** (0.0021) (0.0021) (0.0021) (0.0021) (0.0021) (0.0018) Ageit2 3.30E-05 * 3.30E-05 * 3.20E-05 3.30E-05 * 3.30E-05 * -1.04E-04 ***
(2.0E-05) (2.0E-05) (2.0E-05) (2.0E-05) (2.0E-05) (1.7E-05)
ln(nbAuthorit) 0.4656 *** 0.4658 *** 0.4658 *** 0.4658 *** 0.4658 *** 0.4870 *** (0.0036) (0.0036) (0.0036) (0.0036) (0.0036) (0.0032) dIndGCChairit 0.1084 *** 0.1207 *** 0.0762 ** 0.0886 *** 0.1157 *** (0.0247) (0.0264) (0.0330) (0.0343) (0.0318) dIndGCChairit*dFemalei -0.0935 -0.0926 -0.1187 * (0.0704) (0.0704) (0.0657) dIndGCChairit*ln(PrivatefundingOit+1) 0.0043 0.0043 0.0048 * (0.0029) (0.0029) (0.0027) Constant 0.0236 0.0281 0.0275 0.0294 0.0288 0.0810 (0.0557) (0.0557) (0.0557) (0.0557) (0.0557) (0.0485) Number of observations 80775 80775 80775 80775 80775 88422 Number of scientists 7651 7651 7651 7651 7651 7660 χ2 40352.2 *** 40397 *** 40403.2 *** 40426 *** 40431.8 *** 46374 *** R2 within groups 0.1854 0.1856 0.1856 0.1857 0.1857 0.2083 R2 overall 0.5456 0.5460 0.5460 0.5461 0.5461 0.5464 R2 between groups 0.7631 0.7633 0.7634 0.7634 0.7635 0.7491
Notes: *, **, and *** show the significance level at 0.1, 0.05, and 0.01 respectively - Year dummies, research division dummies, and university dummies are significant. The minimum year activity, average year activity, and maximum year activity are 1, 10.55, and 12 respectively. The amount of χ2 for Durbin–Wu–Hausman test is 5114.92 and significant at level of 0.01, implying that endogeneity exists.
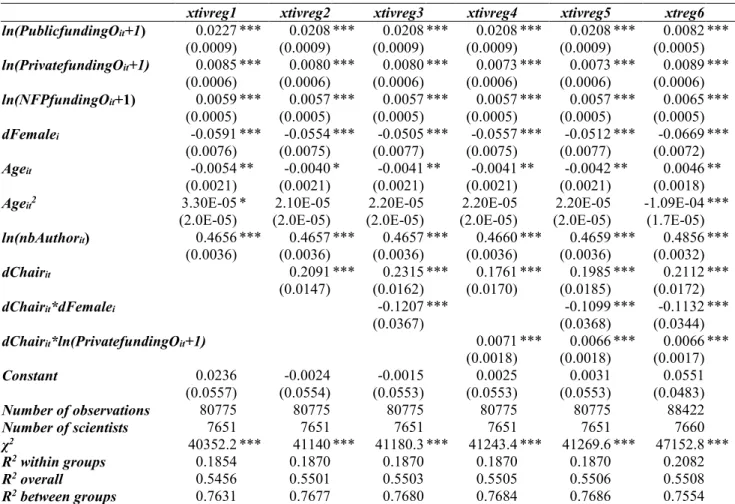
Table 4 - Regression results over the entire sample and using dChair (the second stage of 2SLS)
xtivreg1 xtivreg2 xtivreg3 xtivreg4 xtivreg5 xtreg6
ln(PublicfundingOit+1) 0.0227 *** 0.0208 *** 0.0208 *** 0.0208 *** 0.0208 *** 0.0082 *** (0.0009) (0.0009) (0.0009) (0.0009) (0.0009) (0.0005) ln(PrivatefundingOit+1) 0.0085 *** 0.0080 *** 0.0080 *** 0.0073 *** 0.0073 *** 0.0089 *** (0.0006) (0.0006) (0.0006) (0.0006) (0.0006) (0.0006) ln(NFPfundingOit+1) 0.0059 *** 0.0057 *** 0.0057 *** 0.0057 *** 0.0057 *** 0.0065 *** (0.0005) (0.0005) (0.0005) (0.0005) (0.0005) (0.0005) dFemalei -0.0591 *** -0.0554 *** -0.0505 *** -0.0557 *** -0.0512 *** -0.0669 *** (0.0076) (0.0075) (0.0077) (0.0075) (0.0077) (0.0072) Ageit -0.0054 ** -0.0040 * -0.0041 ** -0.0041 ** -0.0042 ** 0.0046 ** (0.0021) (0.0021) (0.0021) (0.0021) (0.0021) (0.0018) Ageit2 3.30E-05 * 2.10E-05 2.20E-05 2.20E-05 2.20E-05 -1.09E-04 ***
(2.0E-05) (2.0E-05) (2.0E-05) (2.0E-05) (2.0E-05) (1.7E-05)
ln(nbAuthorit) 0.4656 *** 0.4657 *** 0.4657 *** 0.4660 *** 0.4659 *** 0.4856 *** (0.0036) (0.0036) (0.0036) (0.0036) (0.0036) (0.0032) dChairit 0.2091 *** 0.2315 *** 0.1761 *** 0.1985 *** 0.2112 *** (0.0147) (0.0162) (0.0170) (0.0185) (0.0172) dChairit*dFemalei -0.1207 *** -0.1099 *** -0.1132 *** (0.0367) (0.0368) (0.0344) dChairit*ln(PrivatefundingOit+1) 0.0071 *** 0.0066 *** 0.0066 *** (0.0018) (0.0018) (0.0017) Constant 0.0236 -0.0024 -0.0015 0.0025 0.0031 0.0551 (0.0557) (0.0554) (0.0553) (0.0553) (0.0553) (0.0483) Number of observations 80775 80775 80775 80775 80775 88422 Number of scientists 7651 7651 7651 7651 7651 7660 χ2 40352.2 *** 41140 *** 41180.3 *** 41243.4 *** 41269.6 *** 47152.8 *** R2 within groups 0.1854 0.1870 0.1870 0.1870 0.1870 0.2082 R2 overall 0.5456 0.5501 0.5503 0.5505 0.5506 0.5508 R2 between groups 0.7631 0.7677 0.7680 0.7684 0.7686 0.7554
Notes: *, **, and *** show the significance level at 0.1, 0.05, and 0.01 respectively - Year dummies, research division dummies, and university dummies are significant. The minimum year activity, average year activity, and maximum year activity are 1, 10.55, and 12 respectively. The amount of χ2 for Durbin–Wu–Hausman test is 4872.39 and significant at level of 0.01, implying that endogeneity exists.
Table 5 - Regression results over matched scientists over the dCRC sample (the second stage of 2SLS)
xtivreg1 xtivreg2 xtivreg3 xtivreg4 xtivreg5 xtreg6
ln(PublicfundingOit+1) 0.0278 *** 0.0254 *** 0.0254 *** 0.0255 *** 0.0255 *** 0.0096 *** (0.0074) (0.0075) (0.0075) (0.0075) (0.0075) (0.0037) ln(PrivatefundingOit+1) 0.0032 0.0035 * 0.0035 * -0.0001 0.0000 0.0030 (0.0021) (0.0021) (0.0021) (0.0027) (0.0027) (0.0025) ln(NFPfundingOit+1) 0.0014 0.0016 0.0016 0.0016 0.0016 0.0016 (0.0020) (0.0020) (0.0020) (0.0020) (0.0020) (0.0018) dFemalei -0.0906 * -0.0994 * -0.0480 -0.1001 ** -0.0584 -0.1266 * (0.0514) (0.0509) (0.0759) (0.0509) (0.0761) (0.0689) Ageit 0.0413 *** 0.0441 *** 0.0437 *** 0.0441 *** 0.0438 *** 0.0500 *** (0.0112) (0.0112) (0.0112) (0.0112) (0.0112) (0.0096) Ageit2 -4.45E-04 *** -4.63E-04 *** -4.59E-04 *** -4.64E-04 *** -4.61E-04 *** -6.60E-04 ***
(1.1E-04) (1.1E-04) (1.1E-04) (1.1E-04) (1.1E-04) (9.4E-05)
ln(nbAuthorit) 0.6047 *** 0.6048 *** 0.6047 *** 0.6044 *** 0.6043 *** 0.5991 *** (0.0184) (0.0183) (0.0183) (0.0183) (0.0183) (0.0163) dCRCit 0.1297 *** 0.1445 *** 0.0939 ** 0.1068 ** 0.0739 * (0.0396) (0.0427) (0.0430) (0.0464) (0.0417) dCRCit*dFemalei -0.0895 -0.0726 -0.0542 (0.0978) (0.0982) (0.0892) dCRCit*ln(PrivatefundingOit+1) 0.0084 ** 0.0082 ** 0.0074 ** (0.0039) (0.0039) (0.0036) Constant -1.2490 *** -1.3562 *** -1.3553 *** -1.3358 *** -1.3356 *** -0.7559 *** (0.2877) (0.2881) (0.2881) (0.2882 (0.2882 (0.2448) Number of observations 6393 6393 6393 6393 6393 6979 Number of scientists 586 586 586 586 586 586 χ2 3159.02 *** 3200.45 *** 3201.24 *** 3205.26 *** 3205.25 *** 3416.71 *** R2 within groups 0.2527 0.2533 0.2532 0.2536 0.2535 0.2521 R2 overall 0.5332 0.5384 0.5387 0.5392 0.5394 0.5093 R2 between groups 0.6986 0.7055 0.7060 0.7068 0.7071 0.6484
Notes: *, **, and *** show the significance level at 0.1, 0.05, and 0.01 respectively - Year dummies, research division dummies, and university dummies are significant. The minimum year activity, average year activity, and maximum year activity are 2, 10.9, and 12 respectively. The amount of χ2 for Durbin–Wu–Hausman test is 323.5 and significant at level of 0.01, implying that endogeneity exists.
Table 6 - Regression results over matched scientists over the dIndGCChair sample (the second stage of 2SLS)
xtivreg1 xtivreg2 xtivreg3 xtivreg4 xtivreg5 xtreg6
ln(PublicfundingOit+1) 0.0384 *** 0.0383 *** 0.0381 *** 0.0393 *** 0.0392 *** 0.0171 *** (0.0093) (0.0094) (0.0094) (0.0095) (0.0095) (0.0049) ln(PrivatefundingOit+1) 0.0042 0.0043 0.0043 0.0097 ** 0.0098 ** 0.0103 *** (0.0032) (0.0032) (0.0032) (0.0043) (0.0043) (0.0040) ln(NFPfundingOit+1) 0.0018 0.0018 0.0018 0.0017 0.0017 0.0023 (0.0028) (0.0028) (0.0028) (0.0028) (0.0028) (0.0025) dFemalei -0.1661 ** -0.1650 * -0.1462 -0.1623 * -0.1373 -0.2138 * (0.0841) (0.0843) (0.1275) (0.0845) (0.1279) (0.1136) Ageit -0.0045 -0.0044 -0.0041 -0.0039 -0.0036 0.0172 (0.0176) (0.0176) (0.0176) (0.0176) (0.0176) (0.0144) Ageit2 -4.20E-05 -4.30E-05 -4.50E-05 -4.70E-05 -5.00E-05 -3.51E-04 ***
(1.7E-04) (1.7E-04) (1.7E-04) (1.7E-04) (1.7E-04) (1.4E-04)
ln(nbAuthorit) 0.5046 *** 0.5041 *** 0.5043 *** 0.5062 *** 0.5065 *** 0.5284 *** (0.0261) (0.0262) (0.0262) (0.0262) (0.0262) (0.0228) dIndGCChairit -0.0131 -0.0097 0.0496 0.0543 0.0470 (0.0587) (0.0610) (0.0691) (0.0714) (0.0630) dIndGCChairit*dFemalei -0.0333 -0.0441 -0.0365 (0.1677) (0.1681) (0.1497) dIndGCChairit*ln(PrivatefundingOit+1) -0.0104 ** -0.0104 ** -0.0050 (0.0059) (0.0059) (0.0053) Constant 0.0140 0.0134 0.0072 -0.0436 -0.0516 0.0580 (0.4565) (0.4566) (0.4578) (0.4568) (0.4580) (0.3821) Number of observations 3234 3234 3234 3234 3234 3522 Number of scientists 288 288 288 288 288 288 χ2 1253.64 *** 1253.36 *** 1252.08 *** 1253.15 *** 1251.95 *** 1391.07 *** R2 within groups 0.2256 0.2256 0.2257 0.2261 0.2261 0.2401 R2 overall 0.4303 0.4305 0.4306 0.4302 0.4303 0.4079 R2 between groups 0.6001 0.6002 0.6001 0.5992 0.5992 0.5381
Notes: *, **, and *** show the significance level at 0.1, 0.05, and 0.01 respectively - Year dummies, research division dummies, and university dummies are significant. The minimum year activity, average year activity, and maximum year activity are 3, 11.22, and 12 respectively. The amount of χ2 for Durbin–Wu–Hausman test is 135.45 and significant at level of 0.01, implying that endogeneity exists.
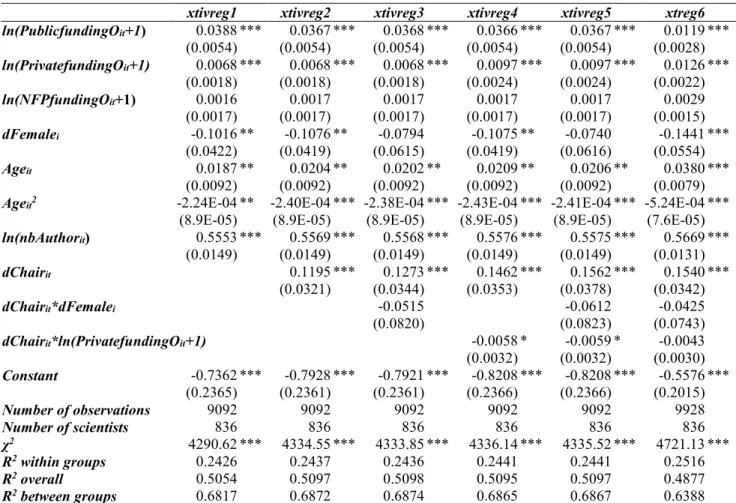
Table 7 - Regression results over matched scientists over the dChair sample (the second stage of 2SLS)
Notes: *, **, and *** show the significance level at 0.1, 0.05, and 0.01 respectively - Year dummies, research division dummies, and university dummies are significant. The minimum year activity, average year activity, and maximum year activity are 2, 10.87, and 12 respectively. The amount of χ2 for Durbin–Wu–Hausman test is 411.79 and significant at level of 0.01, implying that endogeneity exists.
The Durbin–Wu–Hausman test for endogeneity is also done for each set of regressions separately. As explained before, the test first generates the residuals of “public funding” (as a function of all
exogenous variables) and then put them in the original panel OLS model13. By showing that the
coefficient of the residuals is significant, the test revealed the existence of endogeneity. The test is reported in the note of each table, indicating that coefficients of the residuals are significant.
13 For this test we use all variables that are available for regression, like variables in regression 5 of each table.
xtivreg1 xtivreg2 xtivreg3 xtivreg4 xtivreg5 xtreg6
ln(PublicfundingOit+1) 0.0388 *** 0.0367 *** 0.0368 *** 0.0366 *** 0.0367 *** 0.0119 *** (0.0054) (0.0054) (0.0054) (0.0054) (0.0054) (0.0028) ln(PrivatefundingOit+1) 0.0068 *** 0.0068 *** 0.0068 *** 0.0097 *** 0.0097 *** 0.0126 *** (0.0018) (0.0018) (0.0018) (0.0024) (0.0024) (0.0022) ln(NFPfundingOit+1) 0.0016 0.0017 0.0017 0.0017 0.0017 0.0029 (0.0017) (0.0017) (0.0017) (0.0017) (0.0017) (0.0015) dFemalei -0.1016 ** -0.1076 ** -0.0794 -0.1075 ** -0.0740 -0.1441 *** (0.0422) (0.0419) (0.0615) (0.0419) (0.0616) (0.0554) Ageit 0.0187 ** 0.0204 ** 0.0202 ** 0.0209 ** 0.0206 ** 0.0380 *** (0.0092) (0.0092) (0.0092) (0.0092) (0.0092) (0.0079) Ageit2 -2.24E-04 ** -2.40E-04 *** -2.38E-04 *** -2.43E-04 *** -2.41E-04 *** -5.24E-04 ***
(8.9E-05) (8.9E-05) (8.9E-05) (8.9E-05) (8.9E-05) (7.6E-05)
ln(nbAuthorit) 0.5553 *** 0.5569 *** 0.5568 *** 0.5576 *** 0.5575 *** 0.5669 *** (0.0149) (0.0149) (0.0149) (0.0149) (0.0149) (0.0131) dChairit 0.1195 *** 0.1273 *** 0.1462 *** 0.1562 *** 0.1540 *** (0.0321) (0.0344) (0.0353) (0.0378) (0.0342) dChairit*dFemalei -0.0515 -0.0612 -0.0425 (0.0820) (0.0823) (0.0743) dChairit*ln(PrivatefundingOit+1) -0.0058 * -0.0059 * -0.0043 (0.0032) (0.0032) (0.0030) Constant -0.7362 *** -0.7928 *** -0.7921 *** -0.8208 *** -0.8208 *** -0.5576 *** (0.2365) (0.2361) (0.2361) (0.2366) (0.2366) (0.2015) Number of observations 9092 9092 9092 9092 9092 9928 Number of scientists 836 836 836 836 836 836 χ2 4290.62 *** 4334.55 *** 4333.85 *** 4336.14 *** 4335.52 *** 4721.13 *** R2 within groups 0.2426 0.2437 0.2436 0.2441 0.2441 0.2516 R2 overall 0.5054 0.5097 0.5098 0.5095 0.5097 0.4877 R2 between groups 0.6817 0.6872 0.6874 0.6865 0.6867 0.6388
Our results clearly validate our first hypothesis but only partially validate our second hypothesis. One may question whether research chairs in general are an independent contributor to research
productivity or whether they are simply a proxy for other known factors in literature. Considering the literature and mentioned mission or mandate of research chairs, it is possible to argue that holding a chair increases the amount of funding available to scientists.
In our second hypothesis, we make a distinction between the effect of funding and holding a research chair. By matching pairs of chair holders and non-chair-holders who are similar to each other in terms of funding, gender, and research field, we can investigate other aspects of the impact of holding chair such as collaborating with brilliant talents. By estimating the regression model only on matched pairs of scientists, holding a chair cannot be a proxy for the matching criteria (funding, gender, and
research field) anymore. Considering tables 5, 6, and 7, we can verify hypothesis 2 for industrial chairs and research chairs appointed by federal granting councils but this hypothesis cannot be validated for the ‘Canada research chairs’ because its effect is still positive and significant even after matching. In other words, same gender holders of Canada research chairs with equivalent funding and in the same research field as other scientists still generate a greater number of articles than these other scientists.
We should be also very careful regarding measuring research productivity, which is done by counting the number of articles in this research. One may refer to the concept of co-authorship and argue that there be a considerable productivity difference between the person who is sole author and one who is author of paper with some co-authors. We have addressed this issue in our regressions by putting the number of co-authors in the right hand-side. The significant effect of this variable indicates that we have control the positive effect of number of coauthors on research productivity. Furthermore, we have shown the robustness of our analysis in this regard by providing appendices 9-14, in which the
dependent variable is fractional count of articles instead of total number of articles but the number of authors is not in right hand side anymore. This dependent variable only counts proportional
contribution of each scientist. For instance, for an article with 4 authors each scientist adds 0.25 of an article in his/her index. We get the same results for this set of regressions, showing the robustness of our results.
A number of factors can contribute to explaining this finding. The first is that the Canada research chair intends to be a prestigious research sign in Canada. Based on its mandate, the Canada research chair program aims to attract and retain some of most accomplished and promising minds in the world and it is awarded to scientists from all disciplines including engineering and the natural sciences, health sciences, humanities, and social sciences. It is more prestigious than any other research chairs, with the exception perhaps of the newly introduced Canada research excellence chairs, and the holders are expected to be more capable in expanding their collaborative research. Other scientists may also have more willingness to conduct collaborative research with the Canada research chair holders. In addition, the Canada research chair programme grants more visibility to the chair-holders and they can recruit more talented students and researchers.
The second explanation is that industrial chairs are appointed by firms to promote research and its application, probably with major benefits to the firms themselves and as such, serve an entirely different purpose. In other words, this type of chair is not necessarily and originally designed for the sake of scientific publication. The chairs appointed by research councils may have quite similar characteristics. Looking at these chairs’ description, most of chair holders are appointed as industrial chair, partly funded by industry and by the relevant granting council. There is some evidence in the literature indicating that industrial funding forces researchers to shift to more applied research,
neglecting their normative responsibilities for knowledge development (Geuna and Nesta, 2003; Partha and David, 1994).
In addition to the effect of holding a chair on scientific productivity, there are also some interesting results regarding the control variables in econometric model. Funding from different sources is always a positive and significant determinant of scientific productivity before matching14. After
matching, however, the positive effect of funding is only significant for public funding and private funding. We also consider the effect of interaction between “holding a chair” and the amount of funding. From a technical point of view, it is not possible to estimate the interactive effect with an endogenous variable in 2SLS models because its amount is estimated in the first stage and we are not using the raw value reported in dataset. However, we can estimate the effect of the interaction of holding a chair with private funding15.
The effect of this interactive variable is positive and significant for dCRC before and after matching. This suggests that private funding contributes to helping Canada research chair-holder increase their scientific productivity. In contrast, the funding and chair interaction is not significant for
dIndGCChair before matching but negative and significant after matching, hence implying that both
chair-holders and non-chair-holders positively benefit from private funding before matching but after matching this effect disappears. The same story is valid for dChair. The interactive effect of dChair and private funding is positive before matching but negative after matching. Looking precisely at the numbers, the results reveal that private funding has a positive effect before matching but its positive
14 Funding from the private sector and funding from the not-for-profit sector are directly put in the regression equation while funding from the public sector is first estimated by the instrumental variables and then inserted into the regression model. The first stage model regressions, reported in appendices 4 to 9, show the significant role of instrumental variables.
effect is be weakened or even disappears after matching (the combined effect of private funding with its interactive effect is shown in figure 4 for dIndGCChair and dChair after matching).
Figure 4 – Comparison of private funding effect on scientific productivity for different values of dIndGCChair and dChair
Considering the fact that industrial chairs are partially funded by the private sector, we suspect that more private funding for industrial chair-holders may detract the chair holder from scientific
traditional outputs and towards non-scientific and/or more technological and applied outputs such as patents. The negative effect of private funding on scientific productivity finds some echo in the literature (Goldfarb, 2008; Kleinman and Vallas, 2001).
The gender of a scientist has a negative and significant impact, implying that women are less likely to publish than men, another result vastly supported in the literature (Kyvik and Teigen, 1996; Leahey, 2006; Long, 1990). In terms of interaction between chair and gender, we would argue that before matching, this interactive effect is negative and significant for dCRC and dChair but is
non-significant after matching. This would tend to suggest that in general a female scientist may benefit The effect of private funding
for non-IndGCChair after matching (slope=0.0097) The effect of private funding for IndGCChair after matching (slope= -0.0007)
The effect of private funding for non-dChair after matching (slope=0.0097)
The effect of private funding for non-dChair after matching (slope=0.0039)
less from holding a chair than her male colleagues. But when only matched pairs are kept in the dataset, the higher scientific productivity of male chair-holder compared to male non-chair-holder is not different from that of their female colleagues.
The age of the scientists seems to affect scientific productivity negatively before matching and with an inverted-U shape pattern (with a peak around 48 years old) after matching. Such life-cycle and investment motivated behaviour is acknowledged in the literature (Bonaccorsi and Daraio, 2003; Diamond, 1986; Levin and Stephan, 1991). Age loses its significance when scientist pairs are matched based on dIndGCChair, possibly because of smaller size of data for this chair. The results for panel OLS regression are also provided to show that the results of our paper are robust enough (the sixth row of each table).
Conclusion
In this article we show that holding a research chair is a significant determinant of scientific publication when the regression is run over the entire data set of Quebec scientists. As previously explained, a distinction should be made to clarify different attributes of research chairs and their effect on scientific productivity. For instance, the research chair comes with its own funds so the question of interest is whether we can find a positive effect of research chairs on scientific productivity after controlling for the funding obtained by the chair holder. To investigate this relationship, we applied a matching technique to control for gender, funding and research field of chair and non-chair holders. This may indicate whether the effect of holding a research chair on scientific productivity is still significant after controlling for the mentioned attributes.
After such matching, the results show that the effect of the Canada research chair program on scientific productivity remains significant and positive while the effect of industrial chairs and the
chairs appointed by Canada federal granting council (NSERC, and CIHR) become non-significant. This finding highlights the special attributes of the Canada research chair program, which are not replicated in other chairs. Those specific attributes may significantly push scientific productivity. Among others, Canada research chairs are generally associated with some degree of prestige or higher visibility to recruit talented students or to have research collaboration with top scientists in the field. The fact that other types of research chairs, once matched with equivalent scientists, do not have an impact on scientific output in terms of quantity, implies not that these chair holders are lesser scientists, but that they are devoting part of their time to other endeavours of a more practical nature. Hence universities are maintaining a balance between the pursuit of pure scientific knowledge and its application to socio-economic benefits. We are not going to shock anyone by stating that by solely studying scientific articles, we are missing a great deal of the role of university professors. Although not trivial, future research should aim to cast a wider net on outputs, outcomes and impacts of university research.
Based on the discussion in Mirnezami and Beaudry (2015), our research has a number of limitations. First, the data has a number of missing entries, particularly regarding gender and age, there may be some selection bias introduced by this missing information. Second, our study only covers the
province of Quebec and may not be generalised to other parts of the world. Third, in the 2SLS model, we used instruments for public funding, which were the best possible and accessible variables at the time of the study but there may be better instruments such as the size of the department or of the research group. Fourth, we used the number of articles as a measure of scientific productivity, which is appropriate but it cannot completely reflect the productivity of scientists. In addition, the Web of Science does not cover adequately the social sciences and humanities fields.
Let us now make a few suggestions for further studies. The first suggestion is to make a qualitative analysis on the attributes of the research chairs. Gathering data from interviews with chair-holders or surveys filled up by experts would shed some light on how holding a research chair contributes to scientific productivity. Such qualitative work could help investigate the effect of research chair from a social or psychological point of view. Moreover, it would also be possible to find the institutional effect of the research chairs or the impact of peripheral institutional settings on the performance of research chairs.
The second suggestion is to make a comparison between the short-term and long-term effect of research chairs on scientific productivity. Although we understand that some types of research chairs may not have a significant effect on scientific publication (a short-term effect), our research did not make any investigation on how they form networks and accumulate research skills for future studies or how the chairs train the next generation of scientists.
Finally, a third suggestion would be to investigate other types of outputs for research chairs which are not devoted to purely academic endeavours but aimed at a more applied impact. The results for the impact of these types of chairs may be completely different. Our research is therefore limited by the variables used to measure output (of a purely scientific nature).
Acknowledgements
We acknowledge funding from the Canada research chair program. We are grateful for the help of Carl St-Pierre for his advice on statistics and of Vincent Larivière for extracting the data from the OST (Observatoire des sciences et des technologies) database. All remaining errors are our own.