Science Arts & Métiers (SAM)
is an open access repository that collects the work of Arts et Métiers Institute of Technology researchers and makes it freely available over the web where possible.
This is an author-deposited version published in: https://sam.ensam.eu Handle ID: .http://hdl.handle.net/10985/7597
To cite this version :
Jieun KIM, Carole BOUCHARD, N BIANCHI BERTOUZE, Améziane AOUSSAT - Measuring Semantic and Emotional Responses to Bio-inspired Design - 2011
Any correspondence concerning this service should be sent to the repository Administrator : archiveouverte@ensam.eu
J.E. Kim1, C. Bouchard1, N. Bianchi-Berthouze2, and A. Aoussat1 1
Product Design and Innovation Laboratory (LCPI), Arts et Métiers ParisTech, 151 Bd Hopital, 75013, Paris, FRANCE
2
UCL Interaction Center, University College London, 31-32 Alfred Place, London, WC1 E7DP UK
Abstract. This research explores the relation between
specific inspirations such as animals postures and the expressiveness of the design solutions provided by the designers. The prediction of semantic and emotional responses underlying animals’ postures and attitudes might help designers to define design specifications and imagine design solutions with a high expressivity. To address this issue, an experiment was conducted with designers in watching six sets of animal posture images and corresponding product images. This experiment derived quantitative and qualitative results from the combination of cognitive/physiological methods: a questionnaire, Galvanic Skin Reponse (GSR), and eye tracking system.
Keywords: Biomorphism, Animal body posture, PCA
analysis, GSR
1 Introduction
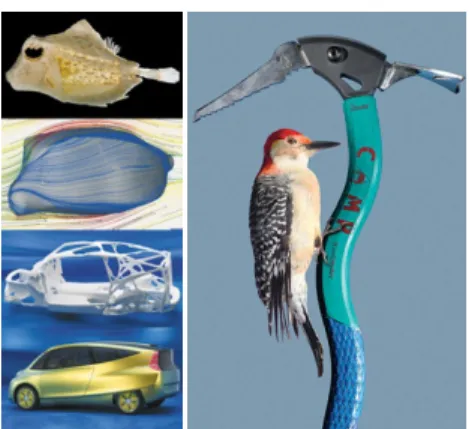
In the early stage of design, designers employ a large variety of types of inspirational sources from different areas: comparable designs, other types of design, images of art, beings, objects, and phenomena from nature and everyday life (Bouchard et al., 2008). These sources of inspiration are an essential base in design thinking such as definition of context, and triggers for idea generation (Eckert and Stacey, 2000). Indeed this kind of analogy helps them to provide a high expressivity, a high level of creativity, and a high emotional impact into the design solutions (Wang, 1995; Djajadiningrat, Matthews, and Stienstra, 2007). Remarkably, among the various sectors of influence used by the designers, biologically inspired design proved to be a very efficient and creative way of analogical thinking (Helms, Vattam, and Goel, 2008). Some authors already demonstrated the positive effect of biological examples in idea generation (Wilson and Rosen, 2009). Especially, the use of animal analogies has proved to be very efficient for designers (see Figure 1). In some specific fields of design such as vehicle design animal analogies are prominent in the cognitive processes.
Fig. 1 Boxfish Mercedes Benz Bionic Car (Left), CAMP
Woodpecker Ax (Right)
Up to date, however, there has been no study at the best of our knowledge that investigate the relationship between the semantic and emotion expressed by the inspirational source (e.g., an animal posture) and the emotions that the inspired design elicits in consumers. This is what our explorative study aims at.
This aim necessarily raised a question about assessment methods of semantic and emotional responses. In many cases, the cognitive measurement based on semantic differential approach has been extensively applied in emotional design and Kansei engineering. This cognitive approach has also been employed to assess the emotional responses. In particular, Self Assessment Manikin of Lang (1997) is a pictorial questionnaire in terms of arousal, valence, and dominance. In addition, a lexical emotional feeling, including a list of 50 emotional reaction proposed by the Psychology department of the Geneva University (1988) in Mantelet (2006) enables to evaluate emotional responses in a questionnaire. Even though the cognitive approach is relatively simple, cheap and quick measurement, questions have been raised about some disadvantages to apply. First, cognitive measurement is not able to assess in real time; and it is hard to catch objectively a subtle emotional state. In addition, the use of emotional
6 J.E. Kim, C. Bouchard, N. Bianchi-Berthouze and A. Aoussat scales which often contains a long list of emotion adjectives might cause respondent fatigue. Moreover some of respondents have difficulties in to expressing their feeling because they are not always aware of them and/or certain pressure from social bias (Poels and Dewitte, 2006).
In order to account for the limitation of cognitive measurement of emotional responses, recent studies in Kansei engineering start to triangulate these measures with physiological responses such as Electromyography (EMG), Galvanic Skin Resistance (GSR), heart rate and electroencephalography (EEG) etc. Undoubtedly, unnatural, obstructive and heavy instrument might interfere with respondent’s natural way of design and influence on the results; however, applying physiological measurement under careful consideration could deepen our understanding of some respondent’ unconscious emotional process (Tran et al., 2003; Gaglbauer et al., 2009).
Hence, for the purpose of measuring semantic and emotional responses in front of bio-inspired design, we intended to apply both cognitive and physiological measurement in our experiment. The use of specific instruments and protocol are described in Part 2. Both qualitative and quantitative results are presented in Parts 3 and 4. Finally, the paper concluded by suggesting future work and by including some considerations regarding the need for deepening on this study.
Original research advances will be provided in the following areas: cognitive/physiological evaluation and prediction of emotions from postural information.
2 Design of Protocol Study
2.1 Cognitive measurement : Questionnaire
From the work done by Mantelet (2001), we have developed a questionnaire by following five steps:
Definition of the Image stimulus, Definition of the lexical corpus (emotions, semantic adjectives),
Definition of the questionnaires (Java algorithms), Data gathering, Data analysis, and interpretation of the results.
2.1.1 Definition of the Image stimulus
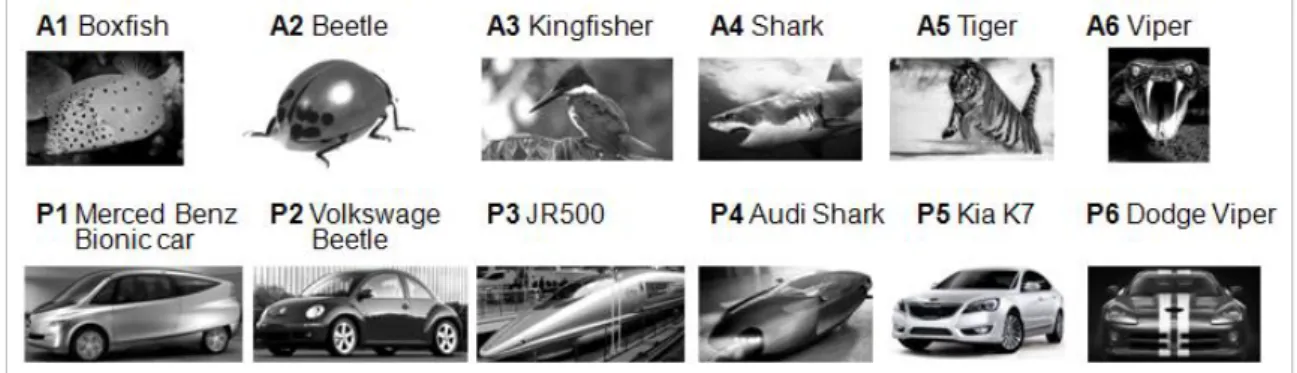
As the first step, we gathered six sets of bio-inspired design examples (see Figure 2). The criteria of selecting image stimulus was the name of vehicle such as Beetle from Volkswagen (A2-P2), Audi Shark (A4-P4) and Dodge Viper from Chrysler (A6-P6), and also the similarity of animal body posture selected by designers.
All images stimuli were presented to participants in grey scale with a resolution of 1024x768. Under highly controlled conditions, participants could concentrate on the given images so that we could minimize other possible interruptions, including chromatic effect and experimental environment etc.
2.1.2 Definition of the lexical corpus (emotions, semantic adjectives)
The four designers were asked to provide a list of semantic descriptions by manually annotating the set of images. In order to explore the link between the inspirational source and the product, designers were divided in two groups. One group was asked to annotate the six inspirational source images (A1~A6), the other group was asked to provide a set of semantic descriptions to describe the product images (P1~P6). Finally, the semantic descriptions retained are as follows:
• Semantic descriptions for inspirational source (A1~A6): Elegant, Appealing, Soft, Powerful, (Lively), Rapid (Speed), Sharp, Aggressive, Fluid, Light
• Semantic descriptions for product (P1~P6):
Angular, Aggressive, Retro, Appealing, Light, Organic, Sportive, Futuristic, Aerodynamic, Natural
asked to provide the emotional terms elicited in the same set of images. Since emotional terms which reflect secondary emotion are relatively hard to express in lexical way, a lists of 20 emotional terms extracted by Geneva university (1988) was made available to the designers during the annotation process. The designers were however free to use any emotional terms even if not in the provided in the list.
The retained emotional terms were: amused, calm,
pleasure, inspired, stimulated, anguished, indifferent, doubtful, astonished, and tender. In addition, the
designers were asked to evaluate the images in terms of valence and arousal by using the Self-Assessment Manikin (SAM) scales of Lang (1997).
2.1.3 Definition of the questionnaire
The questionnaire consists of three types of slide:
Preparation slide, Stimuli slide and Rating slide.
• The Preparation slide is a blank page in order for the participants to rest and stabilize their emotional state before watching the next stimuli slide.
• The Stimuli slide holds each image stimulus chosen in Figure 2.
• The Rating slide consists of three types of questionnaire.
- The Self-Assessment Manikin (SAM) scales of Lang (1997) in terms of valence and arousal with its pictorial image.
- The list of 10 emotional terms to be rated on 5-point rating scales (from 1= ‘Not at all’ to 5 = ‘Very much’) each.
- The list of 10 semantic descriptions (either for product or for inspirational source) to be rated on 5-point rating scales (from 1= ‘Not at all’ to 5 = ‘Very much’) each.
Following Lang’s method (1997), each test began with a preparation slide that lasted for 5 seconds. Then, a stimuli slide was presented for 6 seconds. Finally, the participants were asked to fill in the questionnaire in the rating slide. During the rating slide, a small thumbnail image was displayed for helping the designer’s evaluation process. The 11s loops (Preparation slide Æ Stimuli slide) were the same for each image stimulus. Once rating slide was over, the computerized preparation slide was then activated until all images stimuli to be rated.
Instead of using paper based questionnaire, the questionnaire was integrated in SMI eye tracking system (Figure 3b). This method enables to collect participant’s simultaneous responses during task through recording eye movement and facial expression. Most of all, it enables to record
physiological data could synchronize with questionnaire.
2.2 Physiological measurement: Galvanic skin response (GSR)
For our exploratory study, a selection of physiological measurements was essential to detect emotional responses of bio-inspired images and identify a correlation between cognitive measurement and physiological measurement. Our criteria to determine the biosensors were non-obstructiveness, easy interpretation of signals and high reliability.
Hence, we intended to apply galvanic skin response (GSR) which could indicate effective correlation to arousal. Significant advantage of GSR is that GSR could provide continuous information and detect very sensitive amount of arousal (Tran et al., 2007; Gaglbauer et al., 2009).
In addition, even though, the results from eye tracking system will not be described in this paper, we expect that a physiological phenomenon gathered by eye tracking system such as fixation number/duration, pupil size, and blink rate/duration could provide supportable results.
In order to employ GSR, the two GSR electrodes were places on two fingers of the left hand. Changes in the skin conductance were collected at 200Hz per second. Using the BIOPAC acquisition unit and the software BSLPro 3.7, we could ampify the collected signal and visualize it (Figure 3).
(a) GSR (b) SMI Eye-tracking & Biopac system
Fig. 3. System setup
2.3 Data gathering
Six master degree product designers in laboratory CPI have been involved in our exepriment. They were all French students (Five females and one male). Paricipant were divided in two groups: one group was to rate inspirational source (A1~A6), the other was to rate product image(P1~A6).
Generally, the experiment took in average 17,14 minutes (standard deviation was 2,1 minutes) .
6 J.E. Kim, C. Bouchard, N. Bianchi-Berthouze and A. Aoussat 2.4 Data analysis
The data from the questionnaires were analyzed by Principal Component Analysis (PCA). PCA was employed separately to the data from the rating of the inspirational sources and the data from the rating of the product images. The aim was to explore the way semantic and emotional terms used to rate the correlations between semantic and emotional responses (Mantelet, 2003; Bouchard et al., 2008; Nagamachi et al., 2009).
In order to analyze GSR responses, first, the segment of 11 seconds corresponding to the preparation and stimuli slides were extracted. Next, as large inter-individual differences were expected, we normalized the GSR values [0,1] each using the following formula: Normalized_GSR= (original_GSR - max_GSR) / max_GSR. Finally, the normalized GSR values of six participants were averaged in time.
3 Results
3.1 Correlation of semantic descriptions
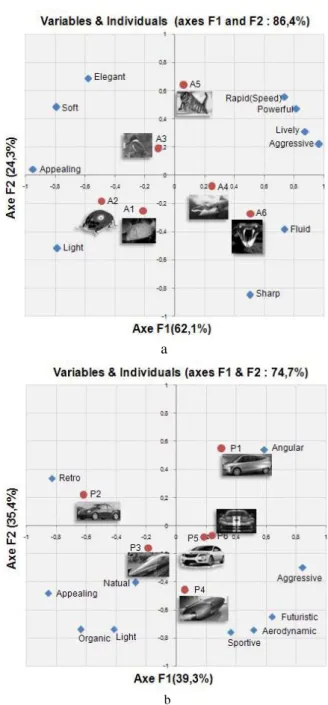
Figure 4 shows the position of the ten semantic descriptions (blue diamond) and the images (red dot) each in the extracted principal component sphere. Given that cumulative contribution of PCA shows the correlations between semantic descriptions, two factors (F1&F2) can explain 86,4% of the data concerning the animal images (Figure 4a). In case of the product image (Figure 4b), the contributions are focused on 74.1% for two factors (F1&F2). Both cases have a common axis which represents ‘aggressive – appealing’.
With regard to the interpretation of axis, we found that there are some differences about inspirational sources (animal) and product image. For example, in case of animal sources (Figure 4a), semantic description aggressive was very close to rapid (speed),
powerful and lively. On the other hand, the notion of aggressive about product image was closer to sportive, futuristic, and it was far from retro.
In case of product images (Figure 4b), semantic description appealing was close to soft and elegant and far from sharp. In case of product image,
appealing was more linked to natural, organic and light and far from angular.
Between the relation of inspirational source and product, we could observe the strong similarities in terms of semantic descriptions between A2-P2, A4-P4 and A6-P6.
a
b
Fig. 4. a. PCA of semantic descriptions on animal image; b.
PCA of semantic description on product image 3.2 Correlation related to emotional terms
In order to identify the correlation related emotional terms, we also applied PCA analysis of emotional terms on the inspirational source image and product image. As shown in Figure 5a, the contributions were focused on F1 (20.4%) and F2 (47.8%), totally 68.2% for two factors. The principal axes were confirmed
positive-negative and high-low arousal.
The results show that positive valence reflects some complementary emotions including: pleasure,
amused, in anguished assigned t P6 receive Figure 4 value for slide and respective image. Th the paired images (A product im As GSR usually as the peak Specifical augmentat (animal – As show images (re for the pr Beetle (P2 images st suddenly Most inter image stim even thou Given th correspon A6-P6 im GSR data correlation A5-P5. nspired, and t d and astonish to A4-P4 and P ed lower ratin 4(b) shows t 11 seconds i.e 6 seconds fo ely by the w his graph emp d images. A A1~A6) and a mages (P1~P6 R sensors mea ssociated with and troughs lly, we an tion tenden product) in w wn in Figure 5 esting state) w roduct image 2). The norma tarted at low increased and resting finding muli arrive at gh the rising t he correlatio ding product mages have sig
in time. How n of GSR dat
tender. High hed. High aro
P5. Relatively gs.
the normalize e., 5 seconds f
r the stimuli white and gre
ployed the sam dotted line r a continuous l 6). asure skin co h arousal, we s of GSR d alyze a si ncy between watching stimu 5b, the baseli was always hig
es except for alized average w level; how d show a peak g is that the G similar peek time of GSR d on of anim t images, A2 gnificantly sim wever, it was h ta between A a arousal relate ousal ratings w y, A3, A5, P2, ed average G for the prepara
slide as indic ey region of me color code represents an line represents onductivity w e are intereste data (Figure milar ampli n paired-im ulus slide. ne for the an gher than the the Volkswa e GSR of pro wever GSR k in stimuli s GSR data of al value (around data was diffe mal images 2-P2, A4-P4, milar tendenc hard to explain A1-P1, A3-P3, ed to were , and GSR ation cated f the e for nimal s the which ed in 5b). itude mages nimal ones agen oduct data slide. ll the d 1), rent. and and cy of n the and Fig. corr aver
4 D
4.1 imp In o the and sem met inte from was As A4-stat aug the Thi poin Fir ima phy Vol fam nam con in t cap corr exp . 5. a. PCA of responding prod rage GSR for 1Discussion
Various aspe pact on bio-in our specific e relation betw d product imag mantic responthod was emp erpretation of m cognitive a s a crucial fact s mentioned a -P4, and A6-P e in both P gmentation ten other pairs c s may be par nts. rst, we assum age might i ysiological ev lkswagen Bee mous biologica me and the nfirmed with h terms of sem arison, the pa relation in bo lanation for b f emotional term duct images; b. 1 seconds
ects for measu nspired design experiment, w ween body po ge, in conjunt nses. A cogni loyed to answ f results throu approach and tor. above, some P6) have show PCA results ndency (Figu cannot give a rtly explained med that a l influence on valuation. In etles (P2) and al inspired ca advertisement high correlatio mantic and e airs of A3-P3 oth PCA resu this, since th ms for animal Change of the uring emotio n we attempted osture of anim tion with emo
itive and phy wer those issus
ugh balancing physiologica paired image wed a common and similar ure 4 and 5). any remarkab d by the follo level of reco n both cogn n our exper d beetles imag ar through the t, the experi on between tw motional resp 3 and A5-P5 ults and GSR he participant images and e normalized onal to explore mals image tional and ysiological ses. Hence, g the data l approach es (A2-P2, n emotional amplitude However, ble results. owing two ognition of nitive and riment, as ges is very eir original iment also wo images ponses. In have little R data, An ts were all
6 J.E. Kim, C. Bouchard, N. Bianchi-Berthouze and A. Aoussat French student, they were not relatively aware of P3 (JR500-Japan) and P5 (Kia K7-Korea).
Second, the finding raised some issues about methodological condition. Given that the presenting image size was all unified in screen size (1024*768 resoultion), this led the lack of consideration on a real size of animal and product. Those images can not sufficiently express their own semantic and emotional attibute. We found that tiger image (A5) and viper image (A6) cannot sufficiently convey their attitude and impression from a posture.
5 Towards modeling the attitude and
posture of animals
Previous behavioral studies have been discovered human body posture and movement as an important affective communication channel. Berthouze et al. (2003) recently reviewed the state of the art on this topic. According to Mehrabian and Friar (1969), changes in a person's affective state in the work done by are reflected not only by changes in facial expressions but also by changes in body posture. They found that bodily configuration and orientation are significantly affected by the communicator's attitude toward her/his interaction partner. Ekman and Friesen (1967) have hypothesized that postural changes due to affective state aid a person's ability to cope with the experienced affective state.
Despite those studies, there has not some studies focused on the attitude and posture of animal and its emotion. Only few studies have been pioneered to explore ‘pleasant’ and ‘threatening (fear)’ animals, plant, fruits, or flowers (Hamm, Esteves, and Öhman, 1999; Tripples et al., 2002; Field and Schorah, 2007). Meanwhile, this interest led to create models that maps body expression features into emotional states. According to Rudolph Laban (1988), various types of approaches have been taken to measure postures and movement and statistically study this relationship. Wallbot (1998) showed the existence of emotion-specific body-expression patterns that could be partially explained by the emotion dimension of activation. Using motion-capture techniques and an information-theory approach, Berthouze et al. (2003) identified a set of body configuration features that could be used to discriminate between basic emotion categories.
As our next step, we are planning to follow the approach proposed by Berthouze (2003), to perform a more thorough analysis of the shape of the product and of the animal posture to identify particularly expressive postures and attitudes features (e.g. angle
between body segments, muscle tension) and body parts that are responsible for these responses.
Finally, those studies would enable to develop computer aide design (CAD) tools. These CAD tools will help designers to generate expressive and user-friendly design solutions for the consumers. We hope new designs will appear on the market in the future, which is oriented towards more pleasurable products in the sense of D. Norman (2002).
6 Conclusion
This study aimed to explore the relation which establishes a formal connection between bio-inspired sources and the design solutions produced by the designers in specific fields such as car design. Further study must be needed toward creating computational models to predict emotional/semantic responses to body posture of animals, in order to provide design rules based on analogical reasoning through biomorphism. In short term, we will investigate to refine the results from physiolgocial signal not only through GSR signal, but also eye tracking incuding fixation number and duration, eye-blinking frequency, pupil dilation, etc. during stiluli slide.
In terms of research impact, the results of our approach will benefit several disciplines such as emotional design, marketing, innovation science, psychology and robotics.
In the field of design, as a growing trend is emerging toward the emotional design and pleasurable products, this promises friendlier world of products and services, with more attention paid to the human beings. In addition, this interest is also a manner of increasing the degree of creativity and innovation into the design and engineering design processes. Moreover the comparison between different ways of measuring emotions about specific stimuli will also be of great interest for the discipline of psychology. Finally, the field of robotics which already integrates some advances in the field of biomimicry (applied to robots behaviors) could benefit of these new results in order to improve the look and user-friendliness of the robots.
Acknowledgments
The authors wish to thank the designers from LCPI, Arts et Metiers ParisTech who participated in our experiment. Special thanks to Dr. Florent Levillain, Laboratory of Cognition Humaine & ARTificielle (CHArt), University Paris8 for sharing his expertise in analyzing the physiological data.
References
Bouchard C, Mantelet F, Aoussat A, Solves C, Gonzalez J. C, Pearce K, Coleman S, (2009). A European Emotional Investigation In The Field Of Shoes Design. International Journal Of Product Development, Special Issue On Kansei Engineering And Emotional Design, 7(1-2):3-27
Bianchi-Berthouze N, Kleinsmith A, (2003). A categorical approach to affective gesture recognition, Connection Science, 15: 259-269
Coulson M, (2004). Attributing emotion to static body postures: Recognition accuracy, confusions, and viewpoint dependence. Journal of Nonverbal Behavior, 28:117-139.
Djajadiningrat T, Matthews B, Stienstra M, (2007). Easy doesn’t do it: skill and expression in tangible aesthetics, Personal and Ubiquitous Computing 11:657–676
Eckert C, Stacey M, (2000). Sources of inspiration: a language of design, Design studies, 21(5):523-538 Ekman P, Friesen W, (1967). Head and body cues in the
judgment of emotion: A reformulation. Perceptual and Motor Skills, 24:711-724
Field AP, Schorah H, (2007). The verbal information pathway to fear and hear rate changes in children. Journal of Child Physiology and Psychiatry, 48(11):1088-1093
Ganglbauer E, Schrammel J, Deutsch S, Tscheligi, M, (2009). Applying Psychophysiological Methods for Measuring User Experience: Possibilities, Challenges and Feasibility. UXEM’09
Geneva Emotion Research Group, (1998) Appendix F. Labels describing affective states in five major languages.http://www.unige.ch/fapse/emotion/resmate rial/resmaterial.html
Globich J, Hamm, AO, Esteves F, and Öhman A, (1999). Fear appears fast: Temporal course of startle reflex potentiation in animal fearful subjects, Psychophysiology, 36:66–75
Helms ME, Vattam SS, Goel AK, (2008). Problem-Driven and Solution-Based Design: Twin Processes of Biologically Inspired Design. In ACADIA08
Conference
Jenkins S, Brown R, Rutterford N, (2009). Comparing thermographic, EEG, and subjective measures of affective experience during simulated product interactions. International Journal of Design, 3(2):53-65
Laban R, (1988). The mastery of movement. Princeton, Lang PJ, Bradley MM, Cuthberth BN, (1997). International
affective picture system(IAPS):Technical Manual and Affective ratings. In NIMH Center for the Study of Emotion and Attention.
Mantelet F, (2006). Prise en compte de la perception émotionnelle du consommateur dans le processus de conception de produits. Ph.D Thesis, Arts et Metiers ParisTech, France.
Mehrabian A, Friar J, (1969). Encoding of attitude by a seated communicator via posture and position cues. Journal of Consulting and Clinical Psychology, 33:330-336
Mougenot C, Bouchard C, Aoussat A, Inspiration, Images And Design: A Field Investigation Of Information Retrieval Strategies By Designers, Journal Of Design Research, 7(4):331-351
Nagamachi M, Tachikawa M, Imanishi N, Ishizawa T, Yano S, (2008). A successful statistical procedure on kansei engineering products. Electronic Conference Proceedings.
Picard RW, Vyzas E, Healey J, (2001) Toward machine emotional intelligence: Analysis of affective physiological state. IEEE Transactions Pattern Analysis and Machine Intelligence, 23:1175–1191 Poels K, Dewitte S, (2006). How to capture the heart?
Reviewing 20 years of emotion measurement in advertising. In Journal of Advertising Research Tipples J, Young AW, Quinlan P, Broks P, Ellis AW,
(2002). Searching for threat. The quarterly journal of experimental psychology section A, 55(3):1007-1026 Tran TQ, Boring, RL, Dudenhoeffer DD, Hallbert BP,
Keller MD, Anderson TM, (2007). Advantages and Disadvantages of Physiological Assessment For Next Generation Control Room Design, Human Factors and Power Plants and HPRCT 13th Annual Meeting, IEEE 8th, 259-263
Van den Broek EL, Westerink JHDM, (2009). Consideration for emotion aware consumer products. Applied Ergonomics, 40:1055-1064
Wallbott HG, (1998). Bodily expression of emotion. European Journal of Social Psychology, 28:879-896 Wang H, (1995). An approach to computer-aided styling,
Design Studies, 16(1):50-61
Wilson JO, Rosen D, (2010). The effects of biological examples in idea generation, Design Studies, 31(2):169-186