Université de Montréal
The accuracy and reliability of plaster vs digital study models: A comparison of three different impression materials
par Bradley Lands
Section d’orthodontie Faculté de médecine dentaire
Mémoire présenté à la Faculté des études supérieures en vue de l’obtention du grade de M.Sc.
en médecine dentaire option orthodontie
Avril, 2010
Université de Montréal
Faculté des études supérieures et postdoctorales
Ce mémoire intitulé :
The accuracy and reliability of plaster vs digital study models: A comparison of three different impression materials
présenté par : Dr Bradley Lands
a été évalué par un jury composé des personnes suivantes :
Dr Jack Turkewicz président-rapporteur Dr Daniel Fortin directeur de recherche Dr Claude Remise codirecteur Dr Réjean Labrie membre du jury
Résumé
Introduction: Le but de l’étude était d’examiner l’effet des matériaux à empreintes sur la précision et la fiabilité des modèles d’études numériques. Méthodes: Vingt-cinq paires de modèles en plâtre ont été choisies au hasard parmi les dossiers de la clinique d’orthodontie de l’Université de Montréal. Une empreinte en alginate (Kromopan 100), une empreinte en substitut d’alginate (Alginot), et une empreinte en PVS (Aquasil) ont été prises de chaque arcade pour tous les patients. Les empreintes ont été envoyées chez Orthobyte pour la coulée des modèles en plâtre et la numérisation des modèles numériques. Les analyses de Bolton 6 et 12, leurs mesures constituantes, le surplomb vertical (overbite), le surplomb horizontal (overjet) et la longueur d’arcade ont été utilisés pour comparaisons. Résultats : La corrélation entre mesures répétées était de bonne à excellente pour les modèles en plâtre et pour les modèles numériques. La tendance voulait que les mesures répétées sur les modèles en plâtre furent plus fiables. Il existait des différences statistiquement significatives pour l’analyse de Bolton 12, pour la longueur d’arcade mandibulaire, et pour le chevauchement mandibulaire, ce pour tous les matériaux à empreintes. La tendance observée fut que les mesures sur les modèles en plâtre étaient plus petites pour l’analyse de Bolton 12 mais plus grandes pour la longueur d’arcade et pour le chevauchement mandibulaire. Malgré les différences statistiquement significatives trouvées, ces différences n’avaient aucune signification clinique. Conclusions : La précision et la fiabilité du logiciel pour l’analyse complète des modèles numériques sont cliniquement acceptables quand on les compare avec les résultats de l’analyse traditionnelle sur modèles en plâtre.
Abstract
Introduction: The purpose of this study was to examine the effects of different impression materials on the accuracy and reliability of digital models. Methods: Models from 25 patients selected at random from the files of the Department of Orthodontics at the University of Montreal were used in this study. One alginate (Kromopan 100 alginate, Italy), 1 alginate alternative (Alginot, Kerr Dentistry, Orange, CA), and 1 PVS (Aquasil, Dentsply Caulk, Milford, DE) impression was taken of both arches of each patient and sent to Orthobyte (Othobyte Digital Technology inc., Calgary, AB) for fabrication of a plaster model and scanning for production of a digital model. The Bolton 6 and 12 analyses and their constituent measurements, overbite, overjet, and arch length were used for the comparison. Results: The repeatability of measurements using both the plaster and digital methods was good to excellent, with the plaster measurements tending to be more reliable. There were statistically significant differences in the Bolton 12 and mandibular arch length and spacing measurements for all impression materials, with the plaster models tending to give a smaller measurement for the Bolton 12 and a higher measurement for the mandibular arch length and spacing. Although statistically significant differences in some measurements were found for the reliability and validity of digital models, none was clinically significant. Conclusions: The accuracy and reliability of the software for comprehensive cast analysis is clinically acceptable and reproducible when compared with traditional plaster study model analysis.
Table of Contents
RÉSUMÉ ... III ABSTRACT... IV TABLE OF CONTENTS ... V LIST OF TABLES ... VI LIST OF FIGURES ... VII ABBREVIATIONS ... VIII DEDICATION... IX ACKNOWLEDGEMENTS... X CHAPTER I ... 2 INTRODUCTION... 2 CHAPTER II ... 5 LITERATURE REVIEW... 5 CHAPTER III... 19
PURPOSE, QUESTIONS, AND HYPOTHESES... 19
The purpose of the present study... 19
Research Questions ... 19
Study Hypotheses ... 20
CHAPTER IV ... 22
MATERIALS AND METHODS... 22
Sample selection ... 22 Patient casts ... 22 Instrumentation... 23 Data collection ... 23 Reliability analysis ... 25 Statistical Analysis... 26 CHAPTER V ... 28 ARTICLE... 28 CHAPTER VI ... 43 DISCUSSION... 43 Clinical Interest ... 43 Clinical Findings ... 44
Limitations and Future Possibilities ... 47
CHAPTER VII ... 49
CONCLUSION... 49
APPENDIX I ... 52
APPENDIX II... 55
List of Tables
TABLE I. INTRAEXAMINER ICC, DAHLBERG STATISTIC AND BLAND-ALTMAN ANALYSIS TO EVALUATE REPRODUCIBILITY OF MEASUREMENTS FOR PLASTER AND DIGITAL ... 34 TABLE II. INTRACLASS CORRELATION COEFFICIENT TEST BETWEEN THE PLASTER AND DIGITAL MODELS... 35 TABLE III. THE BLAND-ALTMAN ANALYSIS COMPARING THE PLASTER AND DIGITAL MODELS ... 36 TABLE IV. DAHLBERG STATISTIC COMPARING THE PLASTER AND DIGITAL MODELS ... 36 TABLE V. RESULTS OF PAIRED T-TEST BETWEEN PLASTER AND DIGITAL MODELS ... 37 TABLE VI. INTRACLASS CORRELATION COEFFICIENT COMPARING ALL MODELS TO THE ORIGINAL MODELS ... 52 TABLE VII. INTRACLASS CORRELATION COEFFICIENT COMPARING
INDIVIDUAL TEETH MEASUREMENTS WITH THE ORIGINAL TEETH
MEASUREMENTS... 53 TABLE VIII. INTRACLASS CORRELATION COEFFICIENT COMPARING PLASTER AND DIGITAL MEASUREMENTS FOR INDIVIDUAL TEETH ... 54
List of Figures
Figure 1. Digital and Plaster Models ...55
Figure 2. Electronic calipers and milimetric ruler ...55
Figure 3. Staley’s method for determining arch length ...55
Figure 4. Digital and conventional intermolar distance...56
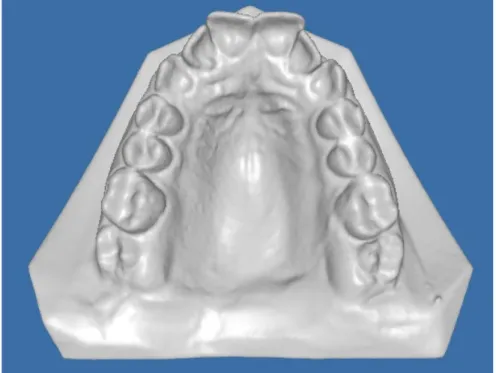
Figure 5. Lower resolution in mandibular incisor area...56
Figure 6. Poorly defined contact areas ...57
Abbreviations
3-D: Three Dimensions CD: Compact Disk
Cl: Class, referring to molar relationship et al: et alter, “and others”
ICC: Intraclass Correlation Coefficient mm: Millimeters
Dedication
I would like to dedicate this work to my parents, Michael and Leona, my sister, Jamie and my fiancé, Jennifer. You have always been behind me throughout my years of study. Through the ups and the downs, coming home and speaking with you has always been the best part of my day. While you may not always understand and will never ask for any credit, all of my accomplishments are our shared effort. Thank you.
Acknowledgements
I would like to express my appreciation to the following individuals for their assistance in making this project possible:
Dr. Daniel Fortin for his enthusiasm and dedication to this project.
Dr. Claude Remise for his help with this project and also for his dedication and enthusiasm in teaching orthodontics.
Mr. Pierre Rompré for his assistance with the statistical methods and analysis.
Dr. Jack Turkewicz for being such a thorough editor and for his never -ending patience.
Dr. Réjean Labrie for his help with my thesis and for being an outstanding clinical faculty member.
Ms. Christina Kerr of Orthobyte Digital Technologies inc. for her technical support and assistance in preparing the study sample.
Chapter I
Introduction
The paperless office is now a reality and although the transition has been slow, it has been steady. Patient charts, photographs and radiograph films are being replaced by practice management software. This software allows the practitioner to integrate patient records including digital photographs and radiographs, as well as administrative functions, including referral letters, patient billing, scheduling and payroll. In orthodontic offices the plaster model is fast becoming the last physical record of the patient that we maintain.
Orthodontic diagnosis and treatment planning requires the interpretation and assimilation of the doctor’s clinical impressions, photographs, radiographs and study models. Study models are an important part of orthodontic patient records both pre- and post- treatment. Plaster models are the current gold standard and are included in the recommended records suggested by the American Association of Orthodontists [1]. Study models represent a static record of the patient; they are essential for diagnosis and treatment planning, interdisciplinary communication, case presentation and evaluation of progress and results. Over the last 10 years, several companies have begun to offer digital model services. These are computer systems that generate three dimensional digital study models. In addition to being the last component of the fully electronic patient chart, these computerized systems open a new realm of orthodontic diagnosis [2]. Perhaps the most important benefit of using digital models is the ability to share and exchange information effectively, eliminating the need to physically store and manually retrieve stone models [3].
Accurate measurements made on the study models are an important part of diagnosis and treatment planning and the measurements are more easily made on the casts than in the oral cavity. Tooth width is an essential measurement that is used in various analyses to determine available space and tooth-size discrepancies. According to Proffit, approximately 5% of the population presents some degree of disproportion among the sizes of individual teeth [4]. Freeman et al. found that 30.6% of cases presented a significant anterior discrepancy while 13.5% presented with a first molar to first molar discrepancy [5]. These analyses are important tools in treatment decisions including whether or not teeth should be extracted, reduced interproximally or inclined to a different standard. In order to achieve ideal treatment results, maxillary and mandibular teeth must be proportional in size. An inter-arch discrepancy will prevent the achievement of an ideal occlusion [4]. For this reason, tooth size and space analysis should be performed for each case.
When contemplating the changeover from plaster to digital models, the orthodontist must weigh the advantages and disadvantages of each system. These will be reviewed in the next section. The hardest part of the switch may be physically letting go of the plaster models. In order for the transition to be smooth, digital models must be as accurate and reliable as their plaster counterparts.
Chapter II
Literature Review
We are well within the information age and the health profession is now beginning to fully embrace it. Digital technology has revolutionized the storage and retrieval of orthodontic records. Digital photographs and radiographs have become routine and leave little question as to their quality. Digital study models are undoubtedly going to become very useful in the future [6]. The emerging field of information technology as it pertains to orthodontics deals with the storage, retrieval, sharing and optimal use of orthodontic, orthognathic and dentofacial orthopedic information of the craniofacial region for decision making and problem solving [7]. The orthodontic study model is the last component of the orthodontic record to undergo this transition.
Study models have traditionally served two main purposes in orthodontics: a permanent three-dimensional record of the malocclusion and as a source of information for diagnosis and treatment planning [2]. Several features contribute to their usefulness: 1) production is routine and predictable, 2) they are easy and inexpensive to produce, 3) they are easy to examine and measure, 4) they can be mounted to simulate the articulation, and 5) they are the only three-dimensional medium available to accurately represent the occlusion [3]. In fact, orthodontic study models have been deemed by some to be the most important patient record for treatment planning [8-10]. Han et al. [11] found that in over 50% of cases, study models alone were enough to provide adequate information for treatment planning and that further patient records made only small differences when added incrementally. Others have called into question the importance of study models in treatment planning. Callahan [12] found
that treatment plans based on digital photographs, panoramic radiographs and lateral cephalometric radiographs did not change when plaster casts were given to a group of orthodontists. Despite this recent report, orthodontic cast analysis remains an integral part of the standard of care in the field.
Routine measurements are easier to perform on study models than direct intra-oral measurements [13]. Common measurements and analyses include; tooth size – arch length discrepancy (crowding), Bolton tooth size analysis [14, 15], overbite, overjet, midline concordance, curve of Spee and arch width. Traditionally, a Boley gauge (Vernier calipers) or needle dividers have been used to perform the measurements and are the standard to which newer methods are compared [5, 14-18]. More recently, digital calipers have been used [19-23].
Unfortunately, due to their physical nature, plaster casts have inherent shortcomings in terms of storage, retrieval and diagnosis [2]. They can also be lost or damaged and are troublesome to reproduce and transfer, making communication in multidisciplinary cases difficult [3, 24]. The storage of plaster models has long been a problem in orthodontics. The key concerns with model storage centre around office space, off-site storage, and the length of time models must be kept. Traditionally, space in the office will be allocated for models of active patients and those who have recently completed treatment. Other models are stored off-site, at home or at a storage facility for a fee. It has been determined that 100 plaster models require three linear feet of space when stored in boxes that can hold 4 sets [25]. Put differently, if the records were to be put in storage at a rate of 250 patients per year for a period of 36 years (almost 9000 patients), an orthodontist would need almost 450 feet of linear space to store those
models. For an orthodontist in practice 6 to 10 years the current median case starts is 256 per year with an average of 500 active patients [26]. Because of the weight and size of these models it is easy to see that they can be easily damaged, particularly if space is at a premium and models must be kept outside the clinic. When space becomes an issue, models are often discarded. One study found that 80% of orthodontists experience storage problems and 25% keep completed cases at off-site facilities [27]. Once the necessary space has been found, how long must the records be maintained? The answer to this question varies greatly, anywhere from 5 to 15 years, depending on where the practice is located. In the United Kingdom model storage is clearly defined. All models must be kept for 11 years or 7 years after the age of majority (25 years old) [27]. According to the American Association of Orthodontists, the length of time records must be kept is state-dependent. However, they admit that there is some open interpretation as to when statutes begin, therefore their position is that the safest manner to handle the dilemma is to retain records indefinitely [1]. This perspective has been echoed by several authors [25, 27, 28], which may lead some to believe that this is the most prudent course of action.
Over time, other methods for measuring dental casts have been developed [29-32]. Measurements made on dental casts have been compared with those obtained from photocopies of the casts [29, 31]. Although the technique is simple, it is not as accurate as the manual technique with cast and gauge. Further, a plaster model is still required and measurements are made on a 2-dimensional representation of a three dimensional object. Martensson and Ryden [32] examined a holographic system for measuring dental casts, which they believed would alleviate storage requirements. The method was shown to be more precise than some previous methods. However,
none of these systems have proven to be practical in clinical settings and they have not gained in popularity [18].
The search for alternative methods to replace plaster casts has intensified with recent advances in technology and the push towards the digital office. Yamamoto et al [33], developed an optical method for creating three dimensional computerized models using a laser beam. Subsequently, other attempts have been made to create a three dimensional virtual model from dental casts [34-36] or from direct intra-oral scanning [37]. These virtual models are the platform for measuring distances and calculating ratios by using designated software, which aids in diagnosing and treatment planning [20].
The notion of three-dimensional virtual models is promising. The ability to electronically store patient information, including study models, has the potential to eliminate the problems of storage, breakage and retrieval of plaster casts as well as simplify office management and interdisciplinary communication, thus simplifying everyday work for the orthodontist [20].
Currently, five companies offer digital models: OrthoCad by
Cadent [38] was the first to introduce the digital model service in 1999,
followed by emodels by Geodigm Corp. [39] in 2001, Orthobyte Digital
Technologies Inc. in 2005 [40], OrthoPlex by GAC International in 2007
[41], and Lava by 3M [42]. These companies all use a similar process. In order to create a digital model, an impression of the dental arches and a bite registration must be taken. Rather than sending the impressions to the laboratory for pouring, the impressions are sent by overnight courier to the digital model provider. According to company policy, the impressions are poured the day of arrival to produce the plaster model. A laser is used to scan the models and generate a set
of data points, which are returned electronically [24]. The laser passes over the model, and after each pass the table upon which the model sits is shifted for the next pass. The model is scanned a total of 20 times, during which millions of data points are recorded and related in the x, y and z axes. Since a non-destructive scanning process is used, the plaster models can be returned to the orthodontist if requested. An algorithm is used to eliminate data points that are closer than 0.1 mm to each other; this is done so that large flat surfaces, such as the facial surfaces, require fewer data points than more complex areas, such as the gingival margin. The data points remaining in the framework of the model are joined together in shapes, particularly triangles. Each apex of the triangle represents one data point. Using trigonometric functions, the computer is able to relate the triangles to each other to create a digital image. Both OrthoCad and emodels claim to be accurate within 0.1 mm [43]. The model images can now be viewed, manipulated and measured on any Windows-based computer using the proprietary software provided by the manufacturer. As the models are manipulated on the screen, millions of computations are made each second to continue relating the triangles. All the information about the model is present even if it cannot all be seen at any one given time. Although the digital models of one company cannot be viewed using software provided by another company, the companies all provide their software free of charge [44]. For an additional fee the companies can provide a plaster model upon request.
The software provided by each company is similar with some variation in the tools provided. The basic software provides tools for making simple diagnostic measurements including tooth size, arch length and width, overjet, overbite, and Bolton 6 and 12 ratios. Using a mouse, the models can be manipulated in any direction, and magnified or shrunk for observation or measurement. Detailed observation of the
models can be made in static occlusion. Depending on the product, additional features include viewing functional movements, sectioning the models, diagnostic setups and indirect bonding tray fabrication.
The advantages of digital models as described by the companies on their websites include [38-42]:
• Storage: The models are stored on a computer, freeing up space.
• Multi-site access: The digital models may be accessed on any computer via the Internet, provided the software is present.
• Retrieval: The models can be located and viewed instantly at anytime, saving staff time.
• Back-up: Copies of the digital model are backed up at a service centre for 10 years (Cadent), indefinitely (Geodigm), or 20 years (Orthobyte).
• Communication: Digital models may be printed or sent via email to other dentists and dental specialists, allowing for improved interdisciplinary treatment planning and saving duplication costs.
• Speed: Digital models can be downloaded automatically or manually on a secure connection. This can be done overnight, saving employee time.
• Convenience: Office procedures remain unchanged; the same materials for traditional impressions and wax bites are used.
• Diagnostics: The software provided includes diagnostic tools allowing for improved treatment decisions.
• Cost-effective: Pay a flat fee per model; all software license fees, product upgrades, overnight shipping costs
and technical support fees are included at no additional charge.
• Enhanced revenue: Due to state of the art digital models, patient satisfaction increases, the models can be accessed using most management software and the staff has more time for patient care.
In addition to the advantages suggested by the manufacturers of digital models, others in the orthodontic community have pointed out certain benefits. Ackerman and Profitt [45] state that all the elements of the craniofacial complex will be able to be analyzed in either a static or animated format. They also mention the ease of rearranging teeth on a computer screen compared to resetting them in wax. The authors see the digital models replacing not only plaster casts but also the articulator, going as far as to say that the articulator will be “relegated to a historical curiosity.” [45]
Disadvantages of digital models include; the loss of data due to the degradation of storage media over time, dependence on the supplier for technical support, digital models on a computer screen lack true three-dimensional presentation, and as with any new technology, there is a learning curve for making measurements [18, 20, 21, 24, 46]. Further, the orthodontist must learn how to analyze the study models on a screen, large practices must ensure sufficient available computer memory or be prepared to store the data on CD or external hard drive, and there is still difficulty relating the models to the hinge axis [47]. In a study where evaluators determined a treatment plan using digital models and subsequently were shown the plaster casts, Rheude [46] reported that the majority of diagnostic changes occurred during the first few evaluations. As the evaluators progressed through the cases, these changes decreased. For example, crossbites were misdiagnosed by most of the evaluators during the first one or two
evaluations but were not during subsequent evaluations. Once evaluators were able to carefully compare digital and plaster models for the same patients, observation and cognizance of the digital models became more accurate. This led Rheude et al [46] to recommend that during the initial transition period from a practice using plaster models to a digital office which uses digital models exclusively, it may be useful to evaluate both digital models and plaster casts for each individual patient during the transition period.
Although the digital model technology is new, attempts have been made to test their reliability in reproducing basic measurements used by practitioners to aid in diagnosis and treatment planning. Often in a clinical setting the orthodontist will measure teeth with a caliper to determine tooth size and relationship to opposing and adjacent teeth. Studies have attempted to compare traditional caliper measurements to digital measurements.
Tomassetti et al [17], compared anterior and overall Bolton tooth size analyses between three computer programs and Vernier calipers. Twenty-two sets of models consisting of an assortment of pre- and post-treatment models were measured. All of the models presented 3 mm or less of crowding. Plaster models were measured three separate times and the average was used for comparison. Comparing the overall discrepancies in millimeters, digital models differed from the plaster models by an average of 1.2 mm (ranging from 0.0 mm to 5.6 mm). Seventy-two percent of discrepancies fell within 1.4 mm and 90.9% were within 2.2 mm. For the discrepancy of the anterior 6 teeth, the differences ranged from 0.1 mm to 4.2 mm, with a mean of 1.02 mm. Eighty-two percent were within 1.5 mm and 90.9% were within 1.9 mm. The authors noted that measurements made using the
statistically significant differences were found between the two methods. However, clinically significant differences, those greater than 1.5 mm, were noted within repeated plaster measurements and between the two methods.
Garino and Garino [48], evaluated individual tooth widths of the incisors and intercanine and intermolar widths, using digital calipers on stone casts and the OrthoCad program. They found that in repeated measurements, digital models were more reliable with smaller mean differences, but the differences between the two techniques were clinically insignificant. The authors attributed these results to the greater resolution of the OrthoCad calipers compared to the manual calipers (0.1 mm to 0.5 mm).
Santoro et al [18], measured tooth size, overbite and overjet on plaster models using a Boley gauge and periodontal probe, and compared them to digital models produced from a second impression, using the OrthoCad program. The results were compared and interexaminer reliability was assessed. They found statistically significant differences between the two methods for tooth size and overbite, with the digital measurements being smaller than the manual ones. These differences ranged from 0.16 mm (for the upper right first molar) to 0.49 mm (for the overbite). The authors considered these differences to be clinically insignificant and surmised that the differences were likely due to alginate shrinkage during transport. No differences were found between the two methods for the measurement of overjet. The authors concluded that “digital models seem to be a clinically acceptable alternative to stone casts for the routine measurements used in orthodontic practice.”
Zilberman et al [20] compared measurements of tooth size and arch width taken on plaster models using digital calipers to the same measurements made using OrthoCad software. Ten sets of artificial teeth were used to simulate various types of malocclusion in twenty different set-ups, thus enabling direct measurement of the teeth outside of the set-up to determine the validity of the plaster and digital measurements. Measurements taken using digital calipers on the plaster casts produced more accurate and reproducible results than the measurements done using OrthoCad. They concluded that the accuracy of the digital models was clinically acceptable, although digital calipers seem to be a more suitable instrument for scientific work.
Quimby et al [21] sought to determine the accuracy, reproducibility, efficacy, and effectiveness of measurements made on digital models using OrthoCad software. Three experiments were conducted. The measurements evaluated included mesiodistal widths, arch length, arch width, overbite, overjet, space available and space required. Measurements were taken on 10 identical sets of plaster and digital models made from a plastic model that served as their gold standard. They found no significant differences between measurements made on the plaster models and those made on the plastic model. Measurements made on the digital models differed significantly from measurements taken directly on the plastic model for mandibular and maxillary space available. Measurements made on the digital models differed significantly from measurements made on the plaster casts for all measurements except overbite and overjet. There was significantly more variability in the measurements made on the digital models than those made on the plaster models for all measurements except for mandibular intercanine distance. Two examiners measuring 50 models tested the reliability and efficacy of
the technique. All categories showed excellent reliability, with an intraclass correlation coefficient >0.90. When comparing the two measurement methods, measurements made from digital models were larger than those made on plaster casts, except for overbite and overjet. These results are contradictory to those of Santoro et al [18]. Differences found were determined to be less than 0.7 mm for all measurements except for maxillary space required and mandibular space available. To test the effectiveness, 10 examiners measured 10 sets of plaster and digital models at two time intervals. There existed significant interexaminer differences for every measurement category and statistically significant differences between the plaster and digital models for every measurement except mandibular intercanine width. The digital measurements showed greater variability for every category except for overjet and overbite. The mean difference for the plaster and digital techniques for the 10 examiners ranged from 0.19 mm to 1.9 mm. The mean difference between the techniques for the examiners ranged from 0.15 mm to 2.9 mm. Most of the measurements differed by less than 1 mm with the exception of maxillary and mandibular space available. During this experiment, digital measurements were once again larger than those made on plaster casts except for overbite and overjet. The authors concluded that the differences found were statistically significant, while the clinical relevance of these differences remains questionable. It was their opinion that the accuracy and reliability of digital models is acceptable. They went on to say “the true test of clinical significance would be to determine whether treatment plans produced with computer based models differed significantly from treatment plans produced from plaster models.”
Rheude et al [46] subsequently addressed this question. Seven evaluators were asked to evaluate seven cases in terms of diagnosis,
treatment plan and treatment mechanics using digital models and the
emodel software. The evaluators were then given the plaster models
of the cases and asked to once again establish diagnosis, treatment plan and treatment mechanics. What they found was that 12.8% of diagnostic characteristics, 12% of treatment mechanics procedures, and 6% of proposed treatment plans changed after viewing the plaster casts. The evaluators appeared to find on average 1.5 mm more mandibular crowding on the plaster models. Of the 49 proposed treatment plans, only three evaluators changed their treatment plan upon viewing the plaster models, and all three changes were made to the same case. The case happened to be a class III open bite case and it was the opinion of the evaluators that the digital mounting may have been inaccurate, making the malocclusion appear more severe. The authors concluded that in the majority of situations digital models could be successfully used for diagnosis and treatment planning.
Stevens et al [22] examined the differences in intra and interexaminer measurements using the emodel software. Three examiners measured 24 plaster and digital casts for tooth size, overbite and overjet. Intraexaminer reliability was considered excellent for both plaster and digital, with plaster models being slightly higher. The findings for the interexaminer comparisons were similar. There were no statistically significant differences between intraexaminer and interexaminer reliability with regards to tooth size measurements and Bolton 6 discrepancy. However, statically significant differences were found for overbite and anterior crowding. Larger overbites were measured on the plaster models, while the digital models revealed more anterior crowding. This last finding is in contradiction with those of Rheude. These differences were not deemed to be clinically significant.
Mullen et al [23] sought to compare not only the accuracy but also speed at which measurements are made between plaster models and the emodel software. They found no significant differences in the Bolton ratios using the two methods. Significant differences were found for arch length calculations and the time needed to perform the measurements, with the digital measurements being on average 65 seconds faster. They also performed measurements on mounted ball bearings and found the digital measurements to be on average 0.67 mm larger than the direct measurements; this difference was significant. The authors concluded that performing a Bolton analysis was as accurate and faster using the digital method.
All the previous studies comparing detailed measurements taken from plaster and digital models and their resultant discrepancies and ratios utilized the OrthoCad [17, 18, 20, 21, 48] and emodel system [22, 23, 46]. No studies have been done using the software provided by Orthobyte Digital Technology Inc. Often, the model used to create the digital model was not the model that was later measured by hand [18, 20, 21, 46, 48]. The choice of impression material also varied with the studies, in most of the studies alginate was used [18, 21-23], while other studies used a silicone based impression material [20, 48]. Significant statistical differences were sometimes found [18, 21-23], yet the clinical significance of these differences have been questioned [21], dismissed [18, 21-23], or validated [17, 23].
Chapter III
Purpose, Questions, and Hypotheses
The purpose of the present study
In order to be valuable to the orthodontist, performing measurements and Bolton analyses using the Orthobyte software must help in the decision making process of treatment planning. The measurements made on the digital model must be similar to the measurements taken on the plaster model for the diagnosis and treatment planning to be accurate. Before the Orthobyte software can be used for treatment planning and diagnosis, the accuracy and reliability of performing space analysis must be established. This study will provide a comparison of comprehensive cast analysis measurements taken with Orthobyte’s software and the traditional method of using calipers and plaster models. As part of the investigation the reliability of each method will be tested individually. A further purpose of this study will be to determine whether the choice of impression material affects the accuracy of the digital models. The measurements will be organized and categorized in an attempt to assess for potential clinical significance.
Research Questions
1. How accurate is performing a comprehensive cast analysis using Orthobyte software compared to the conventional study cast?
2. Does the choice of impression material affect the accuracy of the cast analysis?
Study Hypotheses
1. There are no significant differences between measurements and resultant calculations or ratios obtained from plaster models and those obtained form Orthobyte digital study models.
2. There are no significant differences between measurements and resultant calculations or ratios obtained from plaster and digital models produced using different impression materials.
3. There are no significant differences between measurements and resultant calculations or ratios obtained from repeated measurements on plaster and digital study models for each method individually.
Chapter IV
Materials and Methods
Sample selection
Twenty-five sets of models from patients of the Section of Orthodontics of the University of Montreal were selected. The models were made from impressions taken of patients who required them for orthodontic treatment. Pre-treatment models were used and the amount of crowding present was not a factor in choosing patients. While the models were selected at random, they were selected to reflect the patient population of the orthodontic clinic. Twelve male (48%) and thirteen female (52%) patients were selected. Of these eleven presented a Cl I (44%) malocclusion, twelve a Cl II (48%) and two a Cl III (8%). The criteria for inclusion were:
• Permanent dentition from first molar to first molar • No missing teeth from first molar to first molar
• Normal dental morphology, without excessive wear, no decay or large restorations which could affect the mesio-distal width of the teeth
• No voids or blebs in the plaster models
• No fractures of the teeth on the plaster models
Patient casts
Once selected, one alginate impression (Kromopan 100 alginate, Italy), one alginate alternative impression (Alginot, Kerr Dentistry, Orange, CA), and one PVS impression (Aquasil) of the maxillary and mandibular arch was taken for each patient and sent, along with a wax bite, to Orthobyte Technology Inc. The same size
tray was used for the impressions with each materiel. Orthobyte poured a plaster model and used it to produce the digital model, which was then downloaded. The plaster models that Orthobyte poured from the original impressions and used to fabricate the digital models were returned to us. The plaster model and digital model for each patient were made from the same impression and should have identical measurements.
Instrumentation
All of the digital measurements were made using the Orthobyte
Digital Technology software. Manual measurements of mesial-distal
width, arch length, and intermolar and intercanine width were made using an electronic caliper (Figure 2, Appendix II). These measurements were rounded to the nearest 0.1 mm. Overbite and overjet were measured with a millimeter ruler and rounded to the nearest 0.5 mm. The measurements were recorded in an Excel spreadsheet (Microsoft, Redmond, WA).
Data collection
The author performed all measurements. The entire sample of plaster models was measured first, followed by the digital models. The measurements included:
• The mesial-distal width of each tooth from first molar to first molar was measured between the anatomic mesial and distal contact points. Measurements for the plaster models were usually measured from the occlusal unless a better position was found. Measurements for the digital models were made from the occlusal unless both
contacts could not be visualized. The rotating tool was used to find a more amenable view for digital measurements.
• Space available (arch length) was measured using the method described by Staley (Figure 3, Appendix II) [49]. The occlusal view was used for this measurement. The posterior segments of the arch were measured from the mesial contacts of the first molars to the distal contact of the canines. The canines were measured and the anterior segments were measured from between the central incisors to the mesial contact point of the canines. The sum of these segments represented the space available.
• Arch width was determined by measuring intercanine and intermolar widths (Figure 4, Appendix II). Intercanine width was measured as the distance between cusp tips. Intermolar width was measured as the distance between the central fossae of the first molars.
• Overbite was measured with the models in occlusion as the greatest amount of vertical overlap at the central incisors.
• Overjet was measured with the models in occlusion, as the greatest horizontal distance from the labial surface of the lower central incisor to the most inferior point at the mesiodistal center of the upper central incisor.
The previous measured values allowed for the calculation of five additional categories:
• Space required was the summation of the mesiodistal tooth widths for each arch from second premolar to second premolar.
• Space available (arch length) as described above, was the summation of arch segments within the maxillary and mandibular arch.
• Subtraction of space required from space available yielded spacing (positive value) and crowding (negative value).
• The widths of the twelve teeth, first molar to first molar (6-6), and anterior 6 teeth (3-3), were converted into the Bolton analysis ratio. The ratios are as follows: 6-6 overall ratio = sum of the mandibular widths / sum of the maxillary widths, and 3-3 anterior ratio = sum of the mandibular widths / sum of the maxillary widths. A normal overall value is 91.3 % while a normal anterior value is 77.2 %.
• The Bolton discrepancy can also be expressed in mm. For example, 0.913 x sum of the maxillary 6-6 widths will give the ideal sum of mandibular 6-6 widths. The difference between this value and the actual mandibular 6-6 total width is the discrepancy in mm. A higher Bolton value was expressed as negative (maxillary deficiency or mandibular excess), while a lower value was expressed as a positive (maxillary excess or mandibular deficiency). These discrepancies were calculated for the anterior and total Bolton ratios.
Reliability analysis
A complete series of 25 models for one impression material was measured a second time after an interval of at least two weeks. By comparing the measurements done at two separate times by each method, the intraoperator error could be determined. The same
operator, using the same technique as described above, did the measurements.
Statistical Analysis
To assess intraoperator reliability and test the general hypothesis of no difference between plaster and digital study models, the intraclass correlation coefficient (ICC) was computed using the two sets of data points corresponding to measurements taken by the plaster and digital methods on the same subjects. The range of the ICC lies between 0 and 1, with 0 representing “no agreement” and 1 representing “perfect agreement”. The investigator followed conventional ICC interpretation: ICC < 0.3 denotes poor agreement, 0.31 < ICC < 0.5 denotes fair agreement, 0.51 < ICC < 0.7 denotes average agreement, 0.71 < ICC < 0.9 denotes good agreement and 0.91 < ICC denotes excellent agreement.
The technical error of measurement was assessed using the conventional Dahlberg statistic. It is expressed as the average millimetric difference attributable to measurement imprecision.
A Bland-Altman analysis was used to assess the level of agreement between the two methods to compare the digital technique to the plaster technique.
The validity of digital measurements was further assessed with paired t-tests to compare digital model and plaster model measurements for each impression material.
Chapter V
Article
The accuracy and reliability of plaster vs digital
study models: A comparison of three different
impression materials
Bradley Lands, Pierre Rompré, Claude Remise, Daniel Fortin
Montreal, Quebec, Canada
Introduction: The purpose of this study was to examine the effects of different impression materials on the accuracy and reliability of digital models. Methods: Models from 25 patients selected at random from the files of the Section of Orthodontics at the University of Montreal were used in this study. One alginate (Kromopan 100 alginate, Italy), 1 alginate alternative (Alginot, Kerr Dentistry, Orange, CA), and 1 PVS (Aquasil, Dentsply Caulk, Milford, DE) impression was taken of both arches of each patient and sent to Orthobyte (Orthobyte Digital Technology inc., Calgary, AB) for fabrication of a plaster model and scanning for production of a digital model. The Bolton 6 and 12 analyses and their constituent measurements, overbite, overjet, and arch length were used for the comparison. Results: The repeatability of measurements using both the plaster and digital methods was good to excellent, with the plaster measurements tending to be more reliable. There were statistically significant differences in the Bolton 12 and mandibular arch length and spacing measurements for all impression materials, with the plaster models tending to give a smaller measurement for the Bolton 12 and a higher measurement for the mandibular arch length and spacing. Although statistically significant differences in some measurements were found for the reliability and validity of digital models, none was clinically significant. Conclusions: The accuracy and reliability of the software for comprehensive cast analysis is clinically acceptable and reproducible when compared with traditional plaster study model analysis.
The paperless office is now a reality and although the transition has been slow, it has been steady. Patient charts are being replaced by practice management software. This software allows the practitioner to integrate patient records including digital photographs and radiographs, as well as administrative functions, including referral
letters, patient billing, scheduling and payroll. In orthodontic offices the plaster model is fast becoming the last physical record of the patient that we maintain.
Currently, four companies offer digital models: OrthoCad by
Cadent [1] was the first to introduce the digital model service in 1999,
followed by emodels by Geodigm Corp. [2] in 2001, Orthobyte Digital
Technologies Inc. [3] in 2005 and Lava Digital Models by 3M [4] in
2009. These companies all use a similar process. In order to create a digital model, impressions of the dental arches and a bite registration must be taken. Rather than sending the impressions to the laboratory for pouring, the impressions are sent by overnight courier to the digital model provider. According to company policy, the impressions are poured the day of arrival to produce the plaster model. A laser is used to scan the models and generate a set of data points, which are returned electronically to the orthodontist [5]. The model images can now be viewed, manipulated and measured on any Windows-based computer using the proprietary software provided by the manufacturer. The software provided by each company is similar with some variation in the tools provided. The basic software provides tools for making simple diagnostic measurements including tooth size, arch length and width, overjet, overbite, and Bolton 6 and 12 ratios. The models can be manipulated in any direction, and magnified or shrunk for observation or measurement. Detailed observation of the models can be made in static occlusion. Depending on the product, additional features include viewing functional movements, sectioning the models, diagnostic setups and indirect bonding tray fabrication.
The advantages these models offer to the orthodontist include: (1) ease of retrieval, having the models instantly on your computer screen; (2) reduction of storage space, there is no longer the need to
maintain storage space for the thousands of plaster models an orthodontist produces over the years; (3) measurements of tooth size, arch length, and crowding/spacing are accurate, efficient and easy; (4) diagnostic setups are quick and easy to produce; (5) models may be printed or sent via email to other dentists and dental specialists, allowing for improved interdisciplinary treatment planning and saving duplication costs [6].
A review of the literature did not reveal any studies that tested the clinical applicability of Orthobyte digital models vs. plaster models. Previous studies have shown that the dimensional accuracy of laser surface scanned digital models is within 0.05 mm [7-9], and both OrthoCad and emodels claim to be accurate within 0.1 mm [10]. Several studies have tested the accuracy of OrthoCad vs plaster models [11-15] and emodels vs plaster models [16, 17], often, in these studies, the model used to create the digital model was not the model that was later measured by hand [12-15, 18]. The choice of impression material also varied with the studies; in most of the studies alginate [13, 15-17] was used, while other studies used a silicone based impression material [12, 14].
The purpose of this study was to compare plaster models with the digital counterpart of Orthobyte for the analysis of tooth size, arch length and arch spacing/crowding using different impression materials.
MATERIALS AND METHODS
Twenty-five sets of models from patients of the Section of Orthodontics of the University of Montreal were selected. The models were made from impressions taken of patients who required them for orthodontic treatment. Pre-treatment models were used and the
amount of crowding present was not a factor in choosing patients. While the models were selected at random, they were selected to reflect the patient population of the orthodontic clinic. Twelve male (48%) and thirteen female (52%) patients were selected. Of these eleven presented a Cl I (44%) malocclusion, twelve a Cl II (48%) and two a Cl III (8%). The criteria for inclusion were:
• Permanent dentition from first molar to first molar • No missing teeth from first molar to first molar
• Normal dental morphology, without excessive wear, no decay or large restorations which could affect the mesio-distal width of the teeth
• No voids or blebs in the plaster models
• No fractures of the teeth on the plaster models
Once selected, one alginate impression (Kromopan 100 alginate, Italy), one alginate alternative impression (Alginot, Kerr Dentistry, Orange, CA), and one PVS impression (Aquasil) of the maxillary and mandibular arch was taken for each patient and sent, along with a wax bite, to Orthobyte Technology Inc. The same size tray was used for the impressions with each materiel. Orthobyte poured a plaster model and used it to produce the digital model, which was then downloaded. The plaster models that Orthobyte poured from the original impressions and used to fabricate the digital models were returned to the university. The plaster model and digital model were made from the same impression and should have identical measurements.
Measurements included tooth size from first molar to first molar in both arches, arch length, intercanine and intermolar distances in both arches, overjet and overbite. All of the digital measurements were made using the Orthobyte Digital Technology software. Manual
measurements of mesial-distal width, arch length, and intermolar and intercanine width were made using an electronic digital caliper. These measurements were rounded to the nearest 0.1 mm. Overbite and overjet were measured with a millimeter ruler and rounded to the nearest 0.5 mm. The measurements were recorded in an Excel spreadsheet (Microsoft, Redmond, WA).
The mesial-distal width of each tooth from first molar to first molar was measured between the anatomic mesial and distal contact points. Measurements for the plaster models were usually measured from the occlusal unless a better position was found. Measurements for the digital models were made from the occlusal unless both contacts could not be visualized. The rotating tool was used to find a more amenable view for digital measurements. Space available (arch length) was measured using the method described by Staley [19]. The occlusal view was used for this measurement. The posterior segments of the arch were measured from the mesial contacts of the first molars to the distal contact of the canines. The canines were measured and the anterior segments were measured from between the central incisors to the mesial contact point of the canines. The sum of these segments represented the space available. Arch width was measured for intercanine and intermolar width. Intercanine width was measured as the distance between cusp tips. Intermolar width was measured as the distance between central fossae of the first molars. Overbite was measured with the models in occlusion as the greatest amount of vertical overlap at the central incisors. Overjet was measured with the models in occlusion, as the greatest horizontal distance from the labial surface of the lower central incisor to the most inferior point at the mesio-distal center of the upper central incisor.
Statistical analysis
To assess intraoperator reliability and test the general hypothesis of no difference between plaster and digital study models, the intraclass correlation coefficient (ICC) was computed using the two sets of data points corresponding to measurements taken by the plaster and digital methods on the same subjects.
The technical error of measurement was assessed using the conventional Dahlberg statistic. It is expressed as the average millimetric difference attributable to measurement imprecision. A Bland-Altman analysis was used to assess the level of agreement between the two methods to compare the digital technique to the plaster technique. The validity of digital measurements was further assessed with paired t-tests to compare digital model and plaster model measurements for each impression material.
RESULTS
Intraexaminer reproducibility (Table I) for plaster and digital models with the ICC was good to excellent. Repeated measures for plaster yielded an average error between 0.16 mm for the mandibular intermolar distance and 0.56 mm for maxillary crowding, with a largest 95% confidence interval of ±1.12 mm for the Bolton 12. Repeated measures for the digital models yielded an average error between 0.16 mm for the overbite and 1.16 mm for mandibular crowding, with a largest 95 % confidence interval of ±3.63 mm for the mandibular intermolar distance.
Table I. Intraexaminer ICC, Dahlberg statistic and Bland-Altman analysis to evaluate reproducibility of measurements for plaster and digital
Plaster Digital
Measurement ICC Dahlberg Bland-Altman
rep ± 2 SD
ICC Dahlberg Bland-Altman rep ± 2 SD
Bolton 6 (mm) 0.968 0.21 0.58 0.811 0.51 1.44
Bolton 12 (mm) 0.953 0.40 1.12 0.822 0.88 2.48
Maxillary arch length 0.994 0.43 1.22 0.990 0.52 1.46
Mandibular arch length 0.994 0.43 1.22 0.989 0.60 1.68
Maxillary Crowding 0.978 0.56 1.59 0.935 0.96 2.71 Mandibular Crowding 0.978 0.58 1.63 0.914 1.16 3.27 Overjet 0.995 0.24 0.69 0.997 0.17 0.49 Overbite 0.978 0.28 0.80 0.994 0.16 0.45 Maxillary intercanine 0.995 0.20 0.56 0.983 0.37 1.05 Mandibular intercanine 0.992 0.24 0.69 0.982 0.36 1.02 Maxillary intermolar 0.998 0.15 0.43 0.988 0.35 0.98 Mandibular intermolar 0.997 0.16 0.46 0.874 1.28 3.63
When comparing the plaster models and their digital counterparts produced from alginate impressions (Table II), the ICC’s were 0.790 or higher, for Alginot the ICC’s were 0.814 or higher and for PVS they were 0.793 or higher. These indicate a good to excellent correlation. Individual teeth (results not shown) also showed good to excellent correlation except for the maxillary right first premolar when comparing the Alginot models, which showed only an average correlation.
Table II. Intraclass Correlation Coefficient test between the plaster and digital models
Measurement Alginate Alginot PVS
Bolton 6 (mm) 0.850 0.886 0.793
Bolton 12 (mm) 0.790 0.864 0.879
Maxillary arch length 0.978 0.926 0.962 Mandibular arch length 0.921 0.958 0.930 Maxillary Crowding 0.932 0.814 0.929 Mandibular Crowding 0.840 0.939 0.866 Overjet 0.986 0.985 0.980 Overbite 0.958 0.917 0.966 Maxillary intercanine 0.995 0.995 0.989 Mandibular intercanine 0.996 0.990 0.994 Maxillary intermolar 0.996 0.995 0.995 Mandibular intermolar 0.994 0.994 0.994
High correlation with values approaching 1.
The Bland-Altman analysis (Table III) shows that the Bolton 6 (mm) and Bolton 12 (mm) were consistently smaller (negative value) using the digital technique for all impression materials. The intercanine and intermolar distances were generally slightly larger for the plaster technique (positive values); these measurements were the most consistent. The largest 95% limits of agreement between the two methods intervals were for the Bolton 12 (mm), mandibular arch length and mandibular crowding. The variables also generally showed the highest average error of measurement as shown by the Dahlberg statistic (Table IV).
From the paired t-tests (Table V), the P value showed the means of the results for the Bolton 12 (mm), mandibular arch length, and mandibular crowding were significantly different (at the 0.05 level) for all impression materials. The mandibular intermolar difference for the Alginot models was significantly different. The lower right second premolar and first molar (results not shown) were also significantly different for all impression materials. Other teeth showed significant
differences but varied upon impression materials. Alginate and Alginot showed more statistically significant differences than PVS.
Table III. The Bland-Altman analysis comparing the plaster and digital models
Alginate Alginot PVS 95% Limits of agreement 95% Limits of agreement 95% Limits of agreement Measurement Mean difference (SD) -2 SD +2 SD Mean difference (SD) -2 SD +2 SD Mean difference (SD) -2 SD +2 SD Bolton 6 (mm) -0.07 (0.82) -1.70 1.55 -0.16 (0.68) -1.53 1.21 -0.19 (0.77) -1.73 1.35 Bolton 12 (mm) -0.89 (1.18) -3.26 1.48 -0.48 (1.13) -2.74 1.78 -0.66 (0.78) -2.22 0.90 Max arch lgth -0.26 (1.17) -2.61 2.08 0.07 (2.26) -4.45 4.60 -0.37 (1.48) -3.32 2.58 Man arch lgth 1.64 (1.49) -1.34 4.62 1.07 (1.20) -1.33 3.50 1.35 (1.70) -2.05 4.75 Max Crowding -0.16 (1.39) -2.94 2.62 0.08 (2.49) -4.91 5.06 -0.38 (1.39) -3.16 2.40 Man Crowding 1.15 (1.67) -2.18 4.48 0.82 (1.07) -1.32 2.96 0.83 (1.78) -2.73 4.40 Overjet -0.16 (0.55) -1.27 0.95 0.02 (0.57) -1.12 1.16 -0.02 (0.67) -1.36 1.32 Overbite -0.08 (0.59) -1.26 1.10 -0.18 (0.75) -1.68 1.32 -0.10 (0.52) -1.14 0.94 Max IC 0.04 (0.29) -0.53 0.62 0.03 (0.29) -0.55 0.61 0.14 (0.40) -0.67 0.95 Man IC -0.03 (0.24) -0.52 0.45 0.10 (0.39) -0.67 0.87 0.03 (0.29) -0.56 0.62 Max IM 0.04 (0.31) -0.58 0.65 0.10 (0.33) -0.57 0.76 0.05 (0.33) -0.60 0.71 Man IM 0.13 (0.35) -0.57 0.84 0.14 (0.34) -0.54 0.83 0.13 (0.35) -0.56 0.83
Max: Maxillary, Man: Mandibular, lgth: length, IC: Intercanine, IM: Intermolar
Table IV. Dahlberg Statistic comparing the plaster and digital models
Measurement Alginate Alginot PVS
Bolton 6 (mm) 0.58 0.49 0.55
Bolton 12 (mm) 1.03 0.85 0.72
Maxillary arch length 0.83 1.57 1.06 Mandibular arch length 1.55 1.13 1.52
Maxillary Crowding 0.97 1.73 1.00 Mandibular Crowding 1.41 0.94 1.37 Overjet 0.40 0.39 0.46 Overbite 0.41 0.53 0.37 Maxillary intercanine 0.20 0.20 0.30 Mandibular intercanine 0.17 0.28 0.21 Maxillary intermolar 0.21 0.24 0.23 Mandibular intermolar 0.26 0.26 0.26
Table V. Results of paired t-test between plaster and digital models
Measurement Alginate Alginot PVS
Bolton 6 (mm) 0.663 0.253 0.224
Bolton 12 (mm) 0.001 0.044 0.000
Maxillary arch length 0.272 0.875 0.220 Mandibular arch length 0.000 0.000 0.001 Maxillary Crowding 0.561 0.880 0.185 Mandibular Crowding 0.002 0.001 0.028 Overjet 0.161 0.862 0.882 Overbite 0.504 0.241 0.346 Maxillary intercanine 0.454 0.586 0.096 Mandibular intercanine 0.516 0.209 0.640 Maxillary intermolar 0.564 0.163 0.434 Mandibular intermolar 0.074 0.047 0.069 P value shown DISCUSSION
While statistically significant differences for the Bolton 12, mandibular arch length and mandibular crowding were found, these differences were not clinically significant. The mean difference for the Bolton 12 (mm) was less than 1 mm for all three impression materials, less than 1.7 mm for mandibular arch length and less than 1.2 mm for mandibular crowding. Further, the technical error of measurement was larger than the mean differences found. These results differ from those of Leifert et al [20], who found statistically significant differences for maxillary space analysis, but not for mandibular space analysis. Mullen et al [16] found significant differences for both maxillary and mandibular arch length. These differences may be due to techniques used to calculate space available or to the system used (OrthoCad and emodels). They also concluded that these differences were clinically insignificant.
Santoro et al [13] reported digital tooth width measurements that were consistently smaller using the OrthoCad system. Stevens et al.
[17] found no such bias using the emodels system. Our study did not identify any consistent tooth width bias with digital models. However, our Bolton 6 (mm) and 12 (mm), overjet and overbite were consistently smaller. The overjet and overbite findings are in agreement with those of Quimby et al [15]. We were able to identify certain teeth, such as the upper right central incisor, which were consistently smaller while others, such as the upper left first premolar, were consistently larger. For individual teeth the differences were clinically insignificant ranging from -0.14 mm to 0.14 mm.
There was greater variability associated with the measurements made on the computer-based models compared with the same measurements made on the plaster models. This finding is in agreement with the findings of Quimby et al [15], Stevens et al [17], and Mullen et al [16]. Zilberman et al [14] showed that the validity of measurements can be hampered by point selection on digital models with significant crowding, rotations, variable inclinations, or anatomical variations.
Several factors could explain the differences between the plaster and digital measurements. From the manufacturer’s end, these include: (1) the process of producing the plaster casts, (2) the process of scanning and producing data points from the plaster model and (3) the display and measurement algorithms of the manufacturer’s proprietary software. From the examiner’s perspective these include: (1) the learning curve associated with the software, (2) while the digital model is a true 3-D representation, what we see on screen is in 2 dimensions. The identification of points, axes, inclinations, and planes becomes more complicated and less reliable with 2 dimensional images. (3) There can be a certain difficulty in identifying the greatest mesio-distal width of the teeth with the software. While the resolution
is high and the model can be rotated to accurately visualize the contact area, in some cases the interproximal area between the teeth is not well defined.
The choice of impression material did not seem to affect the outcome of the measurements. There was high agreement across all three impression materials. No particular tendencies were discernable. When looking at the p-values across all the variables measured, there were more statistically significant differences for alginate and Alginot than PVS. However, as discussed earlier, these differences were not clinically significant.
CONCLUSIONS
When considering whether digital models produced by Orthobyte are valid for diagnosis and treatment planning, the following conclusions can be drawn:
1. No statistical differences were found for repeated measures. However the digital measures tended to show greater variability. 2. A good to excellent correlation was found for all variables when
comparing the plaster and digital models.
3. While statistically significant differences were found between plaster and digital models for the Bolton 12, mandibular arch length and mandibular crowding, the statistical difference was small and considered to be clinically insignificant.
4. Use of different impression materials did not affect the results. Using higher cost Alginot and PVS impression materials is not necessary.
5. It appears that digital models produced by Orthobyte and examined with their software can be reliably used for orthodontic diagnosis and treatment planning.