HAL Id: dumas-03184737
https://dumas.ccsd.cnrs.fr/dumas-03184737
Submitted on 29 Mar 2021HAL is a multi-disciplinary open access archive for the deposit and dissemination of sci-entific research documents, whether they are pub-lished or not. The documents may come from teaching and research institutions in France or abroad, or from public or private research centers.
L’archive ouverte pluridisciplinaire HAL, est destinée au dépôt et à la diffusion de documents scientifiques de niveau recherche, publiés ou non, émanant des établissements d’enseignement et de recherche français ou étrangers, des laboratoires publics ou privés.
Copyright
Identifying the determinants of bicycle use: the case of
Copenhagen and Lyon
Louis-Marie Portal
To cite this version:
Louis-Marie Portal. Identifying the determinants of bicycle use: the case of Copenhagen and Lyon. Engineering Sciences [physics]. 2019. �dumas-03184737�
Travail de fin d’études
pour le diplôme d’ingénieur de l’École nationale des travaux publics de l’État
et le Master 2 Transports Réseaux et Territoires de l’Université Lyon 2 et de
l’École nationale des travaux publics de l’État
Année 2018-2019
Voie d’approfondissement :
Transports et Territoires
Soutenu le 11 septembre 2019
Devant le jury composé de :
§ Président du Jury : Pascal Pochet§ Maîtres de TFE [ou Tuteurs] : Michael Bruhn Barfod et Sonja Haustein § Expert : Matthieu Adam
Par
Louis-Marie Portal
Identifying the determinants of bicycle use: the case of
Copenhagen and Lyon
Danmarks Tekniske Universitet (Université Technique du
Danemark)
Notice analytique
AUTEUR Nom Portal Prénom Louis-Marie ORGANISME D’ACCUEIL Nom de l’organismeet Localité Université du Technique du Danemark, Bâtiment 358 Akademivej, 2800 Kgs. Lyngby, Danemark Noms des Tuteurs Michael Bruhn Barfod et Sonja Haustein
ANALYSE DU TFE
Titre (français) Identification des déterminants à l’usage du vélo : le cas de Copenhague et Lyon
Titre (anglais) Identifying the determinants of bicycle use: the case of Copenhagen and Lyon Résumé (français) L’objectif premier de ce mémoire est l’identification des déterminants à l’usage
du vélo dans un contexte urbain. La méthodologie repose sur deux études. La première consiste en la comparaison de deux enquêtes de mobilité, l’une réalisée à Copenhague, l’autre à Lyon. Pour cela différents outils statistiques sont utilisés. Ensuite, des entretiens qualitatifs sont conduits auprès d’étudiants internationaux à Copenhague et analysés pour compléter l’étude sur les déterminants. Les résultats permettent de mettre en avant les effets que certaines caractéristiques individuelles (âge, abonnement aux transports en commun), du trajets (distance, météo), spatiales (infrastructures), et le rôle de facteurs socio-psychologiques (normes sociales). Ces résultats permettent d’envisager des propositions de politique d’aménagement pour inciter à l’utilisation du vélo.
Résumé (anglais) The main objective of this thesis is to identify the determinants of bicycle use in an urban context. The methodology is based on two studies. The first one consists of a comparison of two mobility surveys, one conducted in Copenhagen and the other in Lyon. For this purpose, different statistical tools are used. Then, qualitative interviews are conducted with international students in Copenhagen and analysed to complete the study on the determinants. The results highlight the effects that certain individual characteristics (age, public transport subscription), journey (distance, weather), spatial (infrastructure), and the role of socio-psychological factors (social norms). These results make possible to consider proposals for a development policy to encourage the use of bicycles.
Mots-clés
(français, 5 maxi) Vélo, mobilité, déterminants, entretiens, enquêtes Mots-clés
(anglais, 5 maxi)
Bicycle, mobility, determinants, interviews, surveys Termes
géo-graphique (français) Copenhague, Danemark, Lyon, France
COLLATION
Nb de pages Nb d'annexes (nb de pages) Nb de réf. biblio.
Content
NOTICE ANALYTIQUE ... 3 CONTENT ... 5 FIGURE LIST ... 7 TABLE LIST ... 8 ACKNOWLEDGEMENT ... 9 1. INTRODUCTION ... 112. COPENHAGEN AND LYON: TWO SIMILAR CITIES BUT STILL WITH DIFFERENCES ... 15
2.1 FRANCE AND DENMARK, TWO COUNTRIES WITH DIFFERENT CHARACTERISTICS AND ENVIRONMENT ... 15
2.2 THE TWO STUDY AREAS:COPENHAGEN AND LYON ... 16
3. LITERATURE REVIEW ... 21
3.1 HISTORICAL EVOLUTION OF BICYCLE USE ... 21
3.2 MOBILITY WITHIN CITIES: EXTERNALITIES FROM THE USE OF CAR AND BICYCLES AS A SOLUTION ... 22
3.3 THE USE OF BICYCLE IN COPENHAGEN AND LYON ... 23
3.4 UNDERSTANDING MODAL CHOICE AND DETERMINANTS OF THE BICYCLE USE ... 24
3.4.1 Socio-demographics factors ... 26 3.4.2 Spatial indicators ... 27 3.4.3 Journey characteristics ... 28 3.4.4 Socio-psychological indicators ... 29 3.5 RESEARCH QUESTIONS ... 30 4. METHODOLOGY ... 32
4.1 OVERALL METHODOLOGY OF THE THESIS ... 32
4.2 ANALYSIS OF THE TWO DATA SETS ... 33
4.2.1 Two data sets, two different origins ... 33
4.2.2 Data selection ... 35
4.2.3 Methodology used for statistical analysis of the data ... 37
4.3 QUALITATIVE INTERVIEWS ... 38
4.3.1 Design of the questionnaire and conduct of the interviews ... 39
4.3.2 Research of volunteer, conduct and transcription ... 40
4.3.3 Analysing the interviews ... 40
5. RESULTS FROM THE TWO STUDIES ... 41
5.1 RESULTS FROM THE ANALYSIS OF THE TWO DATA SETS ... 41
5.1.1 Overview of the selected data ... 41
5.1.2 Results from the statistical tools ... 43
5.1.3 Conclusions of the statistical analyses ... 52
5.2 IDENTIFYING WHICH ASPECTS ENCOURAGE OR DISCOURAGE PEOPLE TO CYCLE THROUGH QUALITATIVE INTERVIEWS ... 54
5.2.1 Respondents characteristics ... 54
5.2.2 Analysis of the interviews ... 55
6. DISCUSSION ... 65
6.1 LESSONS LEARNED FROM THE STUDIES ... 65
6.2 PROPOSITIONS ... 66
7. CONCLUSION ... 69
8. BIBLIOGRAPHY ... 71
APPENDICES ... 74
9. APPENDIX 1 – THE DIFFERENT GOALS ESTABLISHED BY UNO ... 74
10. APPENDIX 2 – MODALITIES MODIFICATION IN DIFFERENT VARIABLES ... 75
10.1 OCCUPATION ... 75
10.2 DRIVING LICENSE ... 76
10.3 PUBLIC TRANSPORT PASS ... 76
10.4 TRANSPORT MODE ... 76
10.5 EDUCATION LEVEL ... 78
11. APPENDIX 3 – BIVARIATE STATISTICS ... 79
11.1 GENDER ... 79
11.2 OCCUPATION ... 81
11.3 EDUCATION ... 83
11.4 DRIVING LICENSE ... 85
11.5 PUBLIC TRANSPORT SUBSCRIPTION ... 87
11.6 LIVING IN A SINGLE-PERSON HOUSEHOLD ... 89
11.7 CAR AVAILABILITY ... 91
11.8 DISTANCE ... 93
11.9 WEATHER ... 95
Figure list
Figure 1 - Breakdown of the CO2 emissions by sector (2016) - Source: International Energy Agency ... 11
Figure 2 - Breakdown of responses to the question "How often do you cycle" in the survey requested by the European Commission on attitudes of Europeans toward mobility (2013) ... 13
Figure 3 - Location of Lyon, France - Source: Google Maps ... 17
Figure 4 - Location of Copenhagen - Source: Google Maps ... 18
Figure 5 - Bicycle infrastructures (in green) in Lyon, France - Source: Geovelo ... 19
Figure 6 - Bicycle infrastructures (in green) in Copenhagen, Denmark - Source: Geovelo ... 20
Figure 7 - Average cost per kilometre for cycling/car for 2008 (Euro) (Gössling and Choi 2015) ... 23
Figure 8 - Illustration of the interaction of indicators in the modal choice process (De Witte et al. 2013) ... 26
Figure 9 - General methodology used to answer the research question ... 32
Figure 10 - Comparison of the modal shares in the cities of Copenhagen and Lyon ... 44
Figure 11 - Proportion of each gender for the different modes of transport ... 45
Figure 12 - Proportion of each transport mode for the different occupations ... 45
Figure 13 - Proportion of each transport mode for the different distances ... 46
Table list
Table 1 – Breakdown of the main transport modes trips in the cities of Copenhagen and Lyon (‘Copenhagen City of Cyclists: The Bicycle Account 2014’ 2015; ‘Enquête déplacements 2015 de l’aire métropolitaine lyonnaise :
Résultat sur le SCOT de l’agglomération lyonnaise’ 2016) ... 24
Table 2 - Different tables from the two data sets ... 36
Table 3 - Variables selected for the study on Lyon and Copenhagen data ... 42
Table 4 - Comparison of the variables and characteristics from the two cities ... 48
Table 5 - Results of the logistic regressions for the two cities ... 53
Acknowledgement
I would like to thank my two supervisors, Michael Bruhn Barfod and Sonja Haustein, for their useful help during my 5 months of research: Vielen Dank Sonja, and Tusing tak Michael. It has been a pleasure to work with you, and your help has always been really useful in my research. Your comments and advice were always relevant. I would also like to thank Mayara Moraes Monteiro for the time she devoted to me when I was conducting and studying the interviews. I also thank all the people I met at DTU who made my stay as pleasant as possible by their kindness.
I would like to thank all my supervisors at ENTPE: Louafi Bouzouina for all his advice during the preparation phase before starting the thesis, and also Pascal Pochet and Matthieu Adam, the jury president and the expert for my defence respectively.
1. Introduction
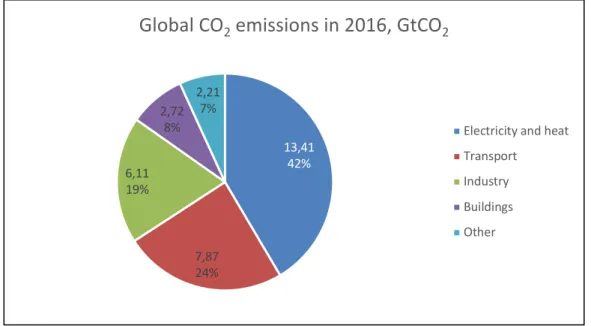
Climate change is a serious issue which catches the attention of several players, such as government, researchers, and populations. The effects are numerous and could jeopardize the way humanity lives1. Climate change is directly related to greenhouse gas emissions, including carbon dioxide. Several sectors account for all greenhouse gas emissions as shown in Figure 1. Transport is the second largest source of emissions, and the amount of CO2 emitted by transport activities has increased by 71% compared to 19902.
Figure 1 - Breakdown of the CO2 emissions by sector (2016) - Source: International Energy Agency
In addition, cities around the world are facing problems due to air pollution, noise, accidents, and congestion. One of the main sources of these annoyances is linked to transport. Indeed, road traffic in cities is mainly composed of combustion engine vehicles that are sources of pollution. Many cities exceed the pollutants concentration limits defined by the European Union. For instance, the city of Milan, Italy has exceeded the PM10 limit during 125 days in the period 2002-2007 (Rotaris et al. 2010). It inevitably has an impact on the health of inhabitants (Dockery et al. 1993), and also a cost for the society.
1 IPPC Press Release (2018):
https://www.ipcc.ch/site/assets/uploads/2018/11/pr_181008_P48_spm_en.pdf
2 International Energy Agency (2016): https://www.iea.org/statistics/co2emissions/
13,41 42% 7,87 24% 6,11 19% 2,72 8% 2,21 7%
Global CO
2emissions in 2016, GtCO
2Electricity and heat Transport
Industry Buildings Other
Some challenges described above have given rise to the concept of sustainable development. This notion has been defined as “development that meets the needs of the present without compromising the ability of future generations to meet their own needs”(Brundtland 1987). This definition clearly highlights the need to rethink many areas as the way energy is produced or the way people travel. Seventeen “Sustainable Development Goals” have been created by the United Nations3. They cover many themes such as poverty, hunger, climate change, and each goal has targets with indicators to meet. One of these goals is about sustainable cities and communities and some targets are about transports:
- Target 11.2: “By 2030, provide access to safe, affordable, accessible and sustainable transport systems for all, improving road safety, notably by expanding public transport, with special attention to the needs of those in vulnerable situations, women, children, persons with disabilities and older persons.”
- Target 11.6: “By 2030, reduce the adverse per capita environmental impact of cities, including by paying special attention to air quality and municipal and other waste management”, one of the indicators of which is “Annual mean levels of fine particulate matter (e.g. PM2.5 and PM10) in cities (population weighted).”
Many other goals can be linked to transport as shown in Appendix 1. As a consequence of this awareness, many cities are in the process of reviewing their mobility policies, facilitating the use of less polluting means of transport.
Bicycles can be regarded as a good alternative to private cars as they take less space, do not emit greenhouse gases or polluting particles during their use, are faster than walking, and are cheaper for the user and society. According to Gössling et al. (2019), the cost of car use is 0.885 €2017/km as a private cost and 0.108 €2017/km as an external cost, while bicycle has a private cost of 0.147 €2017/km and an external benefit of 0.184 €2017/km, in the case of the European Union.
Nevertheless, the proportion of bicycle use in daily travels varies greatly from one country to another as shown in Figure 2. Only few countries have a high rate of cyclists, as the Netherlands, Denmark or Finland. In the same time, many European countries have a huge proportion of citizens who never cycle. For instance, in France more than 50% of the population never cycle while this figure is only 18% in Denmark. Moreover, several associations try to develop the use of bicycle in different countries. It is the case of Cycling Embassy of Denmark or Dutch Cycling Embassy which
aims to help policy makers, architects, etc. all around the world to improve the way bicycles are considered thanks to their experience and knowledge. The French Federation of Bicycle Users works to connect local associations and promote the use of bicycles.
It is interesting to compare these two countries as they are both European, and both suffered from the energy crisis in the 1970’s. The two countries managed this event differently and Denmark improved conditions for cyclists with specific facilities.
Figure 2 - Breakdown of responses to the question "How often do you cycle" in the survey requested by the European Commission on attitudes of Europeans toward mobility (2013)
In September 2018, the French government has released the bicycle program, “Plan Vélo”, aiming at increasing the bicycle use proportion to 9% by 2024, which is equivalent to tripling the use in 6 years. The report highlights the benefits and barriers of using the bicycle in France. It also plans to create a national fund of 350 million Euros aiming at helping local authorities4. This amount reflects the French government’s desire to develop cycling throughout the country. However, bicycle use
4 Source: French government, “Plan vélo & mobilités actives”,
varies between cities. In Strasbourg the modal share of cycling is about 10%, while in Lyon it is around 2-3%5. Lyon is one of the largest French cities and therefore faces problems caused, among other things, by the massive use of cars (air pollution, noise, congestion…). The transition to sustainable transport seems to be an important goal for this city. Since the use of a means of transport can be greatly influenced by incentive policies, it seems valuable to look at countries where cycling level is high.
The cities of Copenhagen and Lyon are interesting subjects for study because surveys have been carried out recently, and the Danish capital city has strongly developed cycling culture in recent decades. Moreover, the two cities have rather similar characteristics such as their population size, and different bicycle use as it was 30% of all journeys in the City of Copenhagen in 2014, and 2.5% of all journeys in the City of Lyon-Villeurbanne in 2015 (‘Copenhagen City of Cyclists: The Bicycle Account 2014’ 2015; ‘Enquête déplacements 2015 de l’aire métropolitaine lyonnaise : Résultat sur le SCOT de l’agglomération lyonnaise’ 2016).
In the context described above, it is important to examine what differentiates countries from each other in terms of cycling use, and also what elements can lead to the development of cycling. The purpose of this thesis is therefore to answer the question: How can different factors affect use of
bicycle in different urban contexts? This thesis therefore aims to improve knowledge on the effect
of factors in a city where the level of bicycle use is high (here Copenhagen) and in a city where the level of bicycle use is low (here Lyon). It can be expected that between a city where almost everyone rides a bike and another city, some indicators tend to diverge on how they influence this use. It could then be proposed to identify elements from policies, urban planning and culture that could increase the modal share of cycling in a city where its use is low.
First, the study areas will be described in order to set up the working context. In a second part, a literature review will be carried out to find the results obtained so far in other research work and to clarify what can be expected from the upcoming analysis. Thereafter, the general methodology of the thesis will be described. Then, the presentation of the results and their analysis will be carried out. Finally, a part of the discussion will put into perspective what has been done in this thesis.
2. Copenhagen and Lyon: two similar cities but still with
differences
In this paper, two cities are studied: Copenhagen, the capital of Denmark, and Lyon, one of the most populated cities in France. It seems interesting to start with a brief description of the environment of these two cities, starting with the countries in which they are located.
2.1 France and Denmark, two countries with different
characteristics and environment
Although both countries are European and members of the European Union, there are wide disparities in many aspects such as geography, demography and economy.
In terms of geography, the two countries differ in particular in their location within the continent with France in Western Europe and Denmark in Northern Europe. In addition, the sizes of the two countries are totally different: while Denmark's area is about 43,000 km2 6, France's is about 15 times larger with nearly 633,000 km2 7. In the same way, the topography of the two territories is totally different, with Denmark showing a slight difference in altitude, while France is composed of different landscapes, some of which are mountainous. Finally, France is composed of a large continental territory called "Metropolitan France" with 13 regions, as well as many overseas territories, whereas Denmark is composed of 3 main parts: Jylland that links the country with Germany, Fyn one of the two main islands of the country, and Sjælland, the other island, where Copenhagen is located. Denmark borders only Germany, but a bridge (Øresundbron) with cars, trucks and trains now links the Copenhagen region to Sweden. France is adjacent to many countries such as Spain, Italy and Germany.
Then, in terms of demographics, the two countries are once again very different. Thus, the French population is estimated in 2019 at almost 67 million inhabitants8, while Denmark has about 5.8
6 Source: Statistics Denmark,
https://www.dst.dk/en/Statistik/emner/geografi-miljoe-og-energi/areal/areal
7 Source: Institut national de la statistique et des études économiques (INSEE),
https://www.insee.fr/fr/statistiques/1405599?geo=FRANCE-1
8 Source: INSEE,
million inhabitants9. Nevertheless, given the different areas of the two countries, the result is a higher population density in Denmark (134 inhabitants/km2) than in France (106 inhabitants/km2). Finally, in terms of economy, countries differ logically in terms of the weight of their GDP, but also in terms of GDP per capita. Indeed, France's GDP amounts to US$ 2,775 billion in 201810 (approximately US$ 41,400 per capita), while it is US$ 351 billion in 2018 (approximately US$ 60,500 per capita) in Denmark11. The unemployment rate is also very different between the two countries, with Denmark having a rate of 5.0% in 2018 (5.7% in 2017), while the unemployment rate in France is 9.1% in 2018 (9.4% in 2017)12. Finally, although both countries are members of the European Union and the Schengen area, Denmark is not a member of the euro zone and therefore has its own currency: the Danish krone (DKK), whose conversion rate is about 1 DKK = 0.134 €13.
These characteristics show that the two countries are different in many aspects. Nevertheless, it can be assumed that the cultures of the two countries are relatively close compared to other more distant countries.
2.2 The two study areas: Copenhagen and Lyon
As mentioned above, Copenhagen is the capital of Denmark, while Lyon is one of the main cities in France.
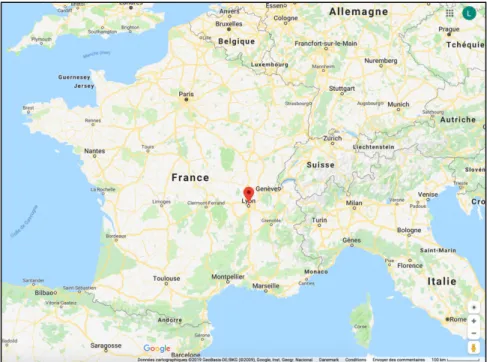
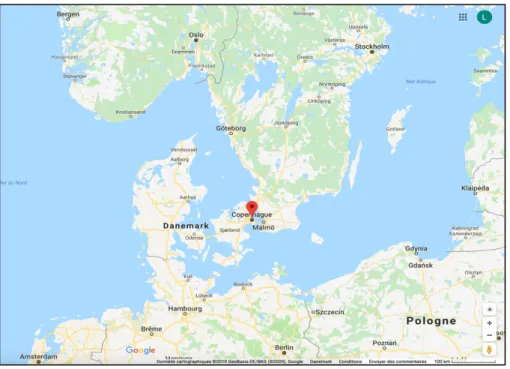
It seems interesting to start by locating these two cities in Denmark and France. As can be seen in Figure 3 and Figure 4, the two cities are located in different environments. While Copenhagen is
9 Source: Statistics Denmark,
https://www.dst.dk/en/Statistik/emner/befolkning-og-valg/befolkning-og-befolkningsfremskrivning/folketal 10 Source: International Monetary Fund (IMF),
https://www.imf.org/external/pubs/ft/weo/2019/01/weodata/weorept.aspx?pr.x=59&pr.y=10&s y=2018&ey=2018&scsm=1&ssd=1&sort=country&ds=.&br=1&c=132&s=NGDPD%2CPPPGDP&gr p=0&a= 11 Source: IMF, https://www.imf.org/external/pubs/ft/weo/2019/01/weodata/weorept.aspx?pr.x=66&pr.y=17&s y=2016&ey=2020&scsm=1&ssd=1&sort=country&ds=.&br=1&c=128&s=NGDP_RPCH%2CNGDP D%2CPPPGDP%2CNGDPDPC%2CPPPPC%2CPCPIPCH&grp=0&a= 12 Source: Eurostat, https://ec.europa.eu/eurostat/tgm/table.do?tab=table&init=1&language=en&pcode=tps00203 &plugin=1 13 Source: XE.com, https://www.xe.com/fr/currencyconverter/convert/?Amount=1&From=DKK&To=EUR
located on the Baltic Sea, near Sweden, Lyon is far from any coastline but is relatively close to Italy and Switzerland. The populations and areas of the cities of Copenhagen and Lyon are about 600,000 inhabitants over 87 km2 (6,900 inhabitants/km2)14 and 500,000 inhabitants over 48 km2 (10,400 inhabitants/km2)15 respectively. However, the two cities form a larger and more populated territory with their suburbs. Both cities have densely populated suburbs and are located close to other large cities (e. g. Malmö in Sweden for Copenhagen, and Saint-Etienne or Grenoble for Lyon). It is important to take into account a larger territory than that of municipalities alone, because mobility, even daily, is not limited to these areas alone. The geographical positions of the two cities also lead to a difference in climate and in daylight and darkness. Indeed, the duration of December 21st in Denmark is about 7 hours (sunrise at 8:37, sunset at 15:38), while it is 8 hours 40 minutes in Lyon (sunrise at 8:18, sunset at 16:58). On the other hand, on June 21, the day lasts 17 hours 32 minutes in Copenhagen (sunrise at 4:25, sunset at 21:57) and 15 hours 43 minutes in Lyon (sunrise at 5:50, sunset at 21:34).
Figure 3 - Location of Lyon, France - Source: Google Maps
14 Source : Statistics Denmark, https://statistikbanken.dk/statbank5a/default.asp?w=768 15 Source : INSEE, https://www.insee.fr/fr/statistiques/1405599%3Fgeo%3DCOM-69123
Figure 4 - Location of Copenhagen - Source: Google Maps
As presented above, the two cities have many geographical differences, but are rather similar in size (both in terms of area and population). Transport in both cities seems an interesting aspect to describe here.
First of all, the location of Copenhagen leads to a development of the city and therefore of its road network to the north, west and south, but the east is only served by the road over the Øresund bridge to Sweden. A few high-capacity roads converge towards the city, and rings surround the city and its suburbs. Lyon is served by highways from the 4 cardinal points, and a ring road surrounds the city from the north, east and south.
In terms of public transport, the two cities have different offers. Lyon has 4 metro lines, 5 tram lines, many bus lines and is served by national (and international) trains as well as regional trains in different stations. The city of Copenhagen also has a developed bus network, but no tramway and only two active metro lines (2 more are under construction, including one for September 2019). Nevertheless, there are 7 commuter train lines that also serve several stations in the city centre, and many regional and national trains serve cities further from Copenhagen. Finally, there is a regular train service between Sweden and Denmark. It may also be interesting to note that there are boats that serve several points in the city using the canals.
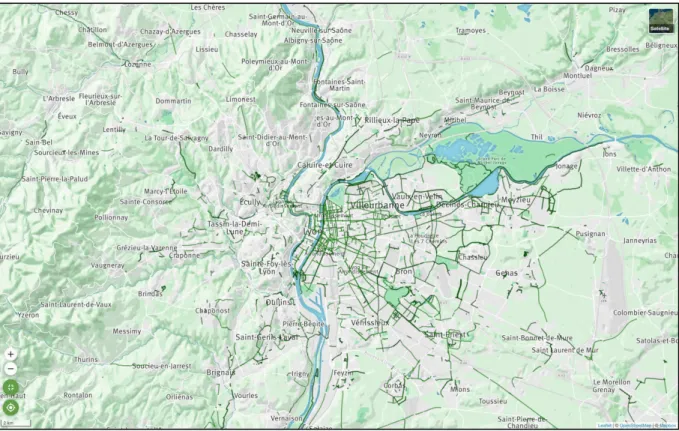
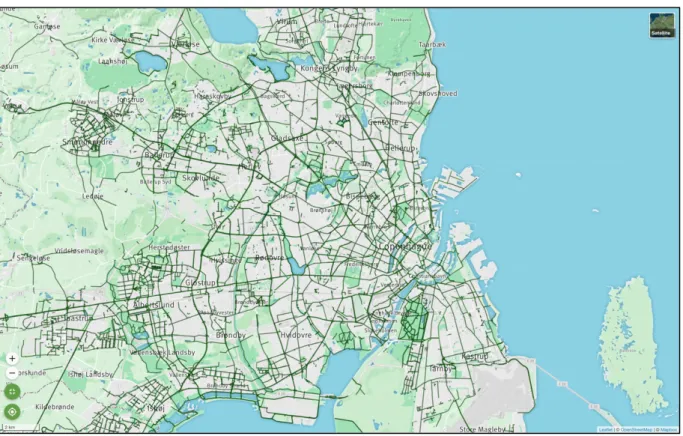
Finally, it is relevant to look at the cycling infrastructure in both cities. It appears that the two cities have very different bicycle infrastructure networks, as shown in Figure 5 and Figure 6 , which are on the same scale. These two quarters show in particular that cycle routes in Lyon are limited and that there is little continuity of cycle paths, contrary to what can be observed in Copenhagen.
Although the density of cycling development seems high in the centre of Lyon, it tends to decrease sharply as soon as the perimeter of the city of Lyon is exceeded, while infrastructure seems to continue throughout the Copenhagen urban area. In addition to cycling infrastructure, both cities have a bicycle rental system, "Vélo'v" for Lyon and "Bycyklen" for Copenhagen. While Vélo’v are normal 3-gear bicycles, Copenhagen city bikes are equipped with an electric motor to assist pedalling. Both systems offer similar pricing schemes in that occasional use is different from regular use. For instance, in Copenhagen it is possible to rent a bike by paying 30 DKK (approximately 4€) for each commenced hour, or to subscribe and get a certain amount of free usage time per month and then pay for each additional minute. In Lyon, for cycling occasionally, users have to pay a ticket for one day or one trip (4 € and 1.8 € respectively) with the first 30 minutes of each trip free, and then to pay for each additional time. It is also possible to subscribe and to have the first 30 minutes of each trip free.
Figure 6 - Bicycle infrastructures (in green) in Copenhagen, Denmark - Source: Geovelo
The cities of Copenhagen and Lyon therefore have some similarities but are also different in many respects, even in terms of the organisation of public transport and bicycle rental. It is interesting to present these differences and similarities because they provide part of the context of the study. The use of bicycles in these two cities will be described in a following section.
3. Literature review
3.1 Historical evolution of bicycle use
The use of the bicycle varies a lot from one country to another. These countries can be categorized in groups depending on the place that bicycles take in the mobility culture (Carré 1998). Carré distinguishes five groups: (i) countries where the bicycle is the main means of transport but the modal share is decreasing, (ii) countries where the bicycle is one of the main means of transport and stays at a high level, (iii) countries with a high level of cycling but decreasing for urban use, (iv) countries with less developed cycling infrastructures, and (v) countries with a really low use of bicycle and an uncertain future. Differences between countries can be explained by several factors. For instance, many countries where the use of bicycle used to be high but decreases for years, are countries with a recent strong increase in purchasing power, which increases citizens transport options and possibilities of car use. The situation of countries where bicycling has never been popular can be explained by different factors, such as a lack of tradition for cycling and policy support.
Over the years, the use of bicycles has evolved in society. According to Carstensen and Ebert (2012), the history of the bicycle can be divided into two eras: the “Golden Age of cycling” and the “Renaissance”. The first era corresponds to the technical development of the bicycle into a safe vehicle and the evolution of the culture. During the 1890s, students and merchants from the upper middle class were the main users of the bicycle. In the following years, the place of the bicycle has changed. Before the end of the nineteenth century, the bicycle was a leisure mode for the upper class, while in the middle of the twentieth century, it had become a popular means of transport. This trend is most pronounced in Denmark and the Netherlands, where the bicycle is a part of the national identity.
The interwar period corresponds to the raise of the car culture. This vehicle was seen as a huge technological progress offering a more practical means of transport. This period has seen the modal share of bicycling falling in all European countries. However, the cycling culture survived in Denmark and the Netherlands, where it was a national symbol. Moreover, in the 1970s and 1980s, the oil crisis revealed a dependence on potentially expensive and limited energy. Environmental awareness has been added to the existing elements leading to a “Renaissance” of the bicycle. For Carré, the same kind of chronological classification can be done in France. It includes three eras: “bourgeois age”, “popular age” and “ecological age”. These three periods are similar to the evolution of the cycling culture described by Carstensen and Ebert. While European countries have experienced almost the same economic and sociological events, the difference in bicycle use shows
that other factors need to be taken into account to explain why the proportion of cyclists differs considerably across countries.
3.2 Mobility within cities: externalities from the use of car and
bicycles as a solution
Even if national figures can give an idea of bicycle use, differences can exist between cities within the same country. For instance, the difference about bicycle culture in four English cities is explored in (Aldred and Jungnickel 2014). This paper reveals that it is important for policy makers to take into account all aspects of the local transport culture when it comes to change it. This article also highlights the need to analyse the mobility behaviour on a fine-scale, such as that of cities.
In today’s society, urban car use is at a high level, and the place it is given in cities is very important. The use of car is an issue for cities, as it is a transport mode with a high level of negative externalities. It should be recalled that negative externalities could be defined as external costs that are not borne by the user, but by the community. The main kinds of externalities can be identified as being road congestion, air pollution, noise and accidents (de Palma and Zaouali 2007; Santos et al. 2010). All these externalities have an impact on society, and research has sought to monetarize these effects to give them an economic meaning. As a result, citizens of cities suffer from health risk through air pollution, time lost through congestion, etc.
Moreover, the populations are sensitive to the financial crisis when it comes to mobility (Cascajo et al. 2018). In this paper, the effects of the financial crisis that emerged in 2007 are analysed through the Spanish case. The conclusion is that the financial crisis caused a decrease of the use of transport (car and public transport). The share of transport in household expenditures has been reduced, mainly by the decision of not buying new car and by reducing the use of car. However, the household wealth is a factor influencing how the transport budget has evolved. For instance, the richest households have hugely reduced their expenditures, while the poorest households could not strongly reduce their budgets as they were already as small as possible. This study also shows that the residential density is potentially related to the access to alternative means of transport. Moreover, the financial crisis forced Spanish cities to reduce their public transport operation costs. Some of them found a way to reduce the costs without decreasing the performance of their systems, but other had to decrease transport supply. This situation raises the question of how another means of transport could be used by the population at lower costs. Moreover, this issue is a current topic given the evolution of fuel prices and policies that discourage the use of polluting, and therefore often old, cars in cities.
Bicycles could be an answer to this question. Indeed, it appears that bicycle use is less expensive than the use of car (Gössling et al. 2019). This paper focuses on cost-benefit analyses used for transport projects. After a review of the different parameters taken into account to calculate the cost-benefit analysis, external and private costs of three transport modes are presented:
- Private cost:
o Car: 0.885 €2017/km; Bicycle: 0.147 €2017/km; Walking: 0.499 €2017/km - External cost:
o Car: 0.108 €2017/km; Bicycle: -0.184 €2017/km; Walking: -0.370 €2017/km
Another paper conducts a study in the city of Copenhagen and aims at doing a cost-benefit analysis to compare bicycle and car (Gössling and Choi 2015). The conclusion is that the total (for user and society) cost of car use is 0.511€/km, while it is 0.243 €/km for bicycle. As shown in Figure 7, it takes into account several elements as the time cost (through the travel time, which is longer as bicycle speed is lower), the vehicle operating costs, health impact of having an active mode, etc. Costs are allocated whether they are paid by the user or by the community.
Figure 7 - Average cost per kilometre for cycling/car for 2008 (Euro) (Gössling and Choi 2015) This cost gap is an important element in the socio-economic analysis of bicycle use. If it is perceived as such by users, it can affect their modal choice. It is also a way to show the social cost of these two means of transport.
3.3 The use of bicycle in Copenhagen and Lyon
In the two cities there are regular studies on the mobility of residents:
- The Bicycle Account, for Copenhagen, is a report released every 2 years since 1996 and is conducted by the City of Copenhagen.
- L’Enquête Ménage Déplacement is a survey regularly conducted in French cities. It has been conducted three times for the city of Lyon (1995, 2006 and 2015). The main results from these surveys are presented in various reports.
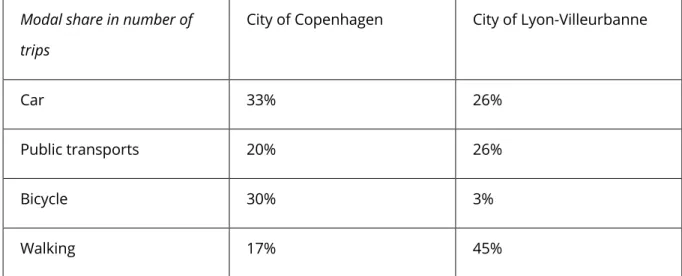
In order to have global information of the mobility in both cities, two of these reports are employed (‘Copenhagen City of Cyclists: The Bicycle Account 2014’ 2015; ‘Enquête déplacements 2015 de l’aire métropolitaine lyonnaise : Résultat sur le SCOT de l’agglomération lyonnaise’ 2016). The first deals with the use of bicycle in the City of Copenhagen. In 2014, the proportion of people who cycle to work and education was 45%. In 2004, this proportion was 36%, which corresponds to a large increase in 10 years. Other elements are presented, such as the satisfaction of users with state of cycle tracks which rose from 50% to 63% in the same period, and the number of casualties which has strongly decreased compared to 1995. The use of bicycle is less developed in Lyon, as the report shows. For inhabitants from the city of Lyon-Villeurbanne, the modal share was 3% in 2015, stable compared to 2006. However, this report shows comparison of modal share between 2006 and 2015: use of car has decreased by 10% while use of public transport and walking have increased by 6% and 4% respectively. The Table 1 highlights the breakdown of all journeys with start or stop in the two cities. The main results are the difference about use of bicycle, but also walking modal share which is significantly higher in Lyon-Villeurbanne than in Copenhagen. Although these two reports are based on data that do not have exactly the same scope of study, it is possible to identify a difference in mobility behaviours.
Modal share in number of trips
City of Copenhagen City of Lyon-Villeurbanne
Car 33% 26%
Public transports 20% 26%
Bicycle 30% 3%
Walking 17% 45%
Table 1 – Breakdown of the main transport modes trips in the cities of Copenhagen and Lyon (‘Copenhagen City of Cyclists: The Bicycle Account 2014’ 2015; ‘Enquête déplacements 2015 de l’aire
métropolitaine lyonnaise : Résultat sur le SCOT de l’agglomération lyonnaise’ 2016)
3.4 Understanding modal choice and determinants of the bicycle
use
The difference in bicycle use observed in Lyon and Copenhagen reveals that citizens from both cities do not make the same decisions about their mobility. According to De Witte et al. (2013),
there are three approaches to explain decision: (i) the rationalist approach, (ii) the socio-geographical approach, and (iii) the socio-psychological approach. The rationalist approach defines the choice made as the least costly alternative in terms of time and money (Shen, Sakata, and Hashimoto 2009). This approach also assumes that people have access to all the information about their travel and they all perceive the same characteristics. The socio-geographical approach takes into account the activities which are the reasons of the travel. This approach conducts to the inclusion of a spatial component in the modal choice. Then, the socio-psychological approach is related to psychological factors as attitudes, habits, norms, etc. Many papers conclude that a proper model of modal choice should consider economic aspects added with factors from geography and psychology. As a result, both objective and subjective factors would be taken into consideration.
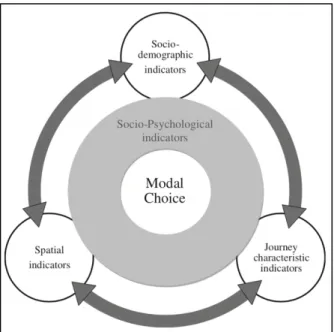
A structure describing the role of elements in the modal choice is composed of two aspects illustrated in Figure 8:
- Three types of determinants: socio-demographics indicators (age, gender, education, occupation, income, household composition, car availability), spatial indicators (density, diversity, proximity to infrastructure and services, frequency of public transport, parking), journey characteristics indicators (travel motive, distance, travel time, travel cost, departure time, trip chaining, information, interchange). These three types of determinants are linked, meaning they can influence each other.
- Socio-psychological indicators (experiences, familiarity, lifestyle, habits, perceptions), referring to subjective indicators.
Figure 8 - Illustration of the interaction of indicators in the modal choice process (De Witte et al. 2013)
So, the modal choice is defined as the result of interaction between socio-demographic, journey characteristics and spatial indicators mixed with subjective indicators through socio-psychological factors. This modal choice structure can be applied to different means of transport, notably bicycle. Many researches have been made on the use of bicycle, and many of them devote a part to the study of these determinants. The next parts will focus on the results found in the literature. For this purpose, articles reviewing the literature, such as (De Witte et al. 2013) and (Heinen, van Wee, and Maat 2010), were used.
3.4.1 Socio-demographics factors
Socio-demographics indicators allow to have a description of the traveller through information like age, education, etc.
Gender and age seem to have an effect on bicycle use. However, this effect depends on the average use of bicycle in the country/city studied. For instance, in a country with a low cycling level, men and young people are more likely to cycle (Aldred, Woodcock, and Goodman 2016). In a comparison of bicycle use in Stockholm and Copenhagen, the gender effect is observed as women are more likely to cycle in Copenhagen (Haustein et al. 2019). A survey conducted in Texas shows that socio-demographics characteristics, such as gender and age, are related to the perception of safety and quality of bicycle use: men and young people are likely to perceive it better (Sener, Eluru, and Bhat, n.d.). According to many other studies, the gender effect seems to depend on countries cycling level as described above, whereas the relation between cycling and age is not clear for some
studies but is in accordance with previous results for other studies (Heinen, van Wee, and Maat 2010).
Several studies show that other socio-demographics characteristics such as household incomes, household size, or car ownership have an effect too. For instance, in Portland, Oregon it appears that cycling level increases with incomes (Dill and Voros 2007). However, the relation between income and cycling is not clear, and some studies show that cycling is inversely proportional or simply not related to income (Heinen, van Wee, and Maat 2010). An increase of the number of cars in the household leads to the fall of the bicycle used (Parkin, Wardman, and Page 2007). Moreover, it appears than education level is linked to bicycle use. Indeed, a higher education level increase propensity to cycle (Handy, Xing, and Buehler 2010). According to studies made on adolescent’s population in Germany and the Netherlands, socioeconomic status and parents working status affect the modal choice: for instance, having working parents seem to increase bicycle use for adolescent from Rotterdam, while having a lower socioeconomic status seem to decrease bicycle for German adolescents (Bere et al. 2008; Reimers et al. 2013; Debruijn et al. 2005).
So far, numerous studies were conducted on the effected of socio-demographics factors on the use of bicycle. However, not all results seem to converge and the way some factors influence cycling appear to be depending on level of cycling in the country or the city.
3.4.2 Spatial indicators
Spatial indicators are defined as “elements characterizing the spatial environment in which the journey and thus modal choice takes place”, and it refers to different factors such as population density, land-use diversity, or parking, that can have effect modal choice (De Witte et al. 2013). It appears that cycling propension increased with urbanized areas and land-use mixture (Harms, Bertolini, and te Brömmelstroet 2014; Heinen, van Wee, and Maat 2010). It can be linked with the fact that more shops, workplaces, etc. are accessible on a small distance. The size of the city can also be an element influencing the probability to use bicycle. Two studies show that small- and medium-sized cities have the highest bicycle share probability in the Netherlands (Heinen, van Wee, and Maat 2010). In the same article, it appears that denser road structure can have a positive influence on bicycle use, but it is not clear as other studies show that there is no significant relation. In addition to urbanization status, bicycle facilities can be considered as determinants too. For instance, safe parking possibilities is perceived as a good point for cyclists (Hunt and Abraham 2007). Bicycle paths are taken into account by potential cyclists, and comparative analyses show the link between cycling facilities and the modal share of cycling, as well as traffic lights that require
cyclists to stop and accelerate (Heinen, van Wee, and Maat 2010). Then, the way car parking facilities are located in the street can have an influence on safety but results are not clear about that (Heinen, van Wee, and Maat 2010).
Hilliness is also expected to be an important factor, but studies show that the perception and preference to flat or hilly area depends on the motives of the trip (daily commuting or sport, for instance) and the cyclist’s level of experience (Heinen, van Wee, and Maat 2010). One explanation can be that unexperienced cyclists prefer flat area, compared to experiences ones. However, a lot of determinants and factors have to be taken into account.
Various spatial indicators seem to have an effect on the use of bicycle, but a significant part of these spatial characteristics might be related to the perception of each cyclist.
3.4.3 Journey characteristics
Journey can be described through several characteristics such as the weather, the distance, information, etc. All these characteristics have potentially an effect on modal choice, thus on bicycle use.
About weather condition, it appears that temperatures and precipitations have a negative effect on commute bicycling (Nielsen, Mulalic, and Christiansen 2016; Nankervis 1999; Bergström and Magnusson 2003; Parkin, Wardman, and Page 2007). Precipitation and chance of rain would be the most negative weather aspect, but the way it is measured can conduct to different results (Heinen, van Wee, and Maat 2010). Temperature is also a significative factor but depending on characteristics of cyclists. It appears that commuters are less influenced by temperature than other cyclists (Heinen, van Wee, and Maat 2010).
Distance is a factor that impacts the use of bicycle (Handy, Xing, and Buehler 2010; Heinen, van Wee, and Maat 2010; Parkin, Wardman, and Page 2007). Indeed, the distance is often related with time and effort, two aspects that seek to be minimized.
Other journey characteristics also play a role in the use of bicycle. For instance, travel costs (not only cycling costs but other means of transport too) is related to cycling, and having free public transport tends to decrease cycling modal share. As an opposite effect, it can be expected that paying people to commute by bicycle would have a positive effect. It can be illustrated by the “bicycle kilometric allowance” that exists in France.
Journey characteristics can have significant effects on the use of bicycle. But once again, the perception of each cyclists is taken into account.
3.4.4 Socio-psychological indicators
As de Witte points out, socio-psychological factors are part of the modal choice process in the sense that they influence the traveller's final decision. This aspect of socio-psychological factors is linked to the theory of planned behaviour, which is combined with the effect of socio-demographic determinants and trip characteristics. The theory of planned behaviour has been constructed by Icek Ajzan and is composed of three main aspects (Milković and Štambuk 2015; Heinen, van Wee, and Maat 2010): (i) attitude that corresponds to the traveller's perception and evaluation of the use of the mode of transport, (ii) perceived social norms that are linked with the modal choice process by the pressure that is felt by the traveller about the mode of transport used, and (iii)
perceived behavioural control that refers to the way people perceive if it is easy or difficult for
them to perform a behaviour.
However, these three aspects from the theory planned behaviour do not seem to cover all the elements related to the socio-psychological indicators. Thus, while the theory of planned behaviour assumes that decisions are based on rational choices, it seems that other elements such as habits can put this assumption into question (Heinen, van Wee, and Maat 2010).
Different studies show that modal choice is not only linked to socio-demographic and instrumental attributes but also to hedonic, symbolic and affective attributes (Steg 2005; Schuitema et al. 2013; Hunecke et al. 2007). These studies, which focus on different modes of transport, underline that policy makers must consider all these elements if they want to effectively promote one mode of transport over others.
The attitude towards car use is generally more positive than that towards bicycle use (Heinen, van Wee, and Maat 2010). In that way, the use of bicycle depends on the evaluation people make of cycling, but also of other vehicles. For instance, if someone considers car use negatively, he/she is more likely to use another means of transport that can be bicycle. Moreover, attitude is related to symbolic and affective motives, that have an effect on the use of certain transport modes (Steg 2005). Then, the pressure related to social norms seems to have a strong effect on the use of a specific mean of transport (Heinen, Maat, and Wee 2011). For instance, non-cyclists surrounded by a high number of cyclists are more likely to consider cycling (Aldred and Jungnickel 2014). One study combines social norms and personal norms into ecological norm and is related with the use of environmental friendly means of transport (Hunecke et al. 2007). In the case of bicycles in particular, it appears that social norms are important in the modal choice process, including the perception of better support (Heinen, van Wee, and Maat 2010). The aspect of perceived
differently possibilities and barriers to cycle (Heinen, van Wee, and Maat 2010). It appears that it is an important factor in the choice of using a bicycle (Milković and Štambuk 2015). However, these three aspects rely on rational choices, whereas other element can be taken into consideration.
Habits need to be break, and bicycle use seems to be related to that. Indeed, the propensity to
use a bicycle increases with the fact that cycling is often practiced (Heinen, van Wee, and Maat 2010). On the other hand, it can be assumed that the habit of using another means of transport requires an additional effort to be transformed into cycling.
This literature review highlights the many factors that seem to be linked to the modal choice process. While some individual indicators but also spatial and trips characteristics are linked to modal choice, socio-psychological elements influence the traveller's final decision. The influence of factors differs according to the means of transport studied. In the case of cycling, the results in the literature sometimes converge but also often diverge. It seems that the results depend on certain elements such as the study areas or the way the data are considered. However, some articles dealing with the effect of different factors on modal choice highlight that not only infrastructural or socio-demographics attributes are related to that choice, but socio-psychological factors, such as symbolic and affective motives, also play a significant role in this process, thus, these articles indicate that policy makers should rely not only on socio-demographic elements, but also on the influence of these socio-psychological factors . In the end, this literature review can give a first idea of the determinants that could be revealed in the case of Copenhagen and Lyon. The following studies will confirm or refute these results.
3.5 Research questions
As presented previously, the modal choice process refers to many factors and the objective of this study is to determine the different factors that influence the use of bicycle in a city with a high cycling level and in a city with a low one in order to answer to the general question: How can different factors influence modal choice by favouring cycling? As reminder, the modal choice process can be described as being relative to several factors: (i) socio-demographic, spatial and journey indicators, and (ii) socio-psychological indicators. The broad objective of this work is to study the influence of different factors on the use of bicycle in two cities in order to provide information on how to promote cycling. It appears interesting to these determinants cannot be studied according to the same methodology, and it is therefore proposed to conduct the entire study in two parts described below.
The first part of this thesis aims at identifying and comparing the effects of the first (i) kind of factors between the cities of Copenhagen and Lyon. As illustrated in previous papers, it appears that in high cycling cities and low cycling cities these factors could have different effects. For instance, gender and age affect the use of the bicycle differently depending on the cycling level of the city. For factors like income and education, the effects are less clear. The main research questions are: How socio-demographic, spatial and journey characteristics affect bicycle use in Copenhagen and Lyon? Do they have the same effects in the two cities? As quantitative data are available for both cities, it seems valuable to carry out a statistical analysis to determine the influence of factors, and to compare them. According to the literature and the classification of Lyon and Copenhagen in low cycling cities and high cycling cities respectively, some results can already be expected. It is the case of gender and age influences that might be significant in Lyon but not in Copenhagen.
The second objective is to focus on the cycling culture in Copenhagen and its perception. As several papers show, psychological aspects are a part of the modal choice process. These socio-psychological factors are composed of attitudes, social norms, etc. It seems interesting to study this aspect in the case of Copenhagen, a capital city where many international students and workers come, and where the cycling culture is strongly established. The main research questions are: How do Copenhagen newcomers perceive this culture? What are the main aspects that encourage or discourage them to use bicycles? Would it be a benefit for low cycling countries to implement aspects of the Danish cycling culture? In this context, it seems appropriate to study how foreigners living in Copenhagen, as they are residents with an external point of view, about their perception of the cycling culture, and their behaviour and thoughts about this means of transport. It can be expected that the short-term residents’ perception depends on the place where they used to live before, and the experiences they had. As cycling infrastructures are highly developed, it can encourage people to bike, but crowded cycle lanes and excessive speed of some cyclists may be discouraging. It can also be expected that bicycle use is related to alternatives in the cities: for example, high public transport prices may encourage people to choose or switch to another transport mode.
4. Methodology
In order to answer the various research questions asked previously, a general methodology has been put in place. In this section, the organization of the methodology will be presented before describing more precisely each important aspect of it.
4.1 Overall methodology of the thesis
The purpose of this thesis is to answer the problem proposed in the introduction. So, the aim is to identify the elements that influence bicycle use in urban areas. As noted in the literature review, there are many factors involved in the modal choice process. These may be characteristics specific to the individual, as well as perceptions of the environment or characteristics related to the journey being considered. As mentioned above, this paper seeks to analyse two aspects of bicycle use: the differences that can emerge in the determinants of bicycle use between two different cities, and those that explain why use is so important in Copenhagen. To this end, the work has been divided into two main parts: (i) statistical analysis of surveys carried out in Copenhagen and Lyon in order to reveal the determinants and compare them with each other, and (ii) study of the perception of bicycle use in Copenhagen. The two analyses carried out required a certain methodology, which will be described in the following sections and can be summarised through the Figure 9.
The white boxes correspond to the different elements, whereas the blue ones correspond to the operations made during all the studies. This general methodology will be detailed in the following parts, first about the data analysis and comparison, and then about the interviews.
4.2 Analysis of the two data sets
As described above, two studies are carried out in this paper. The first consists of the statistical study of two surveys conducted in Copenhagen and Lyon. As the two surveys have been made differently, the first step in this study is to present the origins of the data and what make them different. Once the main differences have been revealed, and in order to compare these data statistically, it is necessary to select comparable data and construct variables with similar structures. Finally, the statistical study is carried out using different tools that will be presented later.
4.2.1 Two data sets, two different origins
As mentioned above, the two surveys were conducted independently, by different entities, and using different methods. It is therefore interesting to present the origin of these two surveys in order to highlight their differences.
4.2.1.1 TU data
The Transportvaneundersøgelsen (TU) is the Danish National Travel Survey. Its history is composed of three temporal parts. The first one starts in 1976 with a first survey, then followed by two other surveys in 1981 and 1986. The second generation of the surveys lasts from 1992 to 2003, and a lot of changes were made during this period. After two years without survey, due to withdrawal of financing, the current and third generation of the survey has been launched in May 2006 and is still running now (Christiansen and Skougaard 2015). These data were provided by the Danmarks Tekniske Universitet (Technical University of Denmark - DTU), through DTU Transport16.
Concerning the survey process, the target population is Danish residents from 9 to 84 years old, and the respondents are selected through the Danish Civil Registry (CPR) which provides a registration number to all Danes and people living in Denmark. The CPR allows to have access to information on gender, age, address, etc. In general, the travel survey is expected to have 1,000 respondents per month which corresponds to 60% answer rate compared to the initial target of
20,000 respondents per year. Then, the final information come from web and telephones interviews. These interviews are conducted on a continued time period which means that for almost each day of the year there are corresponding interviews.
Then, data are structured in 6 tables which are: Session, journey, Tur (Trip), Deltur (Trip stage), Household and Bil (Car). All these tables allow to have numerous information about respondents, but also household situations and trips characteristics.
4.2.1.2 EMD data
The Enquête Ménage Déplacement (EMD) is a survey conducted in different French cities. It is conducted by cities with the help of the French State and the CEREMA (Centre d'études et d'expertise sur les risques, l'environnement, la mobilité et l'aménagement - Centre of studies and expertise on risks, environment, mobility and development). A common method has been created during the 1970s and is still updated. The use of this common method allows to have comparable results through space and time. Data of this thesis were provided by the Laboratoire Aménagement Économie Transports (Transport, Urban Planning and Economics Laboratory – LAET).17
The survey was conducted through face-to-face or phone interviews from the 7th October 2014 to 11th April 2015 and there were 27,000 respondents18. The information collected can be classified into 4 groups: Ménage (Household), Personne (Respondent), Déplacement (Journey) and Trajet (Trip). In addition of this data from two surveys, it has been decided to use weather data19 to enrich the analysis considered. These weather data are composed of different elements for each day of the year, such as amount of rain (in millimetre) or the coldest temperature of the day.
As the two methods are different, there are inconsistencies between the data. For example, data from Lyon were collected on a specific time period, from October 2014 to April 2015, whereas data from Copenhagen are collected every day. In addition, tables do not match exactly as names given do not reflect the same meaning in the two datasets as it is explained in Table 2, and some variables in one dataset are not present in the other, and inversely. It is the same problem with modalities of each variable that can be completely different between the two datasets. Moreover, the data are collected on different scopes. While EMD data come from a precise area that corresponds to
17 Data source: Laboratoire Aménagement Économie Transports, http://www.laet.science/ 18 Source: www.sytral.fr/359-enquete-grand-territoire.htm
Lyon metropolitan area (more than 500 towns compose this area), TU data are collected throughout Denmark, not only the Copenhagen area. As it is not useful to compare the mobility within a country and within an urban area, it is necessary to select proper area from the two datasets. The step of selecting proper similar variables and proper scopes will be defined in the next part.
4.2.2 Data selection
As explained in the previous part, data from the two surveys have different characteristics. These differences result in the need to select data to make the comparison consistent.
Each data set is composed of different tables where elements are linked by “id” variables such as SessionId or JourneyId for TU data, and id_menage or id_personne for EMD data. Each table contains different information related to a specific topic. Tables from TU and EMD data have approximatively the same names, except that they do not always refer to the same kind of variables.
TU data from Copenhagen EMD data from Lyon Comments
“Journey”: it is the entire journey of a day, from home and return to home. Each journey is divided into 2 or more trips.
“Trip” (Tur): it is a trip from one stay/activity to another. Each trip is divided into 1 or more stages.
“Journey” (Déplacement): it is a trip from one stay/activity to another.
If 2 or more modes of
transport (all except walking), it is divided into “trips”.
A primary mode is
determined following two different rules:
- Copenhagen: the primary mode is defined as the mode which has the largest length sum during the trip
- Lyon: the primary mode is the one that is the highest in the hierarchical
classification of modes established by CEREMA “Trip stage” (Deltur): it is one
usage of a mode of transport on the trip.
“Trip” (Trajet): it is one usage of a mode of transport on the “journey”.
Table 2 - Different tables from the two data sets
The fact of travelling can be defined in different ways. The use of one mode of transport can be used as a definition (it corresponds to Trip stage and Trip for TU and EMD data), as well as the transition from one activity to another, or a loop whose starting and ending point is the home. It has been decided to focus on trips defined as transition from one activity to another, so the two tables used are Trip from TU data and Journey from EMD data.
As the two surveys were conducted on different spatial and temporal scales, the data must be sorted in order to obtain comparable information. Thus, the selected TU data are from October to March for the couples of years 2013-2014, 2014-2015 and 2015-2016 in order to match Lyon’s survey that had been conducted from October 2014 to March 2015 (even if some interviews were conducted in April 2015, the latest data remaining are from March 2015). It has been decided to use three couples of years for TU data, as it allows to have more trips, in addition on a similar time of year (October-March).
Similarly, the spatial scales are different as the TU data cover trips throughout Denmark, while EMD data covered the trips on 500 cities within Lyon region. The two study areas selected are: Greater Lyon (Grand Lyon) and Greater Copenhagen (Storkøbenhavn). These two areas have approximatively the same population (about 1.3 million inhabitants) and close area size (530km2 for Greater Lyon and 615km2 for Greater Copenhagen) which lead to a similar density (2,587 inhabitants/km2 and 2,148 inhabitants/km2 respectively).
Other criteria are used to get samples with similar characteristics. For instance, the age ranges of people surveyed are not the same between the two data sets. It has been decided to select the data to match the two ranges. Thus, as the age range of the data from Copenhagen is the most restrictive one (the lowest age is higher than the lowest age from EMD, and the highest age is lower than the highest age from EMD), it has been decided to keep from EMD data only the trips where the user was between 9 and 84 years old.
At this point, the data from Lyon and Copenhagen areas are composed of 53,268 and 9,501 trips respectively.
The next step is the selection of interesting variables to analyse. They have been selected according to literature review, but also and above all, on the basis of the possibility of matching the variables between the two data sets. In addition to the selection of variables, it is necessary to check if modalities match between variables of the two datasets. Some of the variables have completely different modalities (notably variables related to education level or transport modes) and required to create similar modalities. After having selected the proper data and made modalities to match between variables, the statistical analysis can be done. The next part will present the methodology used to conduct the statistical analysis of the data.
4.2.3 Methodology used for statistical analysis of the data
The data available for this first study make it possible to consider carrying out statistical analyses. The data considered here correspond to the data that has been previously selected. The first part of the method is therefore based on the production of univariate descriptive statistics of the two samples, in order to have a first overview of the differences between the two surveys. Among the selected variables, some can be considered quantitative, i.e. corresponding to a scale of measurement (e.g. age), while others are categorial (e.g. level of education). For the first category, the quantitative variables, the descriptive statistics used correspond to certain simple indicators such as the average, minimum value, median, etc. For the second category, the description is based on the distribution of users of each trip in the different categories of variables. The distribution is expressed in percentage in order to have an idea of representativeness. This description makes it possible to identify the similar characteristics of the two surveys, and those on which they differ. Then, it seems interesting to look at the relationship between the variables and the mode of transport used. Thus, the production of bivariate descriptive statistics makes it possible to illustrate the potential links between variables and modal choice. It is also a way to provide a kind of typical profile for some categories of users. Although the significance of the observed links cannot be verified by descriptive statistics alone, they provide an overview of the different categories of individuals and their modes of transport, as well as the link between the characteristics of the journeys and the mode of transport used.
As a reminder, the purpose of this study is to determine the different factors that influence bicycle use, and to compare them between Copenhagen and Lyon. Many articles in the field of transport, but also in any other field where statistical studies are carried out, analyse survey data using logistic regression. Here, the objective is the identification of determinants that make it possible to differentiate between two groups of trips: (i) those made by bicycle, (ii) those made with another means of transport. An interesting working paper from the French National Institute of Statistics