Research unit of biomechanics and imaging in cardiology
Ultrafast echocardiography
In vitro and in vivo study using diverging circular beams
by Daniel Posada
Memoire submitted to the faculty of graduate studies to obtain the title of Master of Science in biomedical engineering.
August 31, 2015
Research center, University of Montreal hospital (CRCHUM)
Department of physiology, Faculty of medicine
ii
Resumé
Grâce à son accessibilité, sa polyvalence et sa sécurité, l'échocardiographie est devenue la technique d'imagerie la plus utilisée pour évaluer la fonction cardiaque. Au vu du succès de l'échographie ultrarapide par ondes planes des techniques similaires pour augmenter la résolution temporelle en échocardiographie ont été mise en œuvre. L’augmentation de la résolution temporelle de l’échographie cardiaque au-delà des valeurs actuellement atteignables (~ 60 à 80 images par secondes), pourrait être utilisé pour améliorer d’autres caractéristiques de l'échocardiographie, comme par exemple élargir la plage de vitesses détectables en imagerie Doppler couleur limitées par la valeur de Nyquist. Nous avons étudié l'échocardiographie ultrarapide en utilisant des fronts d’ondes ultrasonores divergentes. La résolution temporelle atteinte par la méthode d'ondes divergentes a permis d’améliorer les capacités des modes d’échocardiographie en mode B et en Doppler couleur. La résolution temporelle de la méthode mode B a été augmentée jusqu'à 633 images par secondes, tout en gardant une qualité d'image comparable à celle de la méthode d’échocardiographie conventionnelle. La vitesse de Nyquist de la méthode Doppler couleur a été multipliée jusqu'à 6 fois au delà de la limite conventionnelle en utilisant une technique inspirée de l’imagerie radar; l’implémentation de cette méthode n’aurait pas été possible sans l’utilisation de fronts d’ondes divergentes. Les performances avantageuses de la méthode d'échocardiographie ultrarapide sont supportées par plusieurs résultats in vitro et in vivo inclus dans ce manuscrit.
Keywords – Echocardiographie ultrarapide, onde divergente, onde plane, multiple PRFs commutées, Doppler couleur ultrarapide, extension de la vitesse de Nyquist
iii
Abstract
Because of its low cost, versatility and safety, echocardiography has become the most common imaging technique to assess the cardiac function. The recent success of ultrafast ultrasound plane wave imaging has prompted the implementation of similar approaches to enhance the echocardiography temporal resolution. The ability to enhance the echocardiography frame rate beyond conventional values (~60 to 80 fps) would positively impact other echocardiography features, e.g. broaden the color Doppler unambiguous velocity range. We investigated the ultrafast echocardiography imaging approach using ultrasound diverging waves. The high frame rate offered by the diverging wave method was used to enhance the capabilities of both B-mode and color Doppler echocardiography. The B-mode temporal resolution was increased to 633 fps whilst the image quality was kept almost unchanged with reference to the conventional echocardiography technique. The color Doppler Nyquist velocity range was extended to up to 6 times the conventional limit using a weather radar imaging approach; such an approach could not have been implemented without using the ultrafast diverging wave imaging technique. The advantageous performance of the ultrafast diverging wave echocardiography approach is supported by multiple in vitro and in vivo results included in this manuscript.
Keywords – Ultrafast ultrasound, Ultrafast echocardiography, Diverging wave, Plane wave, Staggered multiple-PRF, Ultrafast color Doppler, Nyquist velocity extension
iv
Acknowledgements
This memoire concludes my master degree in biomedical engineering at the University of Montréal. The main focus of my master was the ultrafast echocardiography technique using diverging waves to enhance both the temporal resolution and Nyquist velocity range known in conventional echocardiography. The work done included both in vitro and in vivo experiments that facilitated the validation of the researched imaging strategies.
I would like to express my deepest gratitude to my supervisor, Professor Damien Garcia at the university of Montreal hospital research center (CR-CHUM), for giving me the opportunity to participate of his research project, for introducing me to the ultrasound imaging field and for his unconditional support.
I would also like to thank my colleagues at the LBUM laboratory for all their help, fruitful discussions and ideas in regard to my project. I would like to express my special appreciation to Boris, research assistant at the LBUM laboratory, for helping me with all the in vitro setups and solving technical issues.
Lastly, I would like to thank my wife and mother for supporting me throughout this experience; it would not have been possible without their support.
Montreal, August 31, 2015
Daniel Posada
v
Contents
Resumé ... ii Abstract ...iii Acknowledgements ... iv Contents ... v List of abbreviations ... ix List of symbols ...x Chapter 1 - Introduction ... 11.1 Conventional ultrasound vs ultrafast ultrasound ... 2
1.2 Research hypothesis... 3
1.3 Aims of study ... 3
1.4 Project methodology ... 3
1.5 Memoire outline ... 4
1.6 Supplementary Work ... 4
1.7 List of publications and presentations ... 5
Chapter 2 - Cardiac hemodynamics, Echocardiography and vector blood velocity imaging ... 7
2.1 Cardiac anatomy and left ventricle hemodynamics ... 7
2.1.1 Cardiac hemodynamics ... 9
2.1.2 Left ventricle vortex and its use as a cardiac function marker ... 10
2.2 Echocardiography examination review ... 11
2.2.1 The transthoracic echocardiography approach (TTE) ... 11
2.2.2 The transesophageal echocardiography approach (TEE) ... 14
2.2.3 Conventional echocardiography capabilities ... 14
2.2.4 Conventional echocardiography limitations and improvement opportunities ... 16
2.3 Vector blood velocity imaging techniques ... 16
2.3.1 Cardiac magnetic resonance (CMR) ... 17
2.3.2 Echocardiography particle image velocimetry (Echo–PIV) ... 18
vi
2.3.4 Velocity vector flow imaging techniques remarks ... 19
2.4 Color Doppler VFM - limitations and motivation ... 20
Chapter 3 – Ultrasound imaging background ... 24
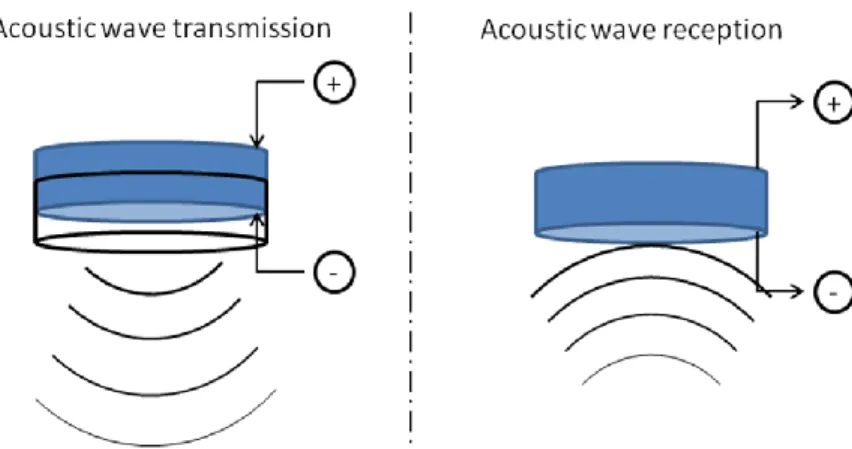
3.1 The piezoelectric effect (Ultrasound wave generation-acquisition) ... 25
3.2 Ultrasound imaging linear arrays ... 26
3.2.1 Phased arrays delay law ... 27
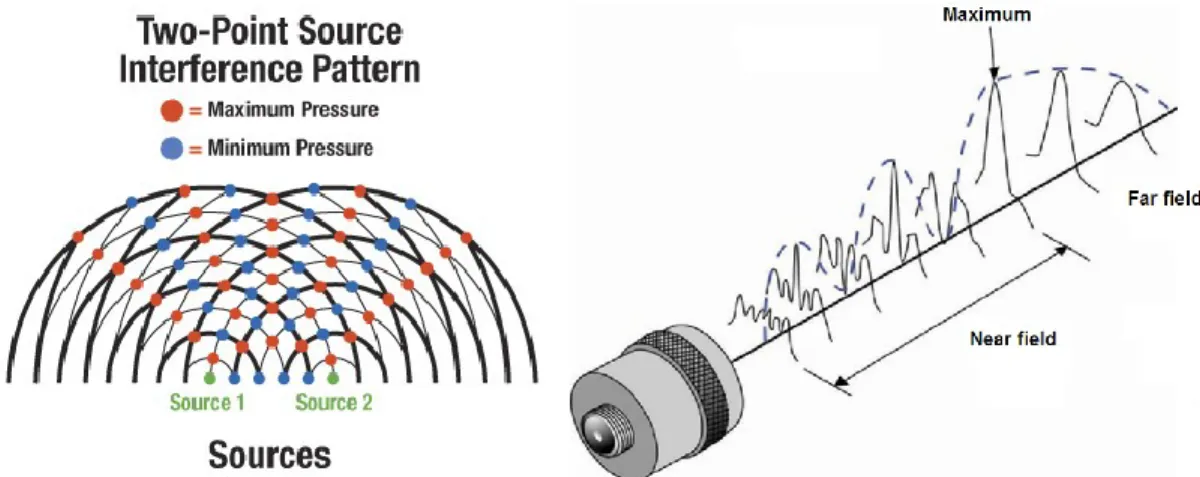
3.2.2 Single elements and phased arrays radiation patterns ... 27
3.2.3 Phased arrays beam steering ... 30
3.3 Ultrasound waves interaction with soft tissues ... 31
3.3.1 Ultrasound propagation velocity and acoustic impedance ... 31
3.3.2 Ultrasound waves attenuation ... 32
3.4 Ultrasound imaging using the pulse-echo principle ... 32
3.4.1 A-Lines, B-mode and color Doppler ultrasound ... 33
3.4.2 Time gain compensation ... 34
3.4.3 Ultrasound Image formation (Beamforming) ... 34
3.4.4 RF signals demodulation into IQ components ... 36
3.4.5 Compression and image display ... 37
3.5 Temporal resolution (Frame rate) ... 38
3.6 Ultrafast ultrasound and coherent compounding ... 38
3.6.1 Ultrafast ultrasound motion artefacts ... 40
3.7 B-mode ultrasound image quality ... 40
3.8 Doppler ultrasound ... 41
3.8.1 Ultrasound scattering by red blood cells ... 43
3.9 Pulsed-wave Doppler imaging (spectral representation) ... 43
3.10 Color Doppler imaging... 45
3.10.1 Color Doppler Clutter rejection filters (Wall filter) ... 46
3.10.2 Color Doppler limitations ... 48
Chapter 4 - Ultrafast echocardiography using full aperture diverging beams ... 53
4.1 Introduction ... 53
4.1.1 Ultrafast ultrasound ... 54
vii
4.2 Methods ... 55
4.2.1 Plane wave imaging inspiration ... 55
4.2.2 Diverging circular beams transmission ... 55
4.2.3 Diverging circular beams radiation pattern simulation ... 57
4.2.4 Diverging circular beams steering delimitation ... 58
4.2.5 Experimental approach ... 60
4.2.6 Lateral resolution and CNR in vitro assessment ... 60
4.2.7 In vivo examinations ... 62
4.3 Results ... 62
4.3.1 In vitro investigation of the on-axis lateral resolution and CNR ... 62
4.3.2 On-axis lateral resolution response to the sector-scan width ... 64
4.3.3 In vitro investigation of the off-axis lateral resolution ... 65
4.3.4 Tilted echocardiographic images using diverging circular beams ... 66
4.3.5 In vivo results ... 69
4.4 Conclusion ... 70
Chapter 5 - Staggered multiple-PRF ultrafast color Doppler ... 74
5.1 Introduction ... 75
5.1.1 Ultrafast color Doppler ... 75
5.1.2 Aliasing in color Doppler imaging ... 76
5.1.3 Extending the Nyquist velocity ... 76
5.2 Methods ... 77
5.2.1 Existing dual-PRF techniques... 77
5.2.2 Theoretical background – Staggering the PRF to extend the Nyquist velocity ... 77
5.2.3 In vitro analysis – spinning disc and free jet flow ... 82
5.2.4 In vivo validation – ventricular filling & carotid artery ... 82
5.2.5 Ultrasound sequences – dual- and triple-PRF emissions ... 83
5.2.6 Doppler velocity estimation ... 84
5.3 Results ... 85
5.3.1 In vitro spinning disc ... 85
5.3.2 In vitro flow jet ... 87
viii
5.4 Discussion ... 89
5.4.1 Limitations ... 90
5.4.2 Frame rate reduction due to of the staggered multi-PRF transmission scheme ... 90
5.4.3 Adaptive regression clutter filtering ... 91
5.5 Conclusion ... 92
5.6 Acknowledgments ... 92
5.7 Appendix ... 93
5.7.1 Demonstrations of expressions (5.4), (5.12) and (5.15) ... 94
Chapter 6 - Limitations, further work and concluding remarks ... 101
6.1 Limitations ... 101
6.2 Further work ... 102
ix
List of abbreviations
AICc: Akaike’s information criterion
AV: Aortic valve
ceiling(): ceiling function
cm: Centimetre
CNR: Contrast to noise ratio CW: Continuous wave ultrasound DCB: Diverging circular beam
Echo-PIV: Echographic particle image velocimetry floor(): floor function
Hz: Hertz
IQ: In-phase and quadrature signal components IVC: Isovolumetric contraction
fps: Frames per second
FWHM: Full width at half maximum lcm(): Least common multiple function
LV: Left ventricle
LVOT: Aortic out-flow-tract max : Max absolute value
mm: Millimetre
mod(): modulus function
m/s: Meters per second
MLA: Multiline acquisition ultrasound approach
MV: Mitral valve
nint(): nearest integer function
NRMSE: Normalised root-mean-square error PRF: Pulse repetition frequency
PW: Pulsed wave ultrasound
PZT: Piezoelectric
RF: Radiofrequency
RMSE: Root-mean-square error
ROI: Region of interest
RSS: Sum of squares of the residuals 𝑇𝐺𝐶𝑁: Gain compensation function
VFM: Vector flow mapping
TEE: Transesophageal echocardiography TTE: Transthoracic echocardiography
US: Ultrasound
VBV: Vector blood velocity imaging
2D: Two-dimensional
x
List of symbols
𝑎 Material frequency-dependent attenuation 𝛼 Attenuation coefficient
A Amplitude decay
A0 Wave original amplitude
𝐴 Aperture area
𝑏 Element half width
𝐵 Bandwidth
𝛽 Steering angle
𝛽𝑚𝑎𝑥 Maximum steering angle
𝑐 Ultrasound propagation velocity
𝑑𝑖𝑟 𝛽, ϕ Element directivity function (Angular response) 𝐷𝑏 𝜃 Directivity function of an individual element
∆𝜑 Phase shift
∆𝑥 Array pitch
𝜖𝑖 Error measurement
𝑓𝑐 Center frequency
𝑓𝑐𝑢𝑡 Cut off frequency 𝑓d Doppler frequency shift
∀ For all
ϕ Diverging circular beam angular width 𝑘 Filter impulse response
𝑖 = −1 Imaginary unit
𝐼𝑄 In phase and quadrature signal components
𝑘 Wave number
𝜆 Wave length
𝑛 Sample length
𝑛N Nyquist number
𝑛PRF Number of PRFs in the multiple PRF pulsing approach, 1, 2 or 3
𝑁 Number of elements
𝑁A Number of transmissions to create one B-mode image in focused ultrasound 𝑁B Number of transmissions to create one compounded B-mode image
𝑁D Doppler ensemble length
𝑝 Acoustic field pressure
𝑝0 Original acoustic field pressure
𝑝 𝑟, 𝜃 Radiation pattern pressure 𝜓 B-mode tilting angle
𝑝𝑖
𝑞𝑖 Dual PRF ratio
𝑄 Flow rate
𝑟 Interrogated ROI depth
xi r2 Coefficient of determination
𝜌 Medium density
𝑆𝑁 𝑡 Gain compensated radiofrequency signals
𝑆 𝑡 Compressed B-mode image 𝜍2 Standard deviation
𝑡 Time required to interrogate a given depth 𝑇𝑖𝑚 𝑎𝑔𝑒 Time required to generate one B-mode image
𝑇duplex Time required to generate one duplex image
𝜏𝑛 Delay law
𝜃 Interrogated ROI angular position
Θ Angle between the Doppler and particle velocity
𝑤 Single element width
𝑣0 𝜔 Normal velocity in the frequency domain
𝑉 Blood velocity
𝑉N Nyquist velocity
𝑉D Doppler velocity
𝑉D𝑢 Unambiguous Doppler velocity
𝑉Ne Extended Nyquist velocity
𝜇 Mean
𝜔 Angular frequency
𝑊𝑛 Weighing function
𝑥𝑛 Centroid location of the nth element 𝑥(𝑛) Filter input (Unfiltered signal) 𝑥𝑛
Coordinates of every element in the phased array 𝑥0
, 𝑧 0 Spatial location of the virtual source 𝑋(𝑡) Bandpass radiofrequency signal 𝑋 (𝑡) Complex envelope
𝑋+ 𝑡 Pre-envelope or analytic signal
𝑋 (𝑡) Hilbert transform of the bandpass signal 𝑦 𝑛 Filter output (Filtered signal)
𝑍 Material acoustic impedance
Chapter 1
Introduction
Cardiovascular diseases are the main cause of mortality worldwide, resulting in around 14 million deaths every year, most of them attributed to heart disorders [1]. In this context, early diagnosis of cardiomyopathies would improve the cost-effectiveness of medical treatments and reduce the mortality rates associated with this type of health issue.
For more than 50 years, echocardiography has been used to investigate motion and hemodynamics of the heart [2, 3]; it is a radiation free, non-invasive medical imaging modality that allows real time assessment of the cardiac function. As the most widespread cardiac imaging technique, echocardiography is a valuable tool to diagnose a variety of cardiac anomalies [4], however, the quantitative information it provides is limited due to the following reasons:
Temporal resolution (frame rate): the conventional echocardiography temporal resolution is about 40 to 80 frames per second (fps). Considering that the cardiac cycle occurs in a brief period of time (0.8 second on average), higher echocardiography frame-rates would provide more detailed information on the human heart behaviour.
Conventional color Doppler unambiguous velocity range (Nyquist limit): blood velocities are unambiguously estimated by color Doppler only within the Nyquist range (velocities beyond the Nyquist limit experience aliasing). Taking into account that cardiac bloodstreams reach velocities beyond the echocardiography Nyquist range, extending the echocardiography color Doppler unambiguous range would contribute to more reliable cardiac blood flow measurements.
Solving the abovementioned issues would also allow emerging echocardiography applications to be developed, e.g. color Doppler vector flow mapping (VFM). In addition to the axial velocities estimated by color Doppler, the VFM application can provide 2D vector blood velocity maps [5]; such a technique uses axial velocities information to estimate the perpendicular transverse velocity. In echocardiography, color Doppler velocities provide the axial information needed by the VFM application; therefore, avoiding color Doppler aliasing becomes a priority. In the same way, enhancing the echocardiography frame-rate would benefit the VFM applications by providing more detailed information on the cardiac blood flow.
Keeping in mind the ideas laid out in the previous paragraphs, this document presents various methodologies that were implemented to enhance both the echocardiography temporal resolution and the unambiguous color Doppler velocity range; this document also includes the in vitro and in vivo results obtained using these approaches. The main purpose was to enhance the conventional echocardiography capabilities and improve the conditions of other emerging echocardiography applications.
2
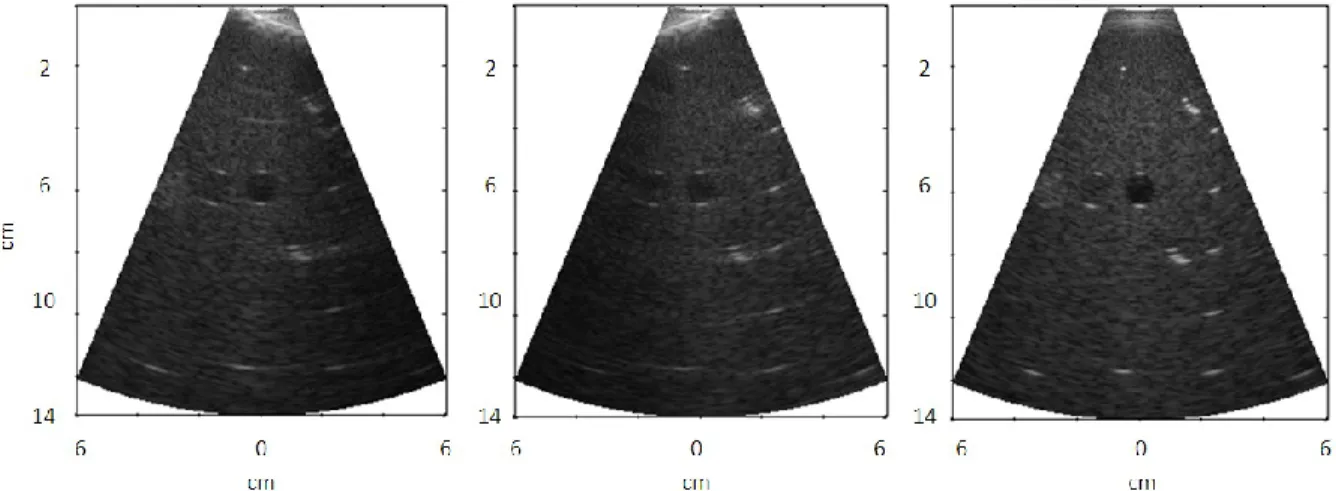
Fig. 1.1 – Conventional cardiac ultrasound vs ultrafast echocardiography. Left panel: Echocardiography parasternal
long-axis view. Center: In conventional focused echocardiography, multiple tilted beams are transmitted within the angular range – 𝛽: 𝛽 to reconstruct one greyscale image. Right panel: Diverging circular beams insonify wide regions of interest; in consequence, one complete image can be created after each diverging beam is transmitted.
1.1
Conventional ultrasound vs ultrafast ultrasound
The main objective of the research presented in this manuscript was to increase echocardiography temporal resolution without degradation of the image quality featured by the conventional focused echocardiography approach; the high frame rate provided by ultrafast ultrasound was exploited to fulfill such a goal. Ultrafast ultrasound is possible thanks to the transmission of non-converging ultrasound beams, e.g. plane waves. Montaldo et al have shown that ultrasound plane wave imaging can provide comparable image quality to that of conventional focused ultrasound while significantly increasing the temporal resolution [6]. Although the interesting performance featured by plane wave imaging, such a technique is not well suited to conduct cardiac imaging; the sectorial echocardiographic region-of-interest (ROI) (see Fig. 1.1 – left panel) cannot be insonified with a single plane wave transmission.
In order to accomplish echocardiography high frame rates, diverging circular beams (DCB) were selected to develop the ultrafast echocardiography technique [7]; DCB are intuitively well suited to insonify the wide echocardiography ROI (see Fig. 1.1 – right panel). It was assumed that one complete sectorial image could be generated after every DCB transmission. The following paragraphs give a brief explanation of the conventional and ultrafast echocardiography methods addressed throughout this manuscript.
The conventional echocardiography approach fires consecutive tilted beams that converge to a given depth (see Fig. 1.1 – center panel); the traditional focused ultrasound approach reconstructs only one echographic line after every ultrasound beam is transmitted (one A-line at a time). Given that echocardiographic images gathers about 130 A-lines, the same number of tilted beams needs to be fired before one image is completed [8].
As opposed to the conventional echocardiography approach, ultrafast echocardiography creates one complete echographic image (130 A-lines at a time) after every ultrasound beam is transmitted; the last statement entails the imaging rate provided
3
with the ultrafast approach is at least a hundred times higher compared to the conventional ultrasound method.
1.2
Research hypothesis
Increasing echocardiography (B-mode and color Doppler) temporal resolution will provide more complete hemodynamic cardiac assessments. Such a high frame rate imaging approach should exhibit similar or better image quality and blood velocity estimates compared to the conventional technique.
1.3
Aims of study
The research presented in this manuscript aimed to develop an ultrafast echocardiography imaging technique (>700 fps) with extended color Doppler unambiguous range. The specific objectives pursued along this project were:
1. Increase the echocardiography technique temporal resolution using ultrafast ultrasound while maintaining the conventional image quality standards.
2. Extend the color Doppler unambiguous range by taking advantage of the high temporal resolution provided by ultrafast ultrasound.
3. Assess the image quality and color Doppler velocity estimates provided by ultrafast echocardiography (quantitatively and qualitatively).
1.4
Project methodology
State of the art review: A thorough literature review was performed to identify former contributions aiming to increase the echocardiography temporal resolution and extend the color Doppler unambiguous range. Advantages and weaknesses of former contributions were identified in order to define the project approach. A broad amount of articles and books are cited throughout this manuscript in case the reader requires further explanation and/or illustration.
Diverging circular beams implementation using the Verasonics scanner: The DCB echocardiography imaging approach was implemented using the Verasonics system; this is an open architecture ultrasound device that allows transmitting arbitrary ultrasound beams as well as recording the reflected ultrasound echoes (for post-processing).
Conventional vs ultrafast echocardiography image quality comparison: The image quality of the ultrafast and conventional echocardiography approaches were compared to each other. Both the spatial resolution and contrast to noise ratio were quantified using the two techniques. The results allowed an assessment of the ultrafast method (see chapter 4, section 4.3).
Ultrafast color Doppler in vitro assessment: ultrafast Color Doppler imaging was performed using diverging waves and staggered pulse repetition frequencies (PRFs). In vitro experiments were conducted to verify the accuracy of this technique (see chapter 5, section 5.2.3).
4
Ultrafast echocardiography in vivo examinations: Healthy volunteers were examined using both ultrafast B-mode and ultrafast color Doppler echocardiography; the ultrafast echocardiography technique was qualitatively assessed.
1.5
Memoire outline
This manuscript is organized as explained in this paragraph: chapter two introduces the anatomy of the human heart and left ventricle (LV) hemodynamics. Chapter two also presents the echocardiography technique and the main emerging cardiac blood velocity vector (BVV) imaging approaches. Chapter three presents ultrasound imaging principles (B-mode and Doppler) and some signal processing related methods. Chapter four presents how echocardiography temporal resolution was increased using diverging beams [5, 9]. Chapter five explains how the color Doppler unambiguous range was extended using staggered PRFs. Chapter six offers a brief discussion of the work done.
1.6
Supplementary Work
The color Doppler unambiguous range extension using staggered PRFs was also implemented for vascular imaging (using plane waves). Experiments were conducted in a common carotid artery (see chapter 5, section 5.3.3).
5
1.7
List of publications and presentations
The publications and presentations listed below were respectively written and given by the author throughout the research project execution:
Papers included in this memoire
1. Daniel Posada , Arnaud Pellissier , Boris Chayer, François Tournoux, Guy Cloutier, Damien Garcia. “Staggered multiple-PRF ultrafast color Doppler” (submitted to IEEE Transactions on medical imaging).
Conference proceedings
1. Daniel Posada, Sarah Dort, Boris Chayer, Shahrokh Shahriari, Guy Cloutier, Hervé Liebgott, Damien Garcia. “Towards High Frame Rate Cardiac Ultrasonography - a Circular Wave Imaging Approach”. Proceedings of IEEE International Ultrasonics symposium (IUS), 2013, Joint UFFC, EFTF and PFM symposium, Prague, Czech Republic, july 21-25, 2013.
2. Daniel Posada, Boris Chayer, Guy Cloutier, Damien Garcia. “Nyquist velocity extension in ultrafast color Doppler”. Proceedings of IEEE International Ultrasonics symposium (IUS), 2014, Joint UFFC, EFTF and PFM symposium, Chicago, USA, september 3-6, 2014.
Presentations and posters
1. Daniel Posada . “Ultrafast cardiac ultrasound”, The Artimino Conference on Medical Ultrasound Technology, 2013.
2. Daniel Posada, François Tournoux, Guy Cloutier, Damien Garcia. “Ultrafast echocardography”. Ultrasonics symposium (IUS), 2014 IEEE International.
3. Daniel Posada, Sarah Dort, Boris Chayer, Shahrokh Shahriari, Guy Cloutier, Hervé Liebgott, Garcia D. “Towards High Frame Rate Cardiac Ultrasonography - a Circular Wave Imaging Approach”. Ultrasonics symposium (IUS), 2013 IEEE International.
4. Daniel Posada, Boris Chayer, Guy Cloutier, Damien Garcia. “Nyquist velocity extension in ultrafast color Doppler”. Ultrasonics symposium (IUS), 2014 IEEE International.
6
Bibliography
[1] W. H. Organization. The top 10 causes of death. (2014).
[2] D. H. Evans, Doppler ultrasound: Physics, instrumentation, and clinical applications: John Wiley & Sons, 1989.
[3] B.-F. Osmanski, et al., "Ultrafast Doppler Imaging of Blood Flow Dynamics in the Myocardium," Medical Imaging, IEEE Transactions on, vol. 31, pp. 1661-1668, 2012.
[4] V. Mor-Avi, et al., "Current and evolving echocardiographic techniques for the quantitative evaluation of cardiac mechanics: ASE/EAE consensus statement on methodology and indications: endorsed by the Japanese Society of Echocardiography," Journal of the American Society of Echocardiography, vol. 24, pp. 277-313, 2011.
[5] P. P. Sengupta, et al., "Emerging trends in CV flow visualization," JACC: Cardiovascular Imaging, vol. 5, pp. 305-316, 2012.
[6] G. Montaldo, et al., "Coherent plane-wave compounding for very high frame rate ultrasonography and transient elastography," Ultrasonics, Ferroelectrics and Frequency Control, IEEE Transactions on, vol. 56, pp. 489-506, 2009.
[7] H. Hasegawa and H. Kanai, "High-frame-rate echocardiography using diverging transmit beams and parallel receive beamforming," Journal of Medical Ultrasonics, vol. 38, pp. 129-140, 2011.
[8] V. Chan and A. Perlas, "Basics of ultrasound imaging," in Atlas of Ultrasound-Guided Procedures in Interventional Pain Management, ed: Springer, pp. 13-19, 2011.
[9] C. Papadacci, et al., "High-contrast ultrafast imaging of the heart," IEEE transactions on ultrasonics, ferroelectrics, and frequency control, vol. 61, pp. 288-301, 2014.
7
Chapter 2
Cardiac hemodynamics, Echocardiography and vector
blood velocity imaging
The human heart can be visualised using a variety of medical imaging tools, e.g. nuclear imaging, angiography, cardiac magnetic resonance (CMR), cardiac computed tomography and echocardiography (other might exist but these are the most widespread). Due to its low cost, simplicity and safety, echocardiography occupies a very unique position among the cardiac imaging techniques; on the other hand, echocardiography does not provide 2D blood velocities as other techniques do, e.g. CMR provides 2D and 3D time resolved blood flow maps. Emerging ultrasound based techniques such as color Doppler VFM would give echocardiography the capability to estimate 2D blood velocities; however, enhancing the conventional echocardiography temporal resolution and unambiguous color Doppler velocity range would be necessary to efficiently implement the VFM imaging application.
In this chapter, the reader can find information related to the following physiological and imaging topics: The heart anatomy and the LV hemodynamics; the conventional echocardiography technique capabilities and limitations; the most known cardiac vector blood velocity imaging techniques: CMR, echo-PIV and color Doppler VFM; and finally, the relevance to further improve the color Doppler VFM application.
2.1
Cardiac anatomy and left ventricle hemodynamics
Echocardiography allows visualisation of the blood flow through the human heart and motion of the cardiac structures. Among the four cardiac chambers, the LV outstands because of its size and the strength needed to pump blood to the whole human body; given the importance of the LV, it becomes the main target of the echocardiographic examination. All the structures attached to the LV are also of high interest during the cardiac echo examination (see Fig. 2.1):
The mitral valve (MV): The MV separates the left atrium from the LV; such a valve serves as a gate between the pulmonary circulatory system and the LV.
The papillary muscles: The papillary muscles are attached to the LV and the mitral valve leaflets. These muscles help the mitral valve open as the LV dilates and close as the LV contracts.
The aortic valve (AV): The AV works as a gate between the aorta artery and the LV. The AV allows oxygenated blood to flow towards the arterial circulatory system.
The left ventricular outflow tract (LVOT): The LVOT is a cavity that conducts the blood flow out of the LV towards the aorta artery.
8
Fig. 2.1 – Most relevant cardiac structures that interact with the LV (source: Mayo Foundation for Medical Education and
Research, http://www.mayoclinic.org).
The pericardium/myocardium/endocardium: The pericardium, myocardium and endocardium are the tissue layers that enclose the left and right ventricles.
Beyond the interest inspired by the internal structures of the heart, the LV exhibits particular hemodynamic events that can be visualised using cardiac imaging methods, e.g. color Doppler echocardiography and echo-PIV. Progressively, more and more studies aim to correlate the cardiac function to the LV hemodynamics, for instance, Mehregan et al used color Doppler echocardiography to identify abnormal vortexes in the LV; such a technique could be exploited to identify potentially diseased patients [1]. The hemodynamics events that take place in the LV during the cardiac cycle are presented in the following paragraphs. Papillary muscles Mitral valve Left Atrium Left ventricle Myocardium Aortic valve Left ventricular outflow tract Septum
9
Fig. 2.2 - Hemodynamic phases inside the cardiac chambers. In clockwise sense: Isovolumetric relaxation, ventricular
filling, atrial contraction, ventricular contraction and ventricular ejection [2].
2.1.1 Cardiac hemodynamics
The human heart has two atriums and two ventricular chambers. Despite the importance of all these chambers, the LV is the one responsible to pump oxygenated blood into the arterial circulatory system. Considering the demanding job performed by the LV, it is not a surprise this chamber exhibits the most active hemodynamics in the human body. Extensive research has made possible the identification of the hemodynamic stages that take place
10
during the cardiac cycle [3]; a thorough description of the LV hemodynamics is presented in the following paragraphs (see Fig. 2.2):
Isovolumetric relaxation: The heart muscle enters its relaxing mode with the valves closed. The ventricular pressure rapidly declines but the volume in the LV remains constant. This phase lasts until the ventricular pressure drops below the atrial pressure; at this specific moment the mitral valve opens and the ventricular filling starts.
Ventricular filling: The LV relaxes which generates a pressure gradient from the left atrium. During this phase, the mitral valve is wide open so blood can flow from the left atrium to the LV. Although pressure in the LV is lower than pressure in the ventricular outflow tract, the aortic leaflets prevent any backflow from the aorta.
Atrial contraction (systole): Both atriums contract at the same time increasing the pressure in the atriums and pumping remaining blood into the right and left ventricles. This hemodynamic phase is also known as atrial kick.
Isovolumetric contraction: The myocardial tension forces the mitral valve to close. During this phase, both the mitral and aortic valves remain closed, therefore, pressure in the LV rapidly rises under constant volume conditions.
Ventricular systole: Pressure builds up inside the LV as this one contracts; this phase is known as ventricular contraction or first phase of the ventricular systole. Subsequently, the aortic valve is naturally released, which enables blood to flow into the arterial circulatory system; this phase is known as ventricular ejection.
2.1.2 Left ventricle vortex and its use as a cardiac function marker
The human heart shares many similarities with hydraulic systems. By the same token, the blood flow depends on the boundaries imposed by cardiovascular system. Laminar and turbulent stream patterns may appear in the human body; such patterns are the result of the momentum generated by blood motion and the frictional effects caused by anatomical boundaries, e.g. the heart and vessel walls [4]. Although turbulent patterns are not usual in the circulatory system, a turbulent vortex that appears into the LV seems to have positive properties. Recent in vivo studies using echo-PIV have described the formation of such a vortex inside the LV. According to Cimino et al., the left-ventricular vortex adopts different shapes along the cardiac hemodynamic cycle [5]. Cimino et al also suggests such a vortex exhibits variations in sick patients; it is with this in mind that the characterization of such a vortex could help create alternative markers to diagnose cardiac disorders.
Non-invasive vector blood velocity imaging techniques such as color Doppler VFM would be valuable to assess the intraventricular blood flow vorticity. However, the color Doppler velocities used by the color Doppler VFM application are often incorrectly measured by the echocardiography technique (velocities display aliasing). In addition, the temporal resolution of the conventional color Doppler technique does not provide enough information per cardiac cycle to effectively implement the color Doppler VFM application. Generating more accurate color Doppler estimates at higher frame rates, would allow the color Doppler VFM application to conduct efficient and accurate cardiac hemodynamic assessments.
11
2.2
Echocardiography examination review
Among the numerous existing cardiac imaging techniques, only echocardiography has become ubiquitous [6]; this happened thanks to its low cost, use of non-ionising radiation, portability, and its ability to carry out non-invasive cardiac examinations in real time. All these features have allowed echocardiography to develop at a rapid and steady pace. The addition of new echocardiographic applications such as color Doppler, tissue Doppler, speckle tracking, just to mention a few, have led this imaging technology to occupy a pivotal position in the diagnosis and follow up of the heart function.
Echocardiography was originated in the mid 1940’s when the German physician Wolf-Dieter Keidel investigated the use of ultrasound with medical diagnosis purposes. At that time he proved that rhythmic volume variations of the heart could be measured using ultrasound. In the early 1950’s Inge Edler and Carl Hellmuth Hertz continued to develop echocardiography in Lund-Sweden; they found that ultrasound frequencies in the megahertz range were needed to emit ultrasonic energy deep into human tissues and produce useful 2D echographic images. By the mid 1950’s echocardiography was already used as a routine diagnostic tool. During the 1960’s, the clinical application of echocardiography spread over Europe and the United States, making possible many cardiac diagnostic procedures. In the 1970’s echocardiography witnessed three big revolutionary events: first, the introduction of linear arrays for real time imaging by Griffith and Henry; second, the discovery of contrast echocardiography by Gramiak; third, the beginning of spectral continuous ultrasound Doppler. The introduction of these echocardiographic tools skyrocketed the popularity of the cardiac-echo technique.
Following the echocardiography revolution in the 70’s, color Doppler came along in the 1980’s to reinforce the importance of cardiac ultrasonography. Since then, echocardiography has settled as an affordable technique thanks to its demand and big success. In the recent years, the low cost to produce ultrasound machines has increased its usability around the world; moreover, thanks to the present position occupied by echocardiography in the clinical setting, many innovating research projects strive to further improve multiple features of this imaging modality [7].
The transthoracic and transesophagial echocardiographic approaches are presented in the following paragraphs. It is also explained how structures and/or blood flow inside the cardiac chambers can be visualized using this imaging technique.
2.2.1 The transthoracic echocardiography approach (TTE)
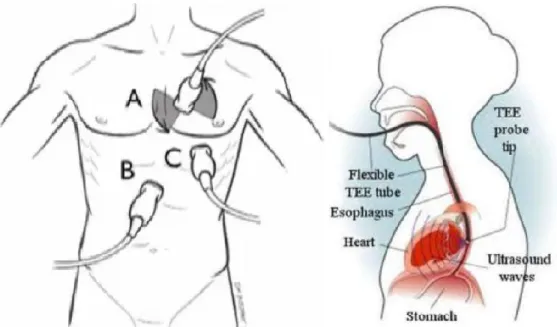
During the transthoracic echocardiography examination, the phased array transmits ultrasonic energy into the heart through the gaps existing between the ribs; the ultrasound transducer is positioned using to the distinctive landmarks exhibited by the heart, e.g. the apex and septum. Multiple transthoracic views can be obtained depending on the transducer position over the thoracic cage: (A) parasternal/suprasternal, (B) subcostal or (C) apical (see Fig. 2.3 - left-panel). The echocardiographic views are classified in terms of the transducer approach, but also in function of the long and short axis concept. The long axis is the line crossing the heart from the apex to the left ventricular outflow tract; the short axis is located in the plane perpendicular to the long axis (see Fig 2.4 – upper-right panel).
12
Fig. 2.3 - Transthoracic and trasesophageal echocardiography approaches. Left panel: Transthoracic echocardiography
approaches. (A) Parasternal and suprasternal approach, (B) Subcostal approach and (C) Apical approach. Right panel: Trasesophageal echocardiography approach [8].
The ultrasound transducer position establishes whether the view of the heart is acquired along the short or long axis, e.g. apical views can only be longitudinal. In some cases, the same approach can provide both short and long-axis views, e.g. the parasternal approach can provide both short-axis and longitudinal views. The most common transthoracic echocardiography views are presented in the following paragraphs [9]:
The parasternal long-axis (PLAX) view (see Fig. 2.4 - left-upper-panel): as stated by its name, this view is conducted from a parasternal transthoracic approach, the left and right ventricles, as well and the left ventricular outflow tract and the left atrium can be displayed. The parasternal short-axis (PSAX) view (see Fig. 2.4 - right-upper-panel): The parasternal short axis view can be performed at different heights along the LV; from the apex through the aortic valve level. This view displays how the LV contracts and relaxes in the radial direction.
The apical four-chamber (A4C) view (see Fig. 2.4 - left-lower-panel): The transducer is placed in the 5th intercostal space. The left and right ventricles as well as the right and left atriums can be visualised in the echocardiographic image.
The apical two-chamber (A2C) view (see Fig. 2.4 - right-lower-panel): This view is performed from an apical approach; the LV and the left atrium are captured in this view.
In addition to the four echocardiographic views described before, the apical long axis (also called apical three-chamber view) is a less frequently used echocardiographic view of the heart (see Fig. 2.5). The left ventricular outflow tract, the mitral valve and the aortic valve are completely included in this view.
13
Fig. 2.4 - Right-upper panel: Parasternal long-axis view. Right-upper panel: Parasternal short- axis view. Left-lower
panel: Apical four-chamber view. Right-lower panel: Apical two-chamber view [10].
The three-chamber view is especially convenient to perform either continuous or color Doppler examinations; stenosis and regurgitation on the aortic and mitral valves can be determined using this type of view. Also, in the apical three-chamber view, the left ventricular outflow tract and the ultrasound beam are aligned which helps measuring the maximal blood velocities (jet-velocity) during the ventricular diastole by using Doppler ultrasound (see section 2.1.1 for more details on cardiac phases). Moreover, thanks to the particular position of the LV and the aortic out-flow-tract in this view, color Doppler is used as gold standard to detect aortic insufficiency [11].
A particular property of the apical three-chamber view is its capacity to image the plane in which the intracavitary blood flow can be simplified to a 2D scenario. Although the intracardiac blood flow is known to have a the three-dimensional nature, recent studies have revealed that essential flow dynamics parameters of the heart can be accurately approximated using this 2D view [1, 12, 13].
14
Fig. – 2.5 Apical long axis or Apical 3-chamber view: The LV, the left ventricular outflow tract (LVOT), the mitral valve
(MV) and the aortic valve (AV) are displayed during systole [14].
2.2.2 The transesophageal echocardiography approach (TEE)
The transesophageal echocardiography examination is conducted through the esophagus (see Fig. 2.3 - right-panel). A slim and flexible tube carrying a transducer at the tip is introduced through the throat and then into the esophagus. This technique might be capable of providing higher quality images than those obtained with the transthoracic approach; the main reasons are the transducer being closer to the heart and the higher central frequency of the ultrasound transducer (typically 5 MHz). However, as all endoscopic procedures, transesophageal echocardiography entails a moderate probability of complications [6, 15], as opposed to the very low risk related to the TTE imaging approach. The TEE technique is indicated when transthoracic echocardiography is not feasible or does not provide sufficient information of the cardiac function. Also, it is suitable to detect cardiac sources of embolization and when conducting catheterisation procedures. Since the motivation of this memoire has been the transthoracic echocardiography approach, only a general explanation of the TEE method is available here; nonetheless, more complete information concerning this approach can be found in the book “A practical approach to transesophageal echocardiography” [16].
2.2.3 Conventional echocardiography capabilities
When echocardiography was introduced in the 1950’s, it was only capable of generating single echographic lines of the heart. As time went by, multiple features were developed and added to this clinical tool. Nowadays, the capabilities integrated into echocardiography allow not only seeing the structures of heart, but also measuring the tissue motion
15
(myocardium) and quantifying the blood flowing in and out of the LV. In order to outline the current capabilities exhibited by echocardiography, the most frequently used echocardiographic applications are presented in the following paragraphs [17]:
M-mode: The M-mode imaging application provides a 1D view of the heart. A single echographic line is acquired by insonifying the heart always in the same region; subsequently, these lines are displayed one after the other as a function of time. The temporal resolution of the M-mode application is relatively higher in comparison to the other echocardiographic tools; this is because the target of the ultrasound beam is always located at the same spot.
B-mode (2D-imaging): The B-mode imaging application provides two-dimensional images of the heart. It is considered the backbone of echocardiography, making it possible to visualize moving structures in real time. The B-mode echocardiographic images display cross-sectional views of the heart; these images can be used to determine the presence of abnormal anatomy or non-conventional movements of the cardiac structures.
Continuous-wave (CW) Doppler: This technique uses the Doppler principle to measure the frequency shift encountered between the transmitted ultrasound waves and reflected echoes. The spectral representation of ultrasound echoes enable identifying velocity fluctuations on the blood stream; on the other hand, the continuous-wave Doppler approach is limited to measuring mean velocities through the ultrasound beam (no spatial resolution can be attained with this technique).
Pulsed-wave (PW) Doppler: It was developed to solve the boundaries featured by the continuous Doppler approach. This technique uses ultrasound pulses instead of continuous ultrasound beams. This method can estimate the blood-flow velocity at a specific depth, providing hemodynamic information through specific anatomical structures. Among other applications, PW Doppler can be used to establish ventricular in-flow patterns and intracardiac shunts.
Color Doppler (Color-flow mapping): The color Doppler imaging tool goes a step further than the pulsed-wave Doppler technique by providing colourful images of the intraventricular blood flow. Red and blue scale colors are displayed when blood flows towards or away the ultrasound transducer respectively. Color Doppler provides valuable information when specific anomalies such as regurgitations, valves sclerosis or cardiac shunt are present.
Color M-mode: This technique combines the working principle of the color Doppler technique with the display scheme of the M-mode approach. Color Doppler lines are displayed one after the other vs. the examination elapsed time. As for the M-mode technique, color M-mode exhibit a high temporal resolution because of the static focusing transmission strategy but as the brightness M-mode approach its applications are limited. The propagation velocity and the pressure gradient are the main two examinations that exploit color M-mode.
Contrast echocardiography: This technique uses contrast agents such as agitated saline or synthetic micro-bubbles to enhance the reflectivity of the blood-flow inside the cardiac chambers. The contrast agents utilised during this examination are injected intravenously.
16
Tissue Doppler (TDI) and strain imaging: These two modalities facilitate keeping track of the myocardium strains and velocities. The tissue Doppler imaging technique utilises the same principles exploited by the pulsed-wave color Doppler method, but significant adjustments are necessary to estimate slowly tissue motion in real time [18]. Cardiac strain imaging uses block matching algorithms to calculate myocardial velocities and deformations; currently, this procedure can be only executed offline [19].
2.2.4 Conventional echocardiography limitations and improvement opportunities
The numerous functions featured by Echocardiography justify its popularity in the cardiac imaging field [20]. However, conventional echocardiography only detects cardiac dysfunction when patients start deteriorating. Considering that half of the population affected by heart diseases exhibit a normal systolic function, researchers are interested in finding a way to early diagnose cardiac pathologies. Recent studies have demonstrated that abnormal diastolic features can be detected using vector blood velocity (VBV) imaging techniques. The advantage of the VBV imaging method over color Doppler is its ability to estimate not only the axial but also the transverse blood velocities (two different velocity components). Multiple VBV imaging approaches have been recently used to describe the human cardiac hemodynamics [4]. Imaging techniques such as Echo-PIV, phase-contrast CMR, and color Doppler VFM, have made it possible to obtain the first vector blood velocity charts from within the LV; these preliminary results along with the advantages featured by ultrasound imaging have motivated interest to develop ultrasound based tools to characterize the cardiac blood-flow.
Being capable of characterizing the blood dynamics of the heart could empower cardiologist to better and earlier diagnose patients suffering from cardiac disorders. Furthermore, therapies available to treat heart disorders could dramatically increase their effectiveness if addressed during early symptomatic stages. It is also worth noting that two of the imaging modalities used so far to characterize the cardiac blood-flow utilize B-mode and color Doppler echocardiography. The previous fact is the drive for the future echocardiography challenges, among them the two improvements that are subject of this research: a higher temporal resolution and a broader unambiguous Doppler velocity range. Boosting these echocardiography features would positively impact techniques such as echo-PIV and color Doppler VFM, which would result in earlier and more accurate diagnosis.
2.3
Vector blood velocity imaging techniques
Cardiac vector blood velocity imaging techniques allow visualizing blood flow maps inside the cardiac chambers. So far, the three main cardiac vector blood velocity imaging schemes are: CMR, already used in the clinical setting and it is considered the gold standard to carry out quantitative examinations of the cardiac blood flow [3]; Echo-PIV, it has been used in research studies to quantify and characterize the normal vortex in the cardiac LV [21]. Color Doppler VFM, it is completely non-invasive since only B-mode and color Doppler echocardiographic images are used to estimate two-dimensional velocity maps. Color Doppler CFM has been used to carry out measurements of the vortex in the cardiac blood flow [13]. The existing vector blood velocity techniques are described in the following paragraphs.
17
Fig. 2.6 - Cardiac magnetic resonance path lines: Color flow stream represent blood particles velocities in different
phases of the cardiac cycle [4].
2.3.1 Cardiac magnetic resonance (CMR)
The CMR imaging technique can resolve blood flow velocities in any direction in the Cartesian coordinate system. This means the three velocity components of a particle can be estimated [4]. This technique does not use contrast agents, therefore it is considered completely non-invasive. The principle utilized to resolve the velocity maps relies in the measurement of bipolar gradients, the phase of the recorded signals changes as a function of blood velocity; such an association can be exploited to estimate the blood velocity. Although 3D blood velocities can be measured by means of CMR, several heart beats are usually combined to draw better quality data. ECG is then required to match all sets of data used to obtain one velocity estimate; also, respiratory gating is used to synchronize the acquired data.
The CMR imaging technique is popularly known as 4D–CMR; this is because it resolves the three velocity components throughout a time line [3]. Currently CMR offers a spatial resolution of 3 mm3 and a temporal resolution of 20 fps. In average a procedure can be performed in about 20 minutes. The 2D or 3D velocity fields are usually represented by streamlines and path lines because of the intuitively delivered interpretation (see Fig. 2.6). Quantitative measurements are commonly applied on 2D views extracted from the 3D data. Parameters such as relative pressure field and turbulent kinetic energy are calculated using these velocity fields.
18
Fig. 2.7 - Cardiac blood flow stream lines obtained using echo-PIV [4].
The 4-D CMR velocity acquisition technique is capable of displaying the multidirectional blood flow that is supposed to be consistent from heart-beat to the next one. An important inconvenience of the CMR technique is the high cost of the MRI equipment, which ranges in the millions of dollars per device; additionally, CMR entails a complex instrumentation, one single examination can take about 25 min. Reconstructed movies are not delivered in real time, but rather obtained off-line by averaging hundreds of heart cycles, and therefore not small beat to beat variations can be determined.
2.3.2 Echocardiography particle image velocimetry (Echo–PIV)
Echo PIV is based on the particle image velocimetry (PIV) approach, which is a common and well known technique to estimate flow fields. PIV uses speckle tracking algorithms to estimate particle displacements from one frame to another in an image sequence [4]. This is accomplished by illuminating with a laser a flow seeded with particles, while the event is recorded by one or several cameras. Recorded images are post processed to track particles displacement frame to frame. Actually the PIV technique does not track particles displacement, but rather displacement patterns generated by a group of particles. In echo-PIV, B-mode echocardiography images are used to identify the blood flow streamlines by following the contrast agent displacement. The clinical implementation of the echo-PIV technique requires micro-bubbles to be injected in the bloodstream. Echo-PIV has been successfully employed in experimental and clinical studies. Cardiac blood flow streamlines obtained using echo-PIV are illustrated in Fig 2.7.
Even though echo-PIV seems very attractive because it utilizes B-mode echocardiographic images, it is also the cause for the main drawback related to this vector flow imaging scheme; since PIV uses sets of images to estimate the displacements, a high temporal resolution is most desirable to obtain accurate results. Current frame rates in echocardiography machines range from 50 to 100 frames per second. Such a temporal
19
resolution might not always be high enough to provide a proper input to the echo-PIV technique.
Another impairment featured by the echo-PIV technique is the use of contrast agents, e.g. micro-bubbles contrast agent side effects are not fully known yet. The last statement implies that echo-PIV should not be used in healthy patients, since any change on their condition could be attributed to its employment
2.3.3 Doppler ultrasound vector flow mapping (VFM)
Developed in the 80’s, color Doppler ultrasound is an inexpensive and easily performed blood flow imaging technique. Although its accessibility and versatility, color Doppler only estimates axial velocities (lateral or angular velocities component are not estimated). Regardless this limitation, color Doppler has thrived as a diagnostic tool to detect abnormal cardiac blood flow behaviours.
Color Doppler VFM has been introduced as an alternative to estimate 2D blood velocities. VFM should be performed in a three chamber view to optimize its results; in the three chamber view the out of plane blood velocity are comparatively small all along the cardiac cycle, therefore the blood flow can be thought as two-dimensional. The VFM technique obtains the radial velocity component in the 2D cross sectional view, which combined with the color Doppler axial velocity, deliver the true 2D velocities at every range cell. The following techniques can achieve this same goal using different principles:
1. The color Doppler VFM approach introduced by Garcia et al [13] uses the color Doppler axial velocities and the boundary conditions imposed by the myocardial wall to find the angular velocity component using the mass conservation principle. The results obtained combining the mass conservation assumption and the boundary conditions obtained from speckle tracking enhance the accuracy of this technique. 2. The other color Doppler VFM approach has been introduced by Ohtsuki et al [22].
This approach assumes the flow along a radial line can be decomposed into a laminar motion and a vertical component with zero mean; the radial velocity component is estimated assuming that the vertical component satisfies the mass conservation equation along each radius.
2.3.4 Velocity vector flow imaging techniques remarks
The recently introduced cardiac blood flow imaging techniques allow for the visualization and analysis of multidirectional blood flow inside the heart. The importance of these techniques resides on their ability to provide further insights to a range of heart diseases by characterizing, verifying and interpreting the normal/abnormal cardiac blood flows. Three different approaches are available to perform cardiac blood flow - velocity vector imaging at this time; two of these techniques are ultrasound based while the other one uses MRI imaging. Table 2.1 presents a comparative summary of these three imaging techniques.
20
Table 2.1 : Comparison among cardiac blood flow visualization technologies
Cardiac blood flow
visualization techniques Phase Encoded CMR
Echocardiography
Echo-PIV Color Doppler - VFM Resolution and coverage
relative to all 3D of space
Good spatial resolution in all 3D or in 2D in shorter acquisition times; unrestricted access
Good spatial resolution in 2D planes, and in multiple planes if required
High spatial resolution in 2D;good resolution in 3D
Coverage relative to all 3-directional components of velocity
All 3 can be acquired, or 2, or 1, through a plane placed in any orientation
Both in-plane components represented but not the throughplane
Only the 1 component directed to or from the transducer is currently measurable clinically
Temporal resolution
Typically 20–50 ms, each phase is calculated from acquisition from many heart cycles
High temporal resolution (4– 20 ms), allows assessment of velocity fields even during brief isovolumetric contraction and relaxation phases over few heartbeats
Good temporal resolution in 2D (4–20 ms), relatively low in 3D
Scan time Long (5–20 min) for a dataset covering all 3D and all 3-directional components but seldom real-time
Both scan time and offline analysis can be done over few heartbeats in minutes
Rapid scan times, real-time visualization
Breath-Holding
Breath-hold used for short, unidirectional velocity acquisitions, or diaphragm
navigation for long acquisitions during free breathing
Imaging relatively easier during breath-hold but also possible during respiration
Not required
Low-velocity accuracy
Low velocities are measurable but less accurate if high velocities also have to be measured
Well-visualized May be underestimated or affected by noise
High-velocity accuracy
Measurable up to the chosen VENC limit, but only where a stream or jet core is wide enough to include whole voxels
May be underestimated Well-resolved within aliasing limit
Application
Flow visualization and measurement of volume flow through all cardiac chambers and large vessels
Flow visualization through all cardiac chambers, aortic flow evaluation may require use of transesophageal
echocardiography
Implanted devices Metal stents or valve rings cause local artifacts; most pacemakers rule out MRI
Flow can be visualized through implanted cardiac devices, and in the presence of pacemakers and defibrillators
Echo-PIV = echocardiography particle imaging velocimetry; CMR = cardiac magnetic resonance imaging; VENC = velocity encoding.
2.4
Color Doppler VFM - limitations and motivation
Color Doppler VFM assumes the cardiac blood flow is two-dimensional; such a supposition induces an error of about 15% on the velocity estimates in comparison to CMR. Given that cardiac blood velocities can only be approximated to be two-dimensional in the three chamber view, accuracy of the color Doppler VFM technique strongly depends on the echocardiography operator. The accuracy of color Doppler VFM is also depends on the quality of the color Doppler velocity information used as an input. The low temporal resolution and potential aliasing displayed by color Doppler represent an important drawback to the color Doppler VFM approach.
21
Although the young state of the color Doppler VFM technique, such an approach remains an interesting option to map the intraventricular hemodynamics. The current momentum reached by ultrafast ultrasound should help solving flaws as the low frame rates obtained with color Doppler echocardiography.
The motivation of the research project summarized in this report was to assess an ultrafast echocardiography approach and extend the Nyquist velocity range. We hope that enhancing these two echocardiography features will have a positive impact on the color Doppler VFM technique.
In this chapter, the anatomy and hemodynamics of the heart have been portrayed. Also, the echocardiography and other cardiac imaging techniques have been introduced, among these the echo PIV and color Doppler VFM, which are two vector flow imaging techniques that could benefit from higher echocardiography frame rates; particularly, the color Doppler VFM technique could benefit from an extended color Doppler velocity range, and at the same time could complement the lack a vector flow imaging application in echocardiography.
The next chapter introduces ultrasound imaging and its functioning principles. Notions such as, piezoelectricity, beamforming, radiofrequency signal demodulation, Doppler velocity estimation and other ultrasound related topics might be useful for readers that are not familiar with ultrasound imaging. The technical background presented in the following chapter occasionally addresses specifically the cardiac echo approach; this is the case for the section that introduces phased array transducers, which are solely used in echocardiography. All the other concepts presented in chapter 3 are generally extensible to any ultrasound imaging application.
22
Bibliography
[1] F. Mehregan, et al., "Doppler vortography: A color Doppler approach to quantification of intraventricular blood flow vortices," Ultrasound in medicine & biology, vol. 40, pp. 210-221, 2014.
[2] O. College. Available: http://www.quickiwiki.com/en/Heart
[3] M. Markl, et al., "Comprehensive 4D velocity mapping of the heart and great vessels by cardiovascular magnetic resonance," Journal of Cardiovascular Magnetic Resonance, vol. 13, pp. 1-22, 2011.
[4] P. P. Sengupta, et al., "Emerging trends in CV flow visualization," JACC: Cardiovascular Imaging, vol. 5, pp. 305-316, 2012.
[5] S. Cimino, et al., "In vivo analysis of intraventricular fluid dynamics in healthy hearts," European Journal of Mechanics-B/Fluids, vol. 35, pp. 40-46, 2012.
[6] S. D. Solomon, Essential Echocardiography: A Practical Guide With DVD: Springer Science & Business Media, 2007.
[7] I. Edler and K. Lindström, "The history of echocardiography," Ultrasound in medicine & biology, vol. 30, pp. 1565-1644, 2004.
[8] S. White. (16/02/2015). Transesophageal Echocardiography (03/09/2004 ed.). Available:
http://www.sw.org/HealthLibrary?page=Transesophageal%20Echocardiography [9] W. L. Henry, et al., "Report of the American Society of Echocardiography
Committee on nomenclature and standards in two-dimensional echocardiography," Circulation, vol. 62, pp. 212-217, 1980.
[10] Atlas of Echocardiography. Available: http://www.yale.edu/imaging/echo_atlas/ views/apical_2c.html
[11] C. M. Otto and A. S. Pearlman, "Textbook of clinical echocardiography," 2004. [12] R. B. Thompson and E. R. McVeigh, "Fast measurement of intracardiac pressure
differences with 2D breath‐hold phase‐contrast MRI," Magnetic resonance in medicine, vol. 49, pp. 1056-1066, 2003.
[13] D. Garcia, et al., "Two-dimensional intraventricular flow mapping by digital processing conventional color-Doppler echocardiography images," Medical Imaging, IEEE Transactions on, vol. 29, pp. 1701-1713, 2010.
23
[15] M. Lewandowski, et al., "Research & Medical Doppler platform," Acoustics 2012 Nantes, 2012.
[16] A. C. Perrino and S. T. Reeves, A practical approach to transesophageal echocardiography: Lippincott Williams & Wilkins, 2008.
[17] N. J. Ashley EA. (2004). Cardiology Explained. Available: http://www.ncbi.nlm.
nih.gov/books/NBK2215/
[18] H. Hasegawa and H. Kanai, "High-frame-rate echocardiography using diverging transmit beams and parallel receive beamforming," Journal of Medical Ultrasonics, vol. 38, pp. 129-140, 2011.
[19] H. Blessberger and T. Binder, "Two dimensional speckle tracking echocardiography: basic principles," Heart, vol. 96, pp. 716-722, 2010.
[20] C.-m. Tam, "Application of Echocardiography in Clinic Practice," Medical Bulletin, vol. 12, 2007.
[21] G.-R. Hong, et al., "Characterization and quantification of vortex flow in the human left ventricle by contrast echocardiography using vector particle image velocimetry," JACC: Cardiovascular Imaging, vol. 1, pp. 705-717, 2008.
[22] S. Ohtsuki and M. Tanaka, "The flow velocity distribution from the Doppler information on a plane in three-dimensional flow," Journal of visualization, vol. 9, pp. 69-82, 2006.
24
Chapter 3
Ultrasound imaging background
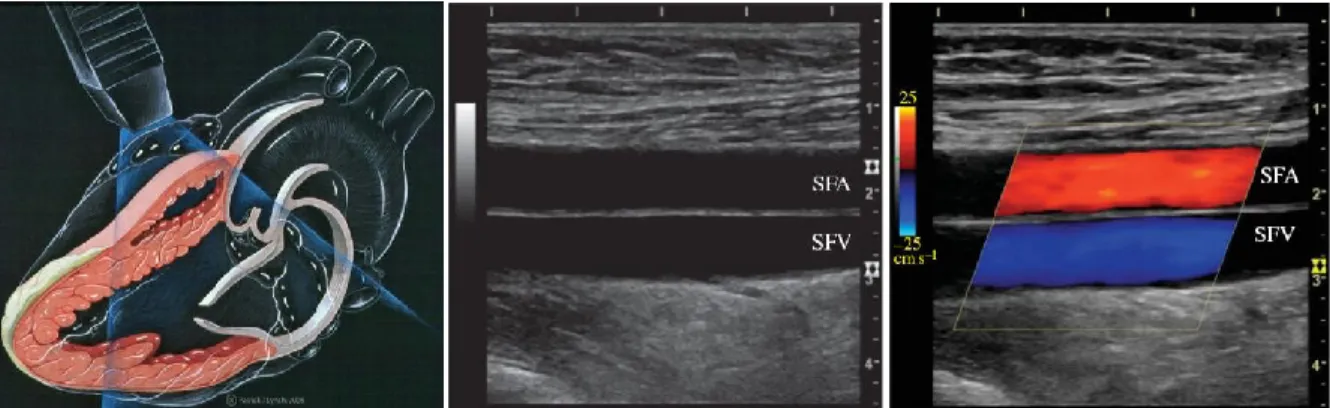
Fig. 3.1 – Left panel: Ultrasound echocardiography examination. Center Panel: B-mode image of the superficial femoral
artery and superficial femoral vein. Right panel: Doppler ultrasound image of the femoral artery and vein.
Ultrasound imaging has been used for over half a century. The Austrian neurologist Dr. Karl Theo Dussik was the first to apply ultrasound as a medical diagnostic tool; back in the 1940s, Dr. Dussik used ultrasound to image the human brain, nowadays, ultrasound is the most widely used medical imaging technology. Ultrasound is completely portable and reasonably inexpensive when compared to other imaging modalities, e.g. MRI or CT scan. Additionally, ultrasound uses non-ionizing radiation and it can perform a wide variety of real time dynamic imaging examinations, from obstetrics to cardiovascular assessments [1, 2]. The working principle of ultrasound imaging allows carrying out examinations such as echocardiography (see Fig. 3.1 – left panel), B-mode vascular imaging (see fig. 3.1 – center panel) and color Doppler imaging (see fig. 3.1 - right panel). When conducting color Doppler imaging, B-mode images are combined with red and blue images to represent the dynamic transit of blood. Most ultrasound systems can currently perform both B-mode and color Doppler imaging in real time [3].
This chapter introduces the technical aspects of ultrasound imaging. The piezoelectric principle is introduced in the first section. Afterwards, the properties of echocardiography phased array transducers are presented. In the next section, a basic explanation of the interaction between ultrasound and soft tissues is given. Following, the conventional ultrasound image formation method and some ultrasound signal processing tactics are described. Ultrasound imaging quality quantification is explained in the next section. Finally, the various Doppler ultrasound imaging methods are addressed, e.g. continuous wave Doppler, pulsed Doppler and color Doppler imaging.