GEOPHYSICAL RESEARCH LETTERS, VOL. 13, NO. 8, PAGES ?65-768, AUGUST 1986
SPECTROSCOPIC DETECTION OF CH3CL IN THE UPPER TROPOSPHERE AND LOWER STRATOSPHERE
J. H. Park 1
, R Zander
ß2, C B. Farmer
ß3, C P. Rinsland
ß1 J. M. Russell III 1
•R. H. Norton
3, and O. F. Raper
•
1Atmospheric
Sciences
Division, NASA
Langley
Research
Center, Hampton,
VA
2Institute of Astrophysics, University of Liege, Belgium
Jet Propulsion Laboratory, Pasadena, California
Abstractß Absorptions due to the v 1 band of CHIC1 have been identified for the first time in infrared solar absorption spectra of the upper troposphere and lower stratosphere. The spectral
data were obtained with the ATMOS Fourier trans-
form spectrometer onboard Spacelab 3 in May 1985 during four solar occultation events near
latitudes of 30øN, 26øN, 25•N, and 49•S. Volume mixing ratio profiles of CHIC1 retrieved for the
Since, however, theoretical predictions rely on measured values in the troposphere for lower boundary conditions, model results become uncertain owing to the large scatter of results among in situ techniques. Independent methods of measurements of CH3C1 (as well as other
halocarbons) may provide not only the clues as to whether the reported variations of CHIC1 are real,
but also confidence in the theoretical assessment
altitude range 12 to 23 km at these four latitudes of odd-chlorine production processes in the do not show appreciable differences. Vertical
mixing
ratio distributions vary from 6 x 10
-10 at
12 km to 3 x 10 -10 at 23 km with an average uncertainty of about 25%. The retrieved mixing ratio does not decrease with altitude as rapidly as the data obtained by in situ techniques.Introduction
stratosphereß
Recently, Kendall and Buijs (1983) attempted spectroscopic measurement of CHIC1 in the strato- sphere using solar absorption spectra recorded
with a balloon-borne Michelson interferometer
(unapodized
resolution 0.02 cm-1). They could not
detect absorption due to Q-branch manifolds of the
v
1 band
of CH•CI,o•d
they
estimated
an
upper
limit of 1.25 x 1 for the volume mixing ratio
The sources of odd chlorine which catalytically
at the bottom of the stratosphere; this value is
destroy ozone in the stratosphere are known to bephotochemical decompositions of both the man-made halocarbons such as CF2C12, CFCI•, CC14, and CH3CCi• (Molina and Rowland, 1974a, 1974b; Crutzen, 1974; Cicerone et al., 1974; Wofsy et al., 1975; and Crutzen et al., 1978) and the naturally produced halocarbons such as methyl chloride (CHIC1) (Lovelock, 1975; and Cicerone et al., 1975).
Tropospheric detections of CHIC1 were first reported by Lovelock (1975) using gas chroma- tography analysis and, independently, by Grimsrud and Rasmussen (1975) using mass spectrometer
analysis. It was proposed by these authors that
approximately twice the average value determined
by in situ methods.
In the spring of 1985, the ATMOS (Atmospheric Trace Molecule Spectroscopy) experiment (Farmer and Raper, 1986) was carried out onboard the Shuttle-borne Spacelab 3. The ATMOS instrument, a high resolution Michelson interferometer, provided
high quality solar •bsorption spectra (unapodized
resolution 0.01 cm -•) in the spectral region from
600 to 4700 cm
-1 using six spectral isolating
filters. Three sunset occultations around 30•N and one sunrise occultation near 49•S covered the
region
from 1580
to 3400
cm-1;
from these spectra,
absorptions due to Q-branch manifolds of the v 1
CHIC1
is most likely produced
by natural
band of CH3C1
have been clearly identified for the
processes. Subsequent
measurements
of CHIC1
by in
first time, and vertical distributions have been
situ cryogenic sampling and laboratory analysis
determined for the altitude range 12 to 23 km.
using gas chromatograph/mass spectrometer tech- niques have provided further distributions of CHIC1 in the troposphere and lower stratosphere (Cronn et al., 1977; Robinson et al., 1977; Penkett et al., 1980; Schmidt et al., 1980; Fabian et al., 1981; and Leifer et al., 1981). Profiles measured by these methods, however, differ from each other by as much as a factor of 2 in the altitude range 10 to 25 km.
In parallel with these in situ measurements of CHIC1 (see also WMO/NASA 1982), photochemical modeling activities were initiated to study the degree of stratospheric ozone destruction due to odd chlorine liberated by photolysis and chemical reactions (see e.g. Logan et al., 1981; Cicerone et al., 1983; Gidel et al., 1983; Cariolle, 1983; Ko et al., 1984; and Solomon and Garcia, 1984). Copyright by the American Geophysical Union. Paper number 6L6173.
0094-8276/86/006L-6173503. O0
Analysis Method and Input Data
The analysis method that we have used is based on the nonlinear least-squares fit technique (see Chang and Shaw, 1977; and Park, 1984). Indepen- dent parameters in the analysis of a spectrum are gas mixing ratio, instrument line shape, back- ground level, and frequency calibration. The instrument line shape is simulated using an effec- tive apodization function and a simple phase error formula (see Park et al., 1984).
The instrument measured two-sided
interferograms of solar radiation with a scan velocity of 50 cm/sec and with its field of view (1 mrad) tracking a point near the center of the solar disk during sunset and sunrise; the zero- path difference (ZPD) point was common to both interferograms. These phenomena created an interferogram smearing effect for the two-sided interferogram. As shown by Park (1982), when the
?66 Park et al.: Spectroscopic Detection of CHsC1 lo0 27.0 KM 2S .0 20.0 •8.0 O. 7 o•-.,,. CH:BCI ,,,-- Q3 SS06 I • 2966.55 2967.55 NFIVENUMBER
Fig. 1 Absorption spectra for the sunset SS06
obtained by the ATbIOS instrument. Each spectrum
A series of absorption spectra obtained during the sunset SS06 occultation are shown in Figure 1
for the spectral interval between
2966.55
to
2967.55 cm . Each spectrum is the average of two spectra, each from one side of the two-sided
interferogram. The resulting average spectrum is
then divided by an exoatmospheric spectrum to eliminate features due to absorptions by residual
gases in and around the instrument (e.g., H20 and
C02) , effects due to the interference
filter,
and
absorptions by solar lines. The spectra have been
apodized by the "strong" apodization function of Norton and Beer (1976). The spectra in this figure have not been calibrated in frequency to correct for Doppler shift due to relative motion between the spacecraft and the atmosphere.
Approximate locations of CHsC1 absorption features are indicated in the figure. These absorptions are due to 0•- and Q4-branch manifolds of the v 1 band of CHsC1 (see Margolis and Toth, 1977;
is shifted in the vertical.
These spectra are not
Dang-Nhu et al.,
1981; and Elkins et al.,
1984).
calibrated in frequency. Other Q-branch manifolds are strongly interferredinterferogram smearing phenomenon occurs during a solar occultation, the ray path corresponding to the time the ZPD of the interferogram is recorded defines the effective ray path for the spectrum,
and the other components define the instrument
line shape of the Fourier transformed spectrum.
by CH•, H20 , and OS, and they are not used for
analysis.
The spectroscopic line parameters used in the analysis are adopted from the latest version of the Air Force Geophysical Laboratory (AFGL) line compilation (Rothman, private communication, 1984; see also Rothman et al., 1983a, 1983b) for H20 , OS, CH•, and CHsC1. The temperature correction
Each two-sided interferogram measured
by the A•IOS
for the line intensity including the vibrational
instrument, therefore, provided two spectra which
would be the same in total absorption, but
different in line shape; the retrieved gas mixing ratios from the two spectra, therefore, should be the same for the tangent layer. These phenomena have been verified by computing areas of CO 2 absorption lines in the ATMOS data and also by analyzing the spectrum with the spectral fitting
partition term has been applied. Absorption
coefficients have been computed using a Voigt profile.
The atmospheric pressure and temperature profiles adopted for the four events are from the National Meteorological Center (NMC) global satellite and radiosonde measurements (Nagatani, private communication, 1985) given at approxi-
technique. Consequently, the gas mixing ratio can
mately 2-km intervals from the ground to about
be retrieved uniquely only at a vertical spacing
corresponding to the time required to collect a two-sided interferogram; i.e., a 2.2-sec period that corresponds to a vertical height interval of approximately 4 km. Below about 25 km, this vertical height interval becomes less than 4 km due to atmospheric refraction.
The solar absorption spectra analyzed for the retrieval of CHsC1 have been obtained, as
mentioned earlier, with the ATP•OS Fourier
spectrometer by using a broadband filter that -1 covered a spectral range of 1580 to 3400 cm during three sunset events, SS06, SS09, and SS13, and one sunrise event, SR02. The SS06 event occured at lat. •0øN and long. 70øW, the SS09 at lat. 26•N and long. 14•E, the SS13 at lat. 25•N and long. 78•W, and the SR02 at lat. 49øS and long. 66•W. An average set of spectra, SSAV, has
been obtained from the three sunset data sets
(when their scan altitudes are within 1 km from each other) to increase signal-to-noise ratios and accuracy in the retrieval. The effective tangent heights for SSAV data are assumed to be the average heights of the sunset data.
Because of uncertainties in the spacecraft ephemeris, instrument pointing knowledge, and adopted pressure profile, the tangent heights were
calculated
by fitting absorption
f?atures
of C•
and N
2 in the region from 1950 cm- to 2600 cm
including atmospheric refraction effects.Uncertainties in the determinations of tangent
heights from this procedure are estimated to be
less than 0.5 km.
50 km for the times and locations close to those of each event. Uncertainties in the data are
about 8% for pressure and 5 K for temperature. The NMC profiles have been selected because the ATMOS pressure and temperature profiles determined from analyses of CO 2 absorptions only cover the altitude range down to 20 km. The •C values are different from the ATMOS values by not more than
SIMULATED ( Z= 15,0 KM ) H20
>- 1 .0
os
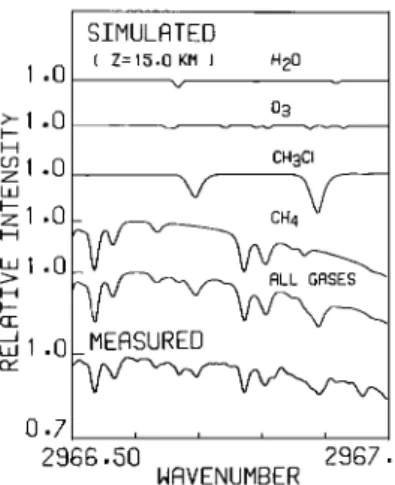
cø1 0 CHsO z ø z 1 .O CH4 L•I .0 H uJ 1 o0- HEF•SUREB 0.7 2966.50 2967 50 NFtVENUHBERFig. 2 Simulated absorption spectra (from top) due to E20, O s, CE scl, CE•, and all gases,
respectively, for tangent height 15.0 km, compared with a measured spectrum from sunset SS06
(bottom). The measured spectrum is calibrated in
Park et al.: Spectroscopic
Detection
of CH3C1
?6?
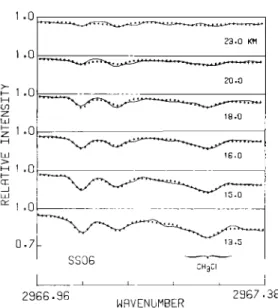
1.0 1.0 0.7 2•.D KH 20.0 18.0 1G.0 _q.-;806
CH:•CI
2966 ø96 2967 NRVENUMBERFig. 3 Comparison of the simulated spectra for retrieved parameter values (crosses) and the measured spectra (solid lines) for sunset SS06.
6% for pressure and 5 K for temperature for altitudes from 20 to 45 km.
The mixing ratio profiles of all gases which
measured spectra (solid lines) for SS06. The tangent height used for each simulation is shown for each spectrum. For SS06, most of the
absorption features are simulated very well.
The CH3C1 mixing ratio profiles retrieved using the four sets of occultation data (i.e., SS06, SS09, SS13, and SR02) and one set of average data (i.e., SSAV) are shown in Figure 4. The standard deviations of retrieved values of CH3C1 from the
five sets of data are less than 11% of the mean
value at each altitude (the value from SR02 at 20 km is excluded because of large noise in the data). Shown also in Figure 4 is the range of reported values of CH3C1 obtained by in situ methods (Robinson et al., 1977; Penkett et alo,
1980; Schmidt et al., 1980; Fabian et al., 1981; and Leifer et al., 1981). The profile of Penkett et al. (1980) is in the upper limit of the range. Our retrieved values are within the range of results obtained by the in situ techniques between 12 and 17 kin, but they are near or exceed the
upper limits of the in situ measurements above
17 km; there is an indication that the CH3C1
profile may decrease less rapidly above 17 km thanindicated by previous studies. Our values above
21 km are not as reliable as those of the lower altitudes because of weak absorption. Predicted profiles for mid-latitudes shown in the figure
(Gidel et al., 1983; and Ko et al., 1984) also resemble the upper limit of results by the in situ
are used either as background profiles for comput-
techniques.
ing absorptions above the first retrieval layer or
Random
errors in the retrieved profiles are
as the interference gases are from the ATMOS
estimated to be about 20% for the altitude
range
reference profiles.
These reference profiles have
12 to 15 km, about 25% for the altitude
range 15
been constructed from both available measurements to 21 km, and 35% at altitudes above 21 km. Theseand theoretical
predictions.
errors are caused by uncertainties
in the analysis
algorithm, in pressure and temperature profiles, Results and Discussions in inferred values of tangent heights, and in the
interference effects (e.g.,
primarily of CH
4).
The
mixing
ratios of CH3C1
and
CH4
are
The
Ct• profiles retrieved
simultaneously
do not
retrieved for each tangent layer (1 km thick),
but
deviate by more than 15% from mean values of
during numerical iterations,
mixing ratios of
other reported data for latitudes 25 ø to 35øN
these gases between two measurement
points are
(e.g., •IO/NASA, 1982). Bias errors due to line
scaled exponentially to obtain smooth retrieved
parameter uncertainties
are estimated to be about
profiles.
An onion-peeling method is employed for'
10%, although they are not included in the error
the profile retrievals.The measured spectrum between 2966.5 and
2967.5 cm
-1 for a tangent altitude of 15.0 km (the
sixth spectrum of Figure 1) is shown again in
Figur• 2 (bottom curve).
Simulated spectra for
the same tangent altitude are also shown in Figure2 for various gases (i.e.,
H20 , 03, CH3C1
, CH•,
and all gases) included in the computations. The simulations are performed by using the A•iOSreference profiles in order to estimate the rela-
tive magnitudes of absorptions by various gases. The measured spectrum is not normalized by the background. The effective apodization function and a phase error formula, which were mentioned
earlier, are not included in the simulation of
instrument line shape. In spite of these approxi- mations, absorption features (mostly due to CH3C1 and CH•) have been simulated well. The observed
small feature at around 2967 41 cm
-1 which is not
shown in the simulation, is due to O
3 (Damon
et al., 1981). The spectral fittings have been done for the interval including Q3-branch mani- folds of CH3C1 but excluding this O 3 feature. Error in retrieved CH3C1 mixing ratio caused by not including wing absorption of this O 3 line is
estimated to be less than 1%.
Shown in Figure 3 are simulated spectra
budget.
20
I ß
• - oo
aa SS09sso6
\ o•k•A
•, I•'•A - ee .ss, • k • •. ..s.o.
•L'•CTI•
•
•
I I I I I I I I II -io
1•9
CH3CI VMR•i•, 4 •et•ie•ed •olume mixi• •atlo p•o•iles of CH3Cl •om •a•ious occultatio• data, •e •a•e o•
othe• •epo•ed •alues •o• C•3C1 by In situ
methods a•d •he •a•e o• •heo•etical p•edicted (crosses) using the retrieved parameter values and profiles for mid-latitudes are also shown.
768
- •'
Park et al.: Spectroscopic
Detection
of CH3Cl
Di ratios
a :ertainties in our
the limited number
phere.carlolie, ß
D-
strat photo !nces in the one-dimensionalChang'iY. nonlinear least
line intensities
al ,213-220,1977.
CiCerone, R.J.,
and S. Walters,
Stratospheri man-made
chlorøfi
1165-!167,
1974.
Cicerone, R J., D.H. Stedman and R.S. Stolarski, Estimate of late 1974 Stratospheric concentra- tion• of gaseous chlorine compounds (Clx),
.G•ophys. _Res.
' Lett•.., 2_, 219-222,1975.
Cicerone, R.J., S. Walters, and S.C. Liu, Nonlinear response of stratospheric ozone column to chlorine injections, J. Geophy. Res.,
88, 3647-3661, 1983.
Cronn, D.R., et al., Ha!ogenated compound identi- fication and measurements in the troposphere
and lower StratoSphere,
•. GeoPhy..Re.s.,
82,
5935-5947, 1977.
C•utzen, P.J., Estimates of the possible future
ozone reductions from continued use of fluoro-
chloro-methanes (CF2C12, CFC!3) , Geophys. Res.
Lett.,
•, 205-208; 1974..
Crutzen, P.J., I.S.A. Isaksen, and J.R. McAfee, The impact of the chlorocarbon industry on the
ozone layer, J. Geophys. Res., 83, 345-363,1978.
Damon, E., R.L. Hawkins, and J.H. Shaw, Aspectrum
of ozone
from 760 to 5800 cm
-1,
Interim Technical Report RF Project
761420/711626, Ohio State University, 1981.
ifer, R., K. Sommers, and S.F. Guggenheim, Atmospheric trace gas measurements with a new clean air sampling system, Geophys. Res. Lett.,
8_, 1079-1081, 1981.
Logan, J.A.', et al., Tropospheric chemistry: A
global perspective, J. Geophys. Res. , 86, 7210-
1981.
J.E., Natural halocarbons in the air and
in the sea, Nature , 256, •!93-194, 1975.
Margolis, J.S., and R.A. Toth, Absorption strength measurement of the v 1 band of methyl chloride,
J. Molec..SPec.t•s. , 66, 30-34, 1977.
Molina, M.J. and F.S. Rowland, Stratospheric sink
for chloroflUoromethanes: Chlorine atom
catalyzed destruction of ozone, Nature, 249, 810-812, 1974a.
Molina, M.'-J. and F.S. Rowland, Predicted present stratosphefic abundances of chlorine species from photodissociation of carbon tetrachloride,
Geophys. Res Lett.,
•, 309-312, 1974b,
Norton, R.H. and R. Beer, New apodizing functionsfor Fourier spectrometry, J. Opt. Soc. Am., 66, 259-264, 1976.
Park, J'H., Effect of interferogram smearing on atmospheric limb sounding by Fourier transform
bpectroscopy, Appl. Opt., 21., 1356-1366, 1982.
Park, J.H., Analysis and application of Fouriertransform spectroscopy in atmospheric remote
sounding, Appl. Opt;, 23, 2604-2613, 1984.
Park,'J,H., D.J.W. Kendall, and H.L. Buijs, Stratospheric HF mixing ratio profiles in the northern and southern hemispheres, J. Geophys. Res., 89, 11645-11653, 1984.
penk-•t, S.---A.,
et al., Methyl chloride in the
stratosphere, Nature, 283, 58-60, 1980. Robinson, E., et al., Halocarbon measurements inthe Alaskan troposphere and lower stratosphere,
Atom. Environ.., 11., 215-221, 1977,
Rothman, L.S., et al., AFGL atmospheric absorption parameters compilation: 1982 edition, Appl.
OPt., 22, 2247-2256, 1983a.
•
Rothman, L.S., et al., AFGL trace gas compilation:
Intensities of the vl-bands
1982 version, Appl. Opt., 22, 1616-1626, 1983b.
Dang'Nhu,
of 12CH3•5C1
M..
et al.22 37C1
and CH3 near 3 •m, J. Quant Schmidt,
.
U., et al., The
vertical distribution
of
Spectrosc. Radiat. Transfer, 26, 515-521, 1981.
CHIC1, CFC13, and CF2C12
in th• midlatitude
Elkins, J.W., R.H. Kagann, and R.L. Sams, Infrared band strengths for methyl chloride in the regions of atmospheric interest, J. Molec.
$pectrosc., 105, 480-490, 1984.
Fabian, P., et al. Halocarbons in the strato- sphere, Nature, 294, 733-735, 1981. Farmer, B. and O.F. Raper, High resolution
infrared spectroscopy from space: A prelimi- nary report on the results of the atmospheric trace molecule (ATMOS) experiment on Spacelab 3, NASA CP-2429, 1986.
Gidel, L.T., P.J. Crutzen, and J. Fishman, A two- dimensional photochemical model of the
atmosphere 1: Chlorocarbon emissions and their effects on stratospheric ozone, J. Geophys. Res., 88, 6622-6640, 1983.
Grimsrud, E.P. and R.A. Rasmussen, Survey and analysis of halocarbons in the atmosphere by gas chromatography-mass spectrometry, Atm.
Environ. •, 1014-1017, 1975.
Kendall, D.J.W. and H.L. Buijs, Stratospheric NO 2 and upper limits of CHIC1 and C2H 6 from measure ments at 3.4 •m, Nature, 303, 221-222, 1983. Ko, M.K.W., et al., The seasonal and latitudinal
behavior of trace gases and O 3 as simulated by
a two-dimensional model of the atmosphere, J,
Atm. Sci., 41' 2381-2408, .1984'
_
---
stratosphere, Proc., Quad. Int. Ozone Symp., J. London, Ed., Boulder, I•t•P and IOC, 169, 1980. Solomon, S. and R.R. Garcia, Onethe distributions
of long-lived traces and chlorine species in
the middle atmosphere. J. Geoph•s. Res., 89,
11633-11644, 1984.
WMO/NASA, The Stratosphere 1981; The theory and measurements, R. D. Hudson, E. I. Reed and R. D. Bojkov, Eds., WMO Global Ozone Research and Monitoring Project Report #11, 1982.
Wofsy, S.C., M. McElroy, and N. Sze, Freon consumption: Implications for atmospheric ozone, Science, 187, 535-537, 1975.
C. B. Farmer, R. H. Norton, and O. F. Raper, Jet Propulsion Laboratory, Pasadena, CA 91109.
J. H. Park, C. P. Rinsland, and J. M. Russell III, Atmospheric Sciences Division, NASA Langley Research Center, Hampton, VA 23665-5225.
R. Zander, Institute of Astrophysics, University of Liege, Liege-Ougree, Belgium.
(Received April 25, 1986; accepted •l•y 15, 1986.)