C
LINICAL
AND
MOLECULAR
CLASSIFICATION
OF
GLIOBLASTOMA
PATIENTS
Lambert Jérémy*, Kaoma Tony°, Van Dyck Eric°, Laurent Vallar°, Niclou Simone°, Martin Didier”, Scholtes Felix*”
*GIGA-Neurosciences, Nervous System Disorders and Therapy Unit, University of Liège, °Norlux Neuro-Oncology Laboratory, Luxembourg Institute of Health,“Department of Neurosurgery, Liege University Hospital
Contact : jeremy.lambert@ulg.ac.be
Glioblastoma (GBM) still carries a poor prognosis with an average survival of 12 to 15 months. However, survival is variable—ranging from a few months to several years—and difficult to predict for an individual patient. To this end, first, prognostic classification trees exist, based on known clinical factors. These give a good prognostic stratification, but there still are short and long survivors in each group. Second, survival variability has been evaluated using biological markers. Stratification with biological markers does result in groups of “high” or “low” risk of death, but, again, there are short and long survivors within these groups. Also, the real prognostic value of biological markers could be masked by clinical heterogeneity. Thus, the combination of both clinical and biological factors may provide more discriminating prognostic information.
Clinical stratification and biological factors are combined to create a clinically relevant, integrated prognostic model to assist therapeutic decision making.
Reducing clinical heterogeneity of glioblastoma appears to be a promising strategy to unmask potential biological markers of prognosis. This is illustrated by the homogeneity of the gene expression profile on the heat map including all patients, whereas an association of gene expression and prognosis was seen in the more homogenous age groups.
Clearly, further investigations are indicated to more precisely define the genetic abnormalities associated with survival, in order to help predict outcome and orientate therapeutic strategies, including neurosurgical decision making based on the expected clinical evolution of the patient.
Introduction
Aims of the project
Methods and Results
Conclusions
Survival
Survival
Survival Survival
Survival Survival
Fig 1a. All patients (n=153)
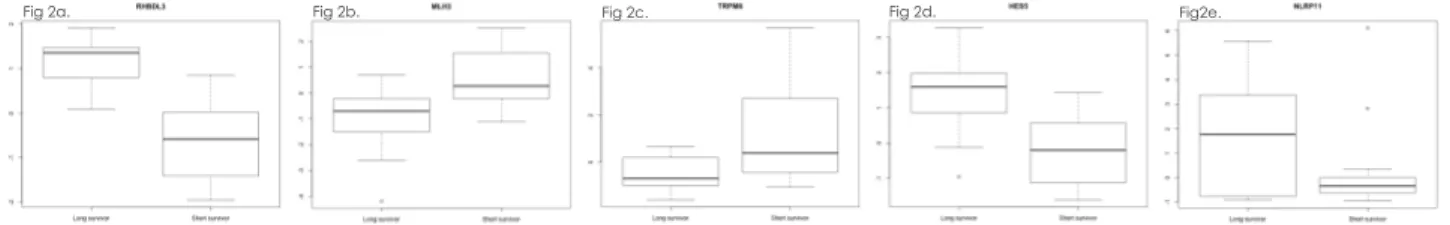
Fig 2a. Fig 2b. Fig 2c. Fig 2d. Fig2e.
Figure 1: Genetic profiles associated with survival. The expression level of genes (rows) influencing survival were plotted on heat maps after sorting patients (columns) by increasing survival. In all patients, no gene expression levels are different or associated with survival (Fig 1a), while differences can be found in homogenous age groups (Fig 1b to 1f).
Fig 1d. 50-60yo patients (n=42) Fig 1e. 60-70yo patients (n=43) Fig 1f. >70yo patients (n=24) Fig 1c. 40-50yo patients (n=21)
Fig 1b. <40yo patients (n=23)
2 – Selection of genes influencing survival
Using cox regression, within each group, a number of genes with significant impact on survival were identified: 1181 in <40yo, 594 in 40-50yo, 1673 in 50-60yo, 291 in 60-70yo, 531 in >70yo.
3 – Correlation of gene expression levels with survival
In order to illustrate the influence of the expression of the identified genes on survival in the 5 groups, two different strategies were used.
First, each individual patient’s level of expression of the identified genes was directly correlated with survival (figure 1). With increasing survival, the expression profile changes: overexpressed genes (red) become underexpressed, and vice versa. This appears most clearly in the youngest and the oldest patient groups (figures 1b, 1c and 1f).
Second, patients in each age group were separated into ”short” and “long” survivors based on mean survival within each group. The gene expression level was compared between these two groups (example: figure 2). Anova tests revealed a number of differentially expressed genes: 227 in <40yo, 36 in 40-50yo, 810 in 50-60yo, 81 in 60-70yo, and 87 in >70yo. 1 – Clinical stratification of patients
Clinical and mRNA expression level (Affymetrix Human Exon 1ST) data of 399 patients was obtained from The Cancer Genome Atlas (TCGA) portal. Only patients treated according to Stupp’s protocol (60Gy radiotherapy with concomitant and adjuvant Temozolomide) were included in the present analysis, in order to obtain a homogenously treated patient sample (n=153). First, factors available in common clinical practice were tested for their impact on survival in this sample: age, clinical performance as measured by the Karnofsky scale, extent of resection, MGMT promoter methylation. Only age had significant influence on survival. Therefore, 5 age groups were created, in order to then correlate survival with gene expression within these more homogeneous clinical prognostic groups : <40, 40-50, 50-60, 60-70 and >70 years.
Figure 2: Differential expression between short and long survivors: boxplots with the 5 most discriminant genes in <40yo (figures 2a to 2e). These genes can then be combined in predictive signatures to predict if patients will be short or long survivors.