HAL Id: ird-00425916
https://hal.ird.fr/ird-00425916
Submitted on 22 Oct 2009
HAL is a multi-disciplinary open access
archive for the deposit and dissemination of
sci-entific research documents, whether they are
pub-lished or not. The documents may come from
teaching and research institutions in France or
abroad, or from public or private research centers.
L’archive ouverte pluridisciplinaire HAL, est
destinée au dépôt et à la diffusion de documents
scientifiques de niveau recherche, publiés ou non,
émanant des établissements d’enseignement et de
recherche français ou étrangers, des laboratoires
publics ou privés.
A simple algorithm to estimate evapotranspiration from
DAIS data: Application to the DAISEX campaigns
J.A. Sobrino, M. Gomez, J.C. Jimenez-Munoz, Albert Olioso, A. Chehbouni
To cite this version:
J.A. Sobrino, M. Gomez, J.C. Jimenez-Munoz, Albert Olioso, A. Chehbouni. A simple algorithm
to estimate evapotranspiration from DAIS data: Application to the DAISEX campaigns. Journal of
Hydrology, Elsevier, 2005, 315, pp.117-125. �10.1016/j.jhydrol.2005.03.027�. �ird-00425916�
A simple algorithm to estimate evapotranspiration from DAIS data:
Application to the DAISEX campaigns
J.A. Sobrino
a,*, M. Go´mez
a, J.C. Jime´nez-Mun˜oz
a, A. Olioso
b, G. Chehbouni
caDepartment of Thermodynamics, Faculty of Physics, University of Valencia, 50 Dr Moliner, 46100 Burjassot, Spain bINRA Bioclimatologie, Domaine Saint-Paul, Avignon, France
cCESBIO (CNES-CNRS-IRD-UPS), Toulouse, France
Abstract
The knowledge of evapotranspiration is of great interest in many applications such as assessing irrigation water use. In this paper, a methodology is presented to estimate evapotranspiration using the surface energy balance model S-SEBI (Simplified Surface Energy Balance Index) and the evaporative fraction. The method is applicable under the assumptions of constant atmospheric conditions and sufficient wet and dry pixels over the image. The model uses remotely sensed parameters such as albedo, MSAVI (Modified Soil Adjusted Vegetation Index) and surface temperature and emissivity images. The methodology has been applied over the Barrax test site, located in the province of Albacete (Castilla La Mancha, Spain), in the framework of the DAISEX (Digital Airborne Imaging Spectrometer Experiment) campaigns carried out by ESA (European Space Agency). Net radiation, soil heat fluxes and evapotranspiration have been obtained from DAIS images for alfalfa, corn and grass plots. The results show that alfalfa plot gives the highest values, around 5 mm dK1, whereas corn plot gives the lowest, around 3.5 mm dK1. The proposed methodology leading to an accuracy for the daily evapotranspiration lower than 1 mm dK1. q2005 Elsevier B.V. All rights reserved.
Keywords: Evapotranspiration; Evaporative fraction; Net radiation flux; Soil heat flux; DAIS; S-SEBI
1. Introduction
Evaporation is the process whereby liquid water is converted to water vapour and removed from the evaporating surface. Transpiration consists of the vaporisation of liquid water contained in plant tissues
and the vapour removal to the atmosphere. The combination of the two separate processes whereby water is lost on the one hand from the soil surface by evaporation and on the other hand from the crop by transpiration is referred to as evapotranspiration (ET) (Allen et al., 1998). Knowledge of crop evapotranspira-tion is very important, because it allows optimisaevapotranspira-tion of the irrigation water use in arid and semi-arid regions where water shortage is a problem. The estimation of evapotranspiration is of great importance for agricul-tural, hydrological and climatic studies, as it constitutes a major part of the hydrological cycle. Conventional
doi:10.1016/j.jhydrol.2005.03.027
* Corresponding author. Fax: C34 96 3543099.
E-mail addresses: [email protected] (J.A. Sobrino), monica. [email protected] (M. Go´mez), [email protected] (J.C. Jime´nez-Mun˜oz), [email protected] (A. Olioso), [email protected] (G. Chehbouni).
ground-based methods for estimating evapotranspira-tion such as the Bowen ratio, provide accurate measurements over a homogeneous area surrounding the instrument, but the results are not applicable to large diverse areas. Significant improvements are expected from mapping of the spatial distribution of evapotran-spiration using remote sensing.
In this paper, a simple algorithm to estimate the evapotranspiration from DAIS (Digital Airborne Imaging Spectrometer) images is presented. The images were obtained in the framework of DAISEX (Digital Airborne Imaging Spectrometer Exper-iments) campaigns, a series of experiments supported by ESA (European Space Agency) and achieved in 1998 (DAISEX-98), 1999 (DAISEX-99) and 2000 (DAISEX-00) in Barrax (39830N, 2860W), Castilla La Mancha (Spain). The description of the DAISEX campaigns and the DAIS sensor as well as the Barrax test site has been given below.
2. Methodology
On the basis of the S-SEBI (Simplified Surface Energy Balance Index) model developed byRoerink
et al. (2000), the evapotranspiration (ET) can be estimated using the following equation
LETiZ LðRniKGiÞ (1)
where LETi is the instantaneous latent heat flux
(W mK2), L is the evaporative fraction, Rni is the
instantaneous net radiation flux (W mK2) and Giis the
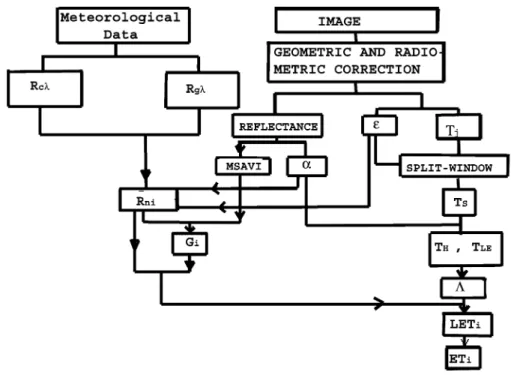
instantaneous soil heat flux (W mK2). The method-ology proposed in the paper is summarized inFig. 1. Next, we give the expressions for the estimation of the different terms involved in Eq. (1).
2.1. Net radiation flux
The instantaneous net radiation flux can be obtained according to the following equation (Sobrino et al., 2000)
RniZ ð1 K aÞRclYC3RglYK3sTS4 (2)
where a is the albedo, RclYis the incoming shortwave
radiation (W mK2), RglY is the incoming longwave
radiation (W mK2), s is the Stefan Boltzman constant, 3 the surface emissivity, and TSthe surface
temperature (K). In order to estimate daily values,
the procedure proposed bySeguin and Itier (1983)has been used. According to these authors the ratio between daily and instantaneous net radiation is constant for a given time. For example, at midday (12:00 solar time) in summer the following expression can be used:
Rnd
Rni
Z 0:30G0:03 (3)
For instantaneous values not acquired at midday in summer, the ratio between Rnd and Rnineeds to be
recalculated (Wassenaar et al., 2002).
2.1.1. Albedo
The ratio of the solar radiative flux that is reflected from a surface to the flux intercepted by the surface is called albedo. According to Saunders (1990), the surface albedo has been calculated using the visible and near infrared (NIR) channels according to the following equation
a Z12ðrREDCrNIRÞ (4)
where rREDand rNIRare, respectively, the RED and
NIR reflectances calculated in our case using DAIS channels 10 (0.66 mm) and 22 (0.87 mm), respectively. 2.1.2. Surface temperature and emissivity
In order to apply Eq. (2), land surface temperature (TS) and emissivity are needed. In this paper, the
split-window algorithm proposed bySobrino et al. (2004) and adapted to DAIS channels has been used TSZ T77C2:937ðT77KT78Þ C 0:8193ðT77
KT78Þ2
K0:3284 Cð72:094 K13:864WÞ !ð1 K 3Þ C ðK119:592 C25:136WÞD3 (5) where T77 and T78 are the at-sensor or brightness
temperatures (in K) for DAIS thermal channels 77 and 78, 3Z(377C378)/2 and D3Z(377K378) are the mean
surface effective emissivity and the spectral emissiv-ity difference, respectively, and W is the total atmospheric water vapour content (in g cmK2).
Land surface emissivity has been estimated from DAIS data using the NEM (Normalized Emissivity Method), developed by Gillespie (1985), following the procedure explained in Sobrino et al. (2004).
Despite the NEM is capable of providing TS, in this
paper, we have obtained TSfrom Eq. (5) which give
better results specially for wet atmospheres (Sobrino and Jime´nez-Mun˜oz, 2003). The accuracy of TS and
emissivity obtained from Eq. (5) and the NEM method is better than 1.5 K and 0.01, respectively.
2.2. Soil heat flux
The soil heat flux can be estimated from the net radiation and the MSAVI (Modified Soil Adjusted Vegetation Index) values according to
GiZ Rni0:5 expðK2:13 MSAVIÞ (6)
where MSAVI is given by (Qi et al., 1994): MSAVI
Z2rNIRC1 K
ffiffiffiffiffiffiffiffiffiffiffiffiffiffiffiffiffiffiffiffiffiffiffiffiffiffiffiffiffiffiffiffiffiffiffiffiffiffiffiffiffiffiffiffiffiffiffiffiffiffiffiffiffiffiffiffiffiffiffiffiffi ð2rNIRC1Þ2K8ðrNIRKrREDÞ
p 2
(7) As was explained before, rRED and rNIR are,
respectively, the RED and NIR reflectances calculated using DAIS channels 10 (0.66 mm) and 22 (0.87 mm).
2.3. Evaporative fraction
According toRoerink et al. (2000), the evaporative fraction (L) is given by
L ZTTHKTS
HKTLET
(8) where TSis the land surface temperature and THand
TLETare two temperatures obtained according to the
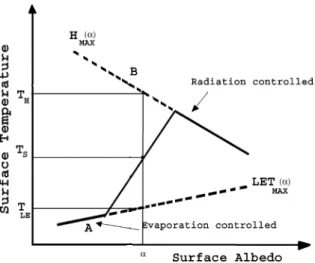
scheme given in Fig. 2. It should be noticed that Eq. (8) is only applicable when the atmospheric conditions are constant over the images and sufficient wet and dry pixels are present. From the analysis of the Fig. 2 it is observed an approximately constant surface temperature (TS) for low albedo values. This
concern water saturated surfaces like open water and irrigated lands, where all available energy is used in evaporation process. On the other hand, for higher albedo values the figure shows an increase of TS
with albedo. Thus, from A to B the temperature increases with albedo because of the change in the surface temperature is a result of the decrease of
the evaporation as a consequence of less soil moisture availability. Here, the surface temperature increase in excess due to sensible heat flux exceeds the decrease in net radiation due to the increase of albedo. Here, the surface temperature is said ‘controlled evaporation’. Finally, the surface temperature (from B) decreases with increasing albedo. This is due to the fact that soil moisture has decreased to such an extent that no evaporation can take place in this case, and all available energy is used to heat the surface. Thus to the increase of albedo, the available energy decreases as a result of the decrease in net radiation. Here, the surface temperature is said ‘controlled radiation’ (Roerink et al., 2000). In this way, TLETis obtained
when HiZ0, and therefore, LETmax i (a)ZRniKGi;
and THwhen LETiZ0, and for this case, Hmax i(a)Z
RniKGi.
2.4. Evapotranspiration
Evapotranspiration can be easily obtained from Eq. (1) once the net radiation, the soil heat flux and the evaporative fraction are known. Estimation of evapo-transpiration daily values ETd(in mm dK1) requires
the integration of the latent heat flux over the whole day, with L the latent heat of vaporization (2.45 MJ kgK1). When LET values are instantaneous, as is the case of remote sensing images, then daily values can be obtained by assuming that the evaporative fraction at the daily scale is similar to
the instantaneous value derived from Eq. (8) at the time of remote sensing data acquisition (Bastiaansen, 2000). In this way, writing Eq. (1) for daily and instantaneous values the following equation is obtained LETd LETi Z Ld Li ðRndKGdÞ ðRniKGiÞ zðRndK GdÞ ðRniKGiÞ (9) and therefore, it is possible to express daily values as a function of instantaneous values according to ETdZ LETi
Rnd
LðRniKGiÞ
(10) where the ground heat flux has been assumed close to zero at daily scale (Gdz0) and daily net radiation can
be expressed in terms of instantaneous net radiation according to Eq. (3).
3. The DAISEX field campaigns
The main scientific objective of the DAISEX campaigns was to demonstrate the feasibility of quantitatively retrieving geo/biophysical variables by accounting for atmospheric effects while at the same time analysing the data for possible additional information on directional anisotropy. Bio/geophysi-cal variables included the leaf area index (LAI), biomass, leaf water content, canopy height, chlor-ophyll content, surface temperatures and emissivity.
Fig. 2. Surface temperature versus surface albedo. H is the sensible heat flux, LET is the latent heat flux and a is the albedo (adapted from Roerink et al., 2000).
Since, accurate calibration and atmospheric correc-tions are essential to quantitatively retrieve these variables, in situ atmospheric measurements (needed to derive the atmospheric corrections) were performed in addition to field measurements for validating calibration and retrieval. Three airborne campaigns were organised over test sites in Spain, France and Germany in 1998, 1999 and 2000 exploiting a range of different airborne instruments (Mu¨ller and Hausold, 2001).
3.1. The DAIS sensor
The Digital Airborne Imaging Spectrometer, DAIS 7915 (or simply DAIS), is a 79 channel high resolution optical spectrometer which collects infor-mation from the Earth’s surface in the 0.4–13 mm wavelengths region while scanning from an aircraft, electronically processes this data into digital format consisting of 16 bit words, and records these digital data on a cartridge recorder. The DAIS scan mechanism is a Kennedy type where a cubic polygon mirror scans the terrain below through the opened window hatch in the bottom of the aircraft. The scan mirror rotates anti-clockwise with respect to the aircraft heading to provide a ground element cross track scanning motion while the forward motion of the aircraft provides a requested line-by-line scan. The most relevant geometric parameters are the IFOV (Instantaneous Field of View), 3.3 mrad, and the swath angle, G268. From the 79 channels, six works in the 8–13 mm region (from 74 to 79, with the next effective wavelengths: 8.747, 9.648, 10.482, 11.266, 11.997 and 12.668 mm, respectively) with a band-width of 0.9 mm. They can be used for the retrieval of temperature and emissivity of land surface objects (Mu¨ller and Hausold, 2001). The principal character-istics of the DAIS sensor are shown inTable 1.
3.2. The Barrax test site
The Barrax test site is situated in the west of the province of Albacete, 28 km from the capital town (39830N, 2860W; 700 m above sea level). The land-scape in this area is flat with no change of elevation higher than 2 m over the whole area. Under Barrax area several aquiferous geological formations exit. These formations seem to be connected and form
a regional groundwater body. The regional water table is about 20–30 m below the land surface. Never-theless, there is some evidence that, at least locally, several perched aquifers exist with their water table between 4 and 7 m deep (Moreno et al., 2001).
The climate is of Mediterranean type, with heaviest rainfalls in spring and autumn and lowest in summer. It presents a high level of continentally, with quite sudden changes from cold months to warm months and high thermal oscillations in all seasons between the maximum and minimum daily temperatures. The rainfall statistics show that the mean annual rainfall is little more than 400 mm in most of the area, making La Mancha one of the driest regions in Europe. Precipitation is seasonal, with minimum in summer and high year-to-year variability. The dominant cultivation in the 10,000 ha area is approximately 65% dry land (of which 67% are winter cereals and 33% fallow land) and 35% irrigated land (corn 75%; barley/sunflower 15%; alfalfa 5%; onions 2.9%; vegetables 2.1%). The University of Castilla-La Mancha, owns the agroclimatologic station of Las Tiesas-Lisi´metro (3980303000N; 280502400W) in the study area of Barrax.
Table 1
Principal characteristics for DAIS-7915 sensor Spectrometer characteristics
Wavelength range (nm)
No. bands Bandwidth Detector
450–1050 32 25 nm Si 1500–1800 8 45 nm InSb 1900–2450 32 25 nm InSb 3000–5000 1 2.0 mm MCT 8700–12300 6 0.9 mm MCT Geometric parameters IFOV: 3.3 mrad Swath angle: G268 Image pixels per line: 512
Spatial Resolution: 2–20 m (depending on the flight altitude) Radiometric parameters
Sensibility VIS/NIR: NER !0.25 W mK2sr mm SWIR: NER !0.25 W mK2sr mm
MIR/TIR: NET !0.1 K Dynamic range: 15 bit
(no gain settings)
4. Results
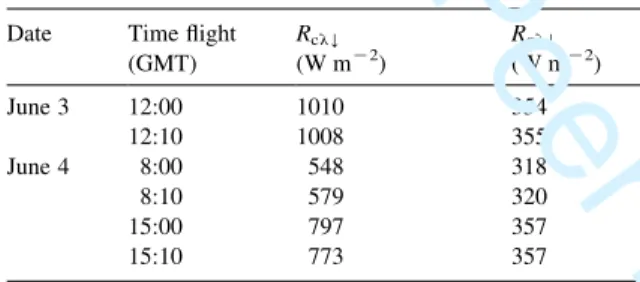
In order to analyse the results obtained by applying the methodology proposed, five regions of 5!5 pixels (25 m2) with different crops have been extracted from the DAIS images acquired over the Barrax test site: alfalfa, corn with five leaves, corn with two leaves, Festuca and barley (seeFig. 3).Table 2shows the date and the time flight for the DAIS images used in this study, as well as the incoming shortwave and longwave radiation obtained from meteorological data and needed in order to estimate the net radiation from Eq. (2).Table 3shows the THand TLETvalues
obtained for the different DAIS images as a function of surface albedo (see Section 2.3).Table 4shows the results obtained for the different fluxes and the daily evapotranspiration by using the expressions explained in Section 2 and the data shown inTables 2 and 3. And finally,Table 5shows the instantaneous net radiation and soil heat fluxes measured in the Anchor Station, and the values estimated with the proposed method. The methodology has been tested using measured data from the lysimeter station located near the festuca and barley plots. The comparison between ET values obtained with the methodology proposed in the paper and the lysimeters measured values for 3 June 1999 on festuca (5.01 mm dK1) and barley (5.35 mm dK1) and for 4 June on festuca (4.59 mm dK1) and barley (5.60 mm dK1) shows a root mean square deviation (RMSD) of 1 mm dK1. Daily net radiation, daily latent heat and instantaneous heat soil and fluxes have been also compared with meteorological data, show-ing a RMSD of 7, 26 and 40%, respectively. These RMSD values agree with the errors obtained from the sensitivity analysis (in which typical errors of 0.03 for
Table 2
Meteorological data employed to determine the net radiation flux (where RclY; and RglY; are the incoming shortwave and longwave
radiation, respectively) Date Time flight
(GMT) RclY (W mK2) RglY (W mK2) June 3 12:00 1010 354 12:10 1008 355 June 4 8:00 548 318 8:10 579 320 15:00 797 357 15:10 773 357
Fig. 3. DAIS image for the Barrax site with the different plots selected to estimate evapotranspiration.
Table 3
Values of TH, and TLETfor the different flights as a function of albedo (a)
Date Time flight (GMT) TH(K) TLET(K)
03/06/99 12:00 K37.5aC350.0 17.5aC290.0 12:10 K55.0aC360.0 12.5aC290.0 04/06/99 8:00 K32.5aC330.0 10.0aC287.0 8:10 K40.0aC340.0 7.5aC289.0 15:00 K32.5aC340.0 17.5aC290.0 15:10 K35.0aC345.0 17.5aC290.0
TLETis obtained when HiZ0, and therefore, LETmax i(a)ZRniKGi; and THwhen LETiZ0, and for this case Hmax i(a)ZRniKGi(see
Section 2.3).
albedo, 1.5 K for temperature, 0.01 for emissivity and 5% for the incoming shortwave and longwave radiation have been considered).
Once the algorithm have been evaluated, it has been applied to DAIS images. Figs. 4 and 5 show, respectively, the daily evapotranspiration obtained from 4 June at 8:00 GMT on the Barrax site and the difference between daily evapotranspiration estimated for two consecutive flights.Fig. 4shows the highest values for alfalfa and lowest values for corn plots and allows to distinguish the irrigated areas on the different plots.Fig. 5shows little differences between the two consecutive flights, which gives some confidence on the developed methodology to obtain the evapotranspiration.
Table 4
Values of daily net radiation flux, Rnd/Rni, instantaneous soil heat flux, evaporative fraction and daily evapotranspiration obtained from the
proposed method and for the different plots extracted from DAIS images
Plot Date/time flight
(GMT) Rnd/Rni Rnd (W mK2) Gi (W mK2) L ETMETHOD d (mm dK1) Barley June 3/12:00 0.27 174.12 47.67 0.72 4.09 June 3/12:10 0.27 157.88 43.89 0.70 3.60 June 4/8:00 0.52 178.22 30.48 0.87 4.98 June 4/8:10 0.49 175.62 32.14 0.89 5.02 June 4/15:00 0.36 186.86 29.42 0.72 4.47 June 4/15:10 0.38 185.45 29.16 0.73 4.49 Festuca June 3/12:00 0.27 174.73 46.67 0.62 3.54 June 3/12:10 0.27 169.81 44.48 0.71 3.95 June 4/8:00 0.52 169.39 34.15 0.73 3.90 June 4/8:10 0.49 166.64 35.82 0.76 4.00 June 4/15:00 0.36 189.23 33.56 0.67 4.18 June 4/15:10 0.38 186.80 32.16 0.67 4.12 Alfalfa June 3/12:00 0.27 159.10 15.37 0.88 4.81 June 3/12:10 0.27 152.36 14.56 0.91 4.76 June 4/8:00 0.52 147.26 10.83 0.96 4.79 June 4/8:10 0.49 150.81 11.41 0.96 4.91 June 4/15:00 0.36 173.41 10.86 0.91 5.44 June 4/15:10 0.38 173.67 10.63 0.92 5.50 Corn (two leaves) June 3/12:00 0.27 159.09 61.37 0.76 3.82 June 3/12:10 0.27 150.49 58.59 0.76 3.61 June 4/8:00 0.52 154.56 50.94 0.78 3.52 June 4/8:10 0.49 143.19 48.10 0.80 3.37 June 4/15:00 0.36 131.92 31.47 0.51 2.17 June 4/15:10 0.38 144.65 36.11 0.60 2.77 Corn (five leaves) June 3/12:00 0.27 161.39 63.11 0.70 3.56 June 3/12:10 0.27 159.66 63.00 0.76 3.82 June 4/8:00 0.52 143.61 47.69 0.74 3.10 June 4/8:10 0.49 149.84 47.67 0.78 3.43 June 4/15:00 0.36 159.43 43.89 0.56 2.85 June 4/15:10 0.38 152.44 30.48 0.58 2.81 Table 5
Experimental and model values of Rniand Gifor the Barrax test site
Date/time flight (GMT)
Method Anchor station measure
Rni (W mK2) Gi (W mK2) Rni (W mK2) Gi (W mK2) June 3/12:00 464.0 53.5 570.0 54.0 June 3/12:10 498.4 54.6 567.0 54.0 June 4/8:00 315.7 67.2 277.0 13.0 June 4/8:10 296.0 50.3 297.0 16.0 June 4/15:00 333.6 32.4 400.0 48.0 June 4/15:10 364.0 40.9 384.0 46.0
5. Conclusions
In this paper, a simplified methodology in order to obtain daily evapotranspiration. The methodology has been applied to an experimental test site in Albacete (Spain) in which five plots have been selected (alfalfa, corn with two and five leaves, festuca and barley). The results show daily evapotranspiration can be obtained with an error lower than 1 mm dK1. The main disadvantage of the methodology proposed is the requirement of extreme surface values over the image. Other methods as SEBAL shows better results in the daily evapotranspiration determination, but this method includes the determination of the roughness length, which is a difficult task. Further, studies are necessary in order to confirm the results presented in this paper.
Acknowledgements
We wish to thank the ESA (European Space Agency) for financial support (projects ESA-ESTEC 13053/NL/GD and 13390/NL/GD) and the DLR (German Optoelectronic Institute) for providing the DAIS images. We would also like to thank the European Union (EAGLE, Project SST3-CT-2003-502057) and the Ministerio de Ciencia y Tecnologi´a (project REN2001-3105/CLI) for the financial support.
References
Allen, R.G., Pereira, L.S., Raes, D., Smith, M., 1998. Crop evapotranspiration—Guidelines for computing crop water requirements. FAO Irrigation and drainage paper 56, Rome. Bastiaanssen, W.G.M., 2000. SEBAL-based sensible and latent heat
fluxes in the irrigated Gediz Basin, Turkey. J. Hydrol. 229, 87–100.
Gillespie, A.R., 1985. Lhitologic mapping of silicate rocks using TIMS. The TIMS Data Users Workshop. JPL Publications pp. 86–38, see also 29–44.
Moreno, J., Calera, A., Caselles, V., Cisneros, J.M., Martinez-Lozano, J.A., Melia, J., Montero, F., Sobrino, J.A., 2001. The measurement programme at Barrax. DAISEX Final Results Workshop, ESTEC, Holland, 15–16 March 2001, ESA SP-499, pp. 43–51.
Mu¨ller, A., Hausold, A., 2001. The airborne imaging spectrometer data acquisition programme in 1998, 1999 and 2000. DAISEX Final Results Workshop, ESTEC, Holland, 15–16 March 2001, ESA SP-499, pp. 7–11.
Fig. 5. Difference between daily evapotranspiration (ETd) obtained
from DAIS images on June 4th at 8:00 and 8:10 GMT.
Fig. 4. Daily evapotranspiration (ETd) image obtained from DAIS
Qi, J., Chehbouni, A., Huete, A.R., Kerr, Y.H., Sorooshian, S., 1994. A modified soil adjusted vegetation index (MSAVI). Remote Sensing Environ. 48, 119–126.
Roerink, G.J., Su, Z., Menenti, M., 2000. S-SEBI: a simple remote sensing algorithm to estimate the surface energy balance. Phys. Chem. Earth (B) 25 (2), 147–157.
Saunders, R.W., 1990. The determination of broad land surface albedo from AVHRR visible and near infrared radiances. Int. J. Remote Sensing 11, 49–67.
Seguin, B., Itier, B., 1983. Using midday surface temperature to estimate daily evaporation from satellite thermal IR data. Int. J. Remote Sensing 4 (2), 371–383.
Sobrino, J.A., Jime´nez-Mun˜oz, J.C., 2003. Land surface tempera-ture retrieval in the framework of the SPECTRA mission, Proceedings of Second SPECTRA Workshop, 28–30 October, STEC (Noordwijk, The Netherlands). ESA Publications.
Sobrino, J.A., Raissouni, N., Kerr, Y., Olioso, A., Lo´pez-Garci´a, M.J., Belaid, A., El Kharraz, J., Cuenca, J., Dempere, L., 2000. In: Sobrino, J.A. (Ed.), Teledeteccio´n. Servicio de publicaciones, Universidad de Valencia, Valencia, Spain. ISBN: 84-37034220-8.
Sobrino, J.A., Jime´nez-Mun˜oz, J.C., El Kharraz, J., Gomez, M., Romaguera, M., Soria, G., 2004. Single-channel and two-channel methods for land surface temperature retrieval from DAIS data and its application to the Barrax site. Int. J. Remote Sensing 25 (1), 215–230.
Wassennar, T., Olioso, A., Hasager, C., Jacob, F., Chehbouni, A., 2002. Estimation of evapotranspiration on heterogeneous pixels. In: Sobrino, J.A. (Ed.), First International Symposium on Recent Advances in Quantitative Remote Sensing, 16–20 September 2002. Publicacions de la Universitat de Vale`ncia, Espan˜a, Valencia, Spain, pp. 458–465.