RELATION BETWEEN RISK AND RETURN IN TUNISIAN’S STOCK MARKET AFTER
THE REVOLUTION (DURING POLITICAL INSTABILITY)
Algia Hammami *; Ameni Ghenimi**; Abdelfatteh Bouri ***
* University of Sfax, Faculty of Economic Sciences and Management of Sfax, Research Unit: Governance, Finance and Accounting
E-mail: hammamialgia@yahoo.fr
** Faculty of Economic Sciences and Management of Tunis, Campus University,
E-mail: amenighenimi@yahoo.fr
*** Professor in Finance at the Faculty of Economics and Management of Sfax.
E-mail: Abdelfettah.bouri@fsegs.rnu.tn
Abstract
This paper examines the conditional relationship between the Tunisian stock market performance and the various sources of risk (market risk, the risk of oil prices, exchange rate risk, skewness and kurtosis) after the revolution (2011-2014). The methodology used in this paper is a multi-factor model to analyze the risk-return relationship for most equity sectors. We find a positive risk-return relationship statistically significant at a 1% in the up and down market. The oil price is found to be negative and statistically insignificant in the up and down oil market, suggesting that the oil price is indeed an important factor in determining stock returns. Results for other risk factors like skewness and kurtosis are also presented. These results are useful for individual and institutional investors, managers and policy makers.
Keywords: Risk; return; multifactor conditional model; Tunisian Stock Market; instability political; oil prices.
Copyright© ISSN 1923-2993 Journal of Academic Finance (J.A.F.) N° 5 fall 2015 1. Introduction
Four years after the Arab Spring in Tunisia, oil prices rose by 7% according to the financial low recently introduced by the government. Moreover, we interested an increase of inflation. In July 2013, prices rose by 6%. As a result, Tunisia went into an inflectional spiral which represents a danger for the Tunisia economy. Actually, this new macro-economic situation should affect the way risks were perceived by investors as well as the current and future cash flow estimation.
As a result, the macro-economic changes could affect the share prices and returns. Regarding the relationship between the macro-economic variables and the stock returns during a crisis period, several experts should that political instability affects both the macro-economic factors and the share prices (Karolyi, 2006; Labo, 1999; Brooks and all, 1997; Leon and all, 2000.).
At the beginning of 2011, the value of the stock price index declined by 21% compared to the previous year. The year 2011 is therefore known as the beginning of political instability in the history of the Tunisian Exchange rate. In 2012, we believe that the Tunisian stock exchange could regain its 13% growth by the returns of foreign direct investment. Moreover, despite a troubled environment due to political divisions, social unrest and economic difficulties along with the threat of terrorism, the Tunis Stock Exchange managed to hold on in 2013. In 2014, Tunis Stock Exchange ended on a positive note the pace of progress of the democratic transition process. The benchmark index of the Tunis Stock Exchange increased from by 16.17% to 5089.99 points by the end of 2014.
The main objective of this paper is to estimate the conditional relationship between various risk factors and stock market returns for nine sectors (automobile and equipment, banks, buildings, industries, finance, basic material, services to consumer, financial services). Moreover, to our knowledge, there are no studies that consider the conditional model and unconditional Pettengill, Sundaram and Mathur, 1995 with asymmetry and kurtosis factors to estimate the cost of equity in times of political instability.
The estimation approach in this study involves two steps. In the first step, we estimate the coefficients beta on the risk factors (independent variables) for each industry and for each year using Generalized Method of Moments (GMM) Approach to Times- Series Regression. In the second step, a pooled data set of stock returns and risk parameters are used to estimate random effect models of the relationship between risk factors and stock returns in the Tunisian Stock Exchange. We find significant conditional relationship between risks and returns for only one risk factors (stock risk).
The remainder of this paper proceeds as flows. We present the introduction in section 1. In section 2, we review the related literature. Section 3 describes the data and methodology. Section 4 presents the results and interpretations. Section 5 concludes.
2. Literature review (Summary of results of other studies on CAPM and APT.
The risk-return relationship in the stock market and the reaction of the stock returns to a variety of risk factors has been investigated by many scientists in the last decades.
There are two theories to quantify this relation between risks and returns which are the Capital Asset Pricing Model (CAPM) and the Arbitrage Pricing Model (APT). In both models, expected returns are linearly related to risk factors and risk premiums.
The literature using the single-factor model can be classified into two groups: papers that use unconditional single-factor models based on Sharpe, 1964, Lintner, 1965, Black, 1972 and Fama and MacBeth, 1973; and papers that use conditional single-factor models based on Pettengill, Sundaram and Mathur, 1995. On the other hand, papers that expand the set of risk factors to investigate the effect of macroeconomic variables (as systematic risk factors) on the stock return use unconditional multi-factor model such as the APT introduced by Ross, 1976.
Firstly , The CAPM is the basic model used to verify the effect of non-diversifiable risk (also known as systemic risk or market risk) on stock market returns, which was introduced by Treynor (1961, 1962) and Sharpe ,1964, who built upon Markowitz, 1952, developed further by Lintner, 1965; Mossin ,1966; Black, 1972 and extended by Fama and MacBeth, 1973. This model is a three-step portfolio approach which is a single-factor model that takes only one risk factor, the market risk, and does not consider other risk factors. The stock market risk is one of the systematic risk factors in the stock market which is not specific to a portfolio and cannot be eliminated by diversification. Ross 1976 tried to verify that market risk is not the only component that could measure the systematic risk of the stock returns. He extended the CAPM and created a multi-factor asset pricing model, Arbitrage Pricing Theory (APT), as an alternative to CAPM.
Secondly, The APT models a linear relationship between an asset expected return, market risk and other external risk factors such as macroeconomic factors which can have an effect on the asset returns. Chen, Roll and Ross, 1986 used Ross’s 1976 macroeconomic APT model and explored a set of economic state variables, such as inflation, market return and oil prices as systematic risk factors. They examined the relationship between these risk factors and the US stock returns and found a strong relationship between them. Their conclusion expresses that stock returns are exposed to systematic economic news.
Copyright© ISSN 1923-2993 Journal of Academic Finance (J.A.F.) N° 5 fall 2015 Thirdly, Pettengill, Sundaram and Mathur, 1995 found that when the realized return is used instead of the expected return to estimate the CAPM, the relationship between the risk parameters beta and the return must be conditional on the relationship between the realized market returns and the risk-free rate. They therefore introduced a conditional relationship between beta and the realized return as an alternative approach to that used by Fama and MacBeth, 1973. They determine whether the direction of the market is “up” or “down” based on the relationship between the realized market returns and the risk-free rate, and separate the “up” market from the “down” market to create a conditional relationship between risk factors and the realized return. Whether the market is up or down depends on the excess market return, which they defined as the difference between the market return and risk-free rate, is positive or negative. If the excess market return is positive, the stock market is “up”; if excess market return is negative, the stock market is “down”. When the excess market return (or premium) is positive, the relationship between beta and the return will be positive. On the other hand, if excess market return is negative, the investor will hold the risk-free asset, which has a low beta, and the relationship between beta and return will be negative. Thus, while the relationship between the expected returns and risk is always positive, the relationship between realized returns and risk can be either positive or negative depending on the market excess returns.
Several studies have used the APT approach to investigate the relationship between risk factors and stock return. Goriave, 2004 investigate the effect of two set of risk factors, fundamental and macroeconomic (oil, currency, etc.), on the 47 most liquid stocks traded on the major Russian stock exchange during the post-crisis period from 1999 to 2003 by using a multifactor model. His results show that the oil risk factor does offer a significant premium and from the two currency factors (dollar and Euro), the dollar appears to be much more a important risk factor than the Euro.
Tunali, 2010 analyzed the relationship between macroeconomic variables (exchange rate, gold price, international crude oil prices, etc.) and stock returns in the main Turkish stock market. He investigated this relationship within the Arbitrage Pricing Theory framework using a vector auto regression model for the period between January 2002 and August 2008 on a monthly basis. The results show that there is a long-run relationship between basic macroeconomic indicators of the Turkish economy and stock returns.
Izedonmi and Abdullahi, 2011 used monthly data to test the performance of the Arbitrage Pricing Theory (APT) on the Nigerian Stock Exchange (NSE) for the period 2000- 2004. They investigated the effect of inflation, exchange rate and market capitalization on 20 sectors of the Nigerian Stock
Exchange by using an ordinary least square model. They found that there are no significant effects of those variables on the stock return in Nigeria.
The CAPM (as a single-factor asset pricing model) and the APT (as a multi-factor asset pricing model) are useful and many empirical papers used them to estimate the unconditional relationship between risk factors and stock return, but there are some limitations (Pettengill, Sundaram and Mathur, 1995; Campbell and MacKinlay, 1997; Basher and Sadorsky, 2006). While theory predicts a trade-off between risk and ex ante expected returns, most empirical papers use the ex post realized returns instead of ex ante expected returns.
Isakov, 1999 followed the approach of Pettengill et al, 1995 and investigates the effect of beta on return in the Swiss stock market. He found that the relationship between beta and return is statistically significant and depends on the sign of the market. The findings show that beta is a good measure of risk.
Tang and Shum, 2003 examine the risk-return conditional relationship in international stock markets and found that it is significantly positive (negative) when the market excess returns are positive (negative).
Fletcher, 2000 examined the conditional relationship between beta and return in the stock market of 18 developed countries over the period 1970-1998. He found a significant positive relationship between beta and returns in up market and a significant negative relationship between beta and return in down market.
Hodoshima, Garza-Gomez, and Kunimura, 2000 investigated the conditional relationship in Japan’s stock market, and found that the conditional relationship between returns and beta is found to be a better fit in general when the market excess return is negative than when it is positive.
On the other hand, with Tang and Shum, 2003, it was recognized that stock returns are not-normally distributed. Their study was further extended to examine other statistical risk measures, such as skewness and kurtosis. Their findings showed that skewness but not kurtosis, plays a significant role in the pricing stock returns.
Refai, 2009 investigates the unconditional and conditional risk-return relationship in Jordan and rejects the unconditional relationship. He finds a positive relationship between beta and returns for all industries in up markets, and a negative relationship for a few industries in down markets.
Theriou et al, 2010 investigated the risk-return relationship in the Athens stock exchange during 1991-2002 by using a 2-step conditional model in up and down markets. They found that there is a
Copyright© ISSN 1923-2993 Journal of Academic Finance (J.A.F.) N° 5 fall 2015 significant positive relationship between risk and return in the up markets and a significant negative relationship in the down markets.
Sinaee and Moradi, 2010 examined the conditional risk-return relationship in the Tehran stock market during the period 2003 to 2005 in up and down markets. They also tested the effects of other stock return characteristics such as skewness and kurtosis on the return. They did not observe any difference between these two periods; except for the explanatory power of beta during the down market period. Their results also showed that skewness had an important effect on returns but kurtosis did not have significant relation with returns during the three years of the research period. Before the study of Sadorsky, 2006 all documents that investigated the conditional relationship between risk and return focused only on market risk and did not consider macroeconomic risks as risk factors. Basher and Sadorsky, 2006 investigated the reaction of the stock market returns to oil price risk using an international multifactor model that took into account conditional and unconditional risk factors such as market risk, oil price risk, exchange rate risk and three higher moments: total risk, skewness and kurtosis. The results revealed strong evidence of sensitivity in stock market returns to oil price risk.
3. Data and Method
3.1. The data set
There are many potential candidates for risk factors introduced in literature (Fama and French, 1992; Chan et al, 1983; Goriaev, 2004). These factors are classified into two types: Fundamental factors, which are based on observed company characteristics, and systematic factors such as macroeconomic factors (Goriaev, 2004).
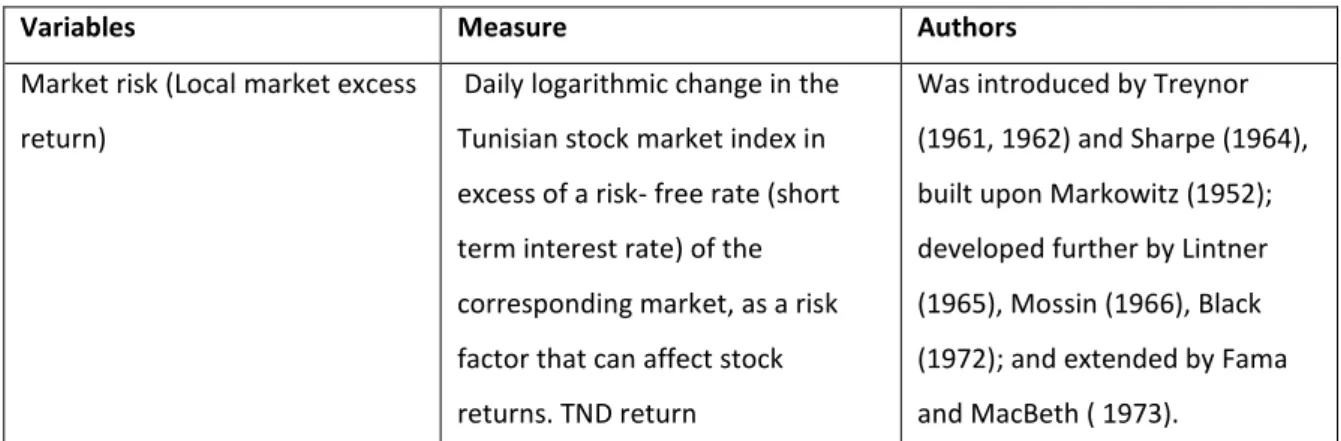
Table 1: Risk factors
Variables Measure Authors
Market risk (Local market excess return)
Daily logarithmic change in the Tunisian stock market index in excess of a risk- free rate (short term interest rate) of the corresponding market, as a risk factor that can affect stock returns. TND return
Was introduced by Treynor (1961, 1962) and Sharpe (1964), built upon Markowitz (1952); developed further by Lintner (1965), Mossin (1966), Black (1972); and extended by Fama and MacBeth ( 1973).
Ross (1976) tried to verify that market risk is not the only component that could measure the systematic risk of stock returns. He extended to CAPM and created a multi-factor asset pricing model.
Oil price risk
The daily logarithmic percent change in the oil world price (West Texas Intermediate crude oil spots price per barrel. TND return.
Papapetrou, 2001; Sadorsky, 2001; Hammoudeh and Aleisa, 2004; Hammoudeh, Dibooglu. and Aleisa, 2004; Hammoudeh and Huimin, 2005; El-Sharif, Brown, Burton, Nixon and Russell, 2005; Huang, Hwang and Peng, 2005; Sadorsky and Basher, 2006; Boyer and Filion, 2007; Henriques and Sadorsky, 2008; Park and Ratti, 2008; Basher, Haug and Sadorsky,
2011; Tunali 2010. Exchange rate risk Defined as the percent daily
logarithmic change in the real exchange rate TND/USA.
Gorive 2004, Tunali 2010?, Izedonmi and Abdullahi (2011).
Skewness Kurtosis
If the distribution of a stock return is not normal, two additional risk factors, skewness and kurtosis of return, can affect stock returns as well. We therefore include skewness and kurtosis as risk factors as well
Basher et Sadorksy 2006, Dimitrios Asteriou and Yuliya Bashmakova 2013, Harvey et Siddique (2000), Hwang et Satchell (1999)
Industries:
The sectors are included in the analysis are (automobile and equipment, banks, buildings, construction, industry, finance, consumer services, basic material and financial services). We use daily data from 01/01/2011 to 31/12/2014 on these 9 sectors from the Tunisian Stock Exchange. We choose to analyze this period both because it constitutes an important fourth period in the Tunisian Stock Exchange.
Currencies all our variables are measured in TND Tunisian.
Copyright© ISSN 1923-2993 Journal of Academic Finance (J.A.F.) N° 5 fall 2015
Equation 1: ( ) = ln (Oil(TND) /+ Oil(TND) /Oil(TND) )
Equation 2: ( ) = Oil(USD) /XR (TND/USD)
Where Oil (TND) is the oil price in t, expressed in TND Tunisian, Oil (USD) t is the oil price in t, expressed in US dollars, and XR (TND/USD) t is the TND/USD exchange rate at t, namely the value of D 1 Tunisian expressed in US. Dollars.
Upon substitution of Eq. 3 into Eq. 2, we get:
( ) =ln ( ! " (#$%)& ∗(" ()*%/#$% )&+, ! " (#$%)&+, ∗(" ()*%/#$%)& )= ln ( ! (#$%)& ! (#$%)&+, )+ln ( (" ()*%/#$% )&+, (" ()*%/#$%)& )+ln ( (" (#$%/)*% )& (" (#$%/)*%)&+, )
Where XR ( - / ) is the USD/TND exchange rate at t, namely the value of $1 TND. Expressed in Tunisian dinars and Oil R (USD) t is the price return in t, expressed in U.S. dollars. Furthermore, noting that the return from holding U.S. dollars, XR, is defined as follows:
XR. =ln ( /0 (123/453 )6
/0 (123/453)6+,
)
The final oil return decomposition becomes:
OilR(TND). = OilR(USD) + XR. 3.2. Methodology
The estimation approach in this paper involves two steps and combines the models introduced by Pettengill et al, 1995 and Basher and Sadorsky, 2006. In the first step, we estimate the coefficients beta on the risk factors for each industry in each year using Generalized Method of Moments (GMM) Approach to Times- Series regression (Hansen (1982). Who focus on the GMM because, in our opinion, it is the most important innovation in empirical methods in finance within the past fifteen years. The approach is simple, flexible, valid under general statistical assumptions, and often powerful in financial applications such as the estimation the linear asset pricing models (Cochrane 2005).
Moreover, I chose to use the GMM model because of their main advantage. Firstly, unlike the maximum likelihood (ML) estimator, the GMM estimator does not require the specification of the
joint distribution of the observed variables. Secondly, in the GMM model, the instrument vector does not need to be economically exogenous. The only requirement is that this vector be predetermined in the period when the agent forms his expectations. Both past and present values of the variables in the model can be used as instruments. Model estimator is consistent even when the instruments are not exogenous or when the disturbances are serially correlated.
7 = 8 + 9 :; +<=>7 + 9 ?@ + 7 +9 ABCD+EF8ℎ7 + 9 ?HI
+JKL7 + M 7 (1)
The daily return is computed with this (Theriou et al. 2010):
= log ( / ) (2)
Where i is the industry, t is the time, is the return of industry i stock on time t, c is a constant,
P is the excess market return, Q is the oil price return, R is the real exchange rate return, and
9 is the reaction of industry i stock’s return to risk factor X in time t.
Obviously, 9 , βT and 9W are estimated coefficients denoting the market beta, the oil price
beta and the exchange beta. This coefficient is estimated by GMM Model.
In the second step, a pooled data set consisting of the stock returns and the risk factor betas for each industry from equation (1) using GMM data estimation. Equation 3 is an unconditional relationship between return and risk factors.
=XY+X:; 9 :; + X ?@ 9 ?@ +XABCD 9 ABCD +M (3)
Where 9 is the coefficient estimated from the first step for each industry in time t.
To test for a conditional relationship between returns and betas dummy variables are created and the following equations are estimated as suggested by Pettengill et al, 1995:
=XY+X:; ZY I {<=> >0}9 :; + X:; [Y I {<=> <0}9 :; +XQ !ZY I { >0}9 ! + X ![Y I
{ <0}9 ! +XABCDZY I {EF8ℎ >0}9 ABCD+ XA(\][Y I {EF8ℎ <0}9 ABCD + +M (4)
Where I is dummy variable that is equal to 1 when market returns are positive (up market) and 0 otherwise (down market). The other dummy variables are similarly defined for each risk factor. The inclusion of higher moments (skewness and kurtosis) of stock returns is justified when stock returns are not normally distributed. Harvey and Siddique, 2000 suggest that investors care about the skewness of their portfolio. Investors may also care about kurtosis (Bekaert, Erb, Harvey and
Copyright© ISSN 1923-2993 Journal of Academic Finance (J.A.F.) N° 5 fall 2015 Viskanta, 1988; Bekaert and Harvey 1997. The study by Scott and Horvath, 1980 analytically showed that rational risk adverse investors prefer odd statistical moments of stock returns like mean and skewness, but dislike even statistical moments like variance and kurtosis. In the case of skewness, investors will accept smaller returns for positive skewness but demand higher returns for negative skewness. In other words, risk adverse investors should prefer portfolios that are skewed to the right and dislike portfolios that are skewed to the left. Kurtosis, the fourth moments of asset returns is interesting to study because kurtosis can be related to the variance of the variance and thus be used to check on the specification of the variance dynamics. Following Equations. (5) and (6), the unconditional and conditional relationship between realized returns and risk incorporating higher moments (skewness and kurtosis), respectively, can be specified by Equations (7) and (8).
=XY+X:; 9 :; + X ?@ 9 ?@ +XABCD 9 ABCD +X?HI 9
?HI
+ X^_ Kurtd. + M (5)
=XY+X:; ZY I {<=> >0}9 :; + X:; [Y I {<=> <0}9 :; +XQ !ZY I { >0}9 ! + X ![Y I
{ <0}9 ! +XABCDZY I {EF8ℎ >0}9 ABCD+ XA(\][Y I {EF8ℎ <0}9 ABCD +X?HIZY I {JKL >0}9 ?HI +
X?HI[Y I {JKL <0}9 ?HI + X^_ I {<=> >0}Kurtd. + X^_ I {<=> <0}Kurtd. +M (6)
=XY+X:; 9 :; + X ?@ 9 ?@ +XABCD 9 ABCD +X?HI 9
?HI
+ X$;R Skewd. + M (7)
=XY+X:; ZY I {<=> >0}9 :; + X:; [Y I {<=> <0}9 :; +XQ !ZY I { >0}9 ! + X ![Y I
{ <0}9 ! +XABCDZY I {EF8ℎ >0}9
ABCD+ XA(\][Y I {EF8ℎ <0}9 ABCD +X?HIZY I {JKL >0}9
?HI
+
X?HI[Y I {JKL <0}9 ?HI + X$;R I {<=> >0}Skewd. + X$;R I {<=> <0}Skewd. +M (8)
Where Skewd.and Kurtd. are, respectively, industry i’s relative skewness and kurtosis coefficients risk
factors. As mentioned, the study in this paper 2011 – 2014 was a volatile period of the Tunisia stock market. Moreover, the summary statistics in Table 1 show that the returns of most industries demonstrate skewness and the returns of all industries show high kurtosis. We therefore also estimate unconditional and conditional models which include skewness and kurtosis as additional factors. Apriori, it is expected that XBZY(XB[Y) each have positive (negative) signs. Symmetry between up and down markets can be tested from the hypothesis that XBZY+XB[Y= 0 versus the alternative, XBZY+XB[Y#0. The importance of additional risk factors (such as skewness or kurtosis)
can be studied by adding additional risk factor to equations 5, 6, 7 and 8. 4. Empirical results
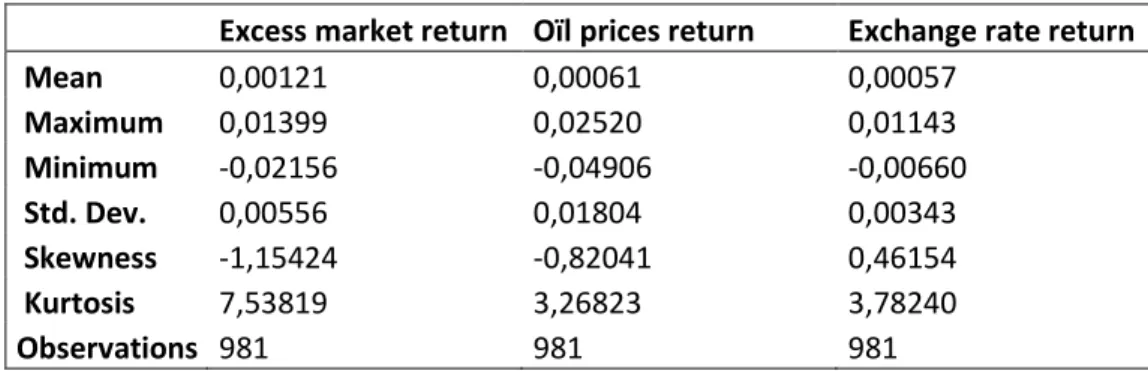
Table 2: daily risk factors statistics.
Excess market return Oïl prices return Exchange rate return
Mean 0,00121 0,00061 0,00057 Maximum 0,01399 0,02520 0,01143 Minimum -0,02156 -0,04906 -0,00660 Std. Dev. 0,00556 0,01804 0,00343 Skewness -1,15424 -0,82041 0,46154 Kurtosis 7,53819 3,26823 3,78240 Observations 981 981 981
The average daily returns is small (0,00121 ; 0,00061 ; 0,00057) in comparison to its standard deviation (0,00556 ; 0,01804 ; 0,00343). It is important to realize that the period of time under study, 2011 to 2014, was a very volatile period for the Tunisia stock market (the political situation does not allow for a stable framework in the economy and finance). In addition, I observe that the returns oil price was characterized by the highest standard deviation of 0, 01804, so the volatility of oil prices was the biggest one among all the series of returns under consideration. By against, the lowest standard deviation occurs for stock market 0, 00556 returns and for exchange rate returns 0, 00343. This might be due to the fact that the returns of those two variables are derived from well diversified inputs.
Table 3: Summary statistics of daily industry stock returns.
Sectors Banks Building Const Aut-Eq Finance Industry Basic-Ma Fin ser Cons ser Mean -0,0002 0,0000 -0,0001 -0,0037 -0,0002 -0,0002 0,0003 0,0007 -0,0021 Median -0,0012 -0,0012 -0,0011 -0,0056 -0,0008 -0,0014 -0,0031 0,0007 -0,0012 Maximum 0,0120 0,0366 0,0153 0,0212 0,0111 0,0311 0,0360 0,0232 0,0145 Minimum -0,0118 -0,0180 -0,0179 -0,0238 -0,0101 -0,0174 -0,0126 -0,0178 -0,0182 Std. Dev. 0,0050 0,0096 0,0079 0,0116 0,0045 0,0083 0,0115 0,0068 0,0056 Skewness 0,3423 1,1058 -0,1639 0,3667 0,1612 1,0120 1,6307 0,4502 -0,1157 Kurtosis 3,2841 5,9842 2,7688 1,9596 2,9724 5,9149 5,2729 4,9357 4,2564 Unit ro test 0,00 0,00 0,00 0,00 0,00 0,00 0,00 0,00 0,00
Descriptive statistics for the stock returns of all the industries considered are reported in table 3. This table also reports the p-value from a unit root test for each return, results of which show stationarity for all the returns.
According to table 3, the stocks for industry sector have the highest daily financial services sectors return (0,0007) and the consumer services sector have the lowest average return (-0, 0021).The standard deviation of the stock return for each group indicates the amount of risk. The building sector has the highest standard deviation (0, 0096), and therefore the highest risk. This industry also
Copyright© ISSN 1923-2993 Journal of Academic Finance (J.A.F.) N° 5 fall 2015 has the lowest average return so; contrary the theory, there does not appear to be a positive relationship between risk and return for this industry. The finance sector with the lowest value of standard deviation (0, 0045), and therefore the lowest risk, is the total market return (-0, 0002). This confirms one of the most important capital markets principles: Reducing the level of risk in the context of building a stock portfolio by the method of diversification.
The returns of the stocks for some industries demonstrate skewness and those for all industries show high kurtosis. We therefore include skewness and kurtosis as additional risk factors in our analysis. Table 4: Correlation matrix of daily sector returns, world market returns, oil price returns, and exchange rate returns
The correlation matrix of the data (to check the existence and strength of the relationship among the analyzed sectors and variables) is displayed in Table 3. Observation of the results reveals that each sector return is positively correlated with the Tunindex (excess market return). The strongest correlation appeared between excess market return and banking sector (0,905).
Table 4 shows that the highest correlation coefficients is registered for the automotive and equipment (0,236), while the negative correlation and the lowest is between the returns of the Bank Buil Cons
Equi
p Finance Indust Base ma Fin ser Cons ser Exch ret Oil ret Mak ret Bank 1,00 0 Buil 0,09 9 1,00 0 Cons 0,32 5 0,26 3 1,000 Equip 0,27 6 0,11 1 0,313 1,000 Finance 0,96 8 0,16 8 0,425 0,302 1,000 Industrie 0,11 3 0,99 4 0,267 0,148 0,188 1,000 Base mat 0,09 5 0,08 7 0,208 0,238 0,136 0,089 1,000 Finan ser 0,34 7 0,11 3 0,520 0,222 0,495 0,141 0,316 1,000 Consu serv 0,60 5 0,07 7 0,345 0,327 0,617 0,091 0,232 0,431 1,000 Exch return -0,01 1 0,02 6 0,000 -0,343 -0,028 0,005 0,076 -0,252 0,171 1,000 Oil return -0,01 9 -0,07 3 0,048 -0,236 0,016 -0,083 0,057 0,091 0,304 0,376 1,000 Mark retur 0,83 4 0,42 5 0,675 0,380 0,905 0,444 0,293 0,595 0,689 0,002 0,046 1,000
industrial sector and WTI oil prices (-0.083), which explains that the higher the oil price increases over the industry sectors in Tunisia is exposed to risk. It might be due to the fact that Industry sector is one of the biggest consumers of oil.
Regarding the correlation between sectors returns, we noticed that the building sectors have a very high positive correlation of 0,994 with the industry sector. This means that, industry and building sector known as secondary sector. Also, the building sector and public-works includes all design and construction activities for public and private buildings.
We note that in the majority of cases, the correlation coefficients between oil prices and stock market returns of the different sectors are very close, which means that the indices are moving in the same direction and interpret new information in the same way.
** Result of first-step beta estimation
In the first step, a daily time series regressions model is used to estimate the coefficients β on each risk factor for each sector in each year using Generalized Method of Moments (GMM) Approach to Times-Series regression. Table 5 reports the means and standard deviations by sectors of the betas estimated for eparch sectors and year.
Table .5: Reports the means and standard deviations by industry of the betas estimated for each industry.
Sectors Market Market Beta Oil price Beta Exchange rate Beta
Banks sectors 1,0231 -0,0259 0,0132 (0,1198) (0,0222) (0,0698) Construction sectors 1,3065 0,0131 -0,0156 (0,1438) (0,0651) (0,1645) Equip 1,0996 -0,1416 -0,7746 (0,3548) (0,1578) (0,3707) Finance sectors 1,0066 -0,0066 -0,0245 (0,0746) (0,0153) (0,0528) Industries sectors 0,9108 -0,0849 0,0966 (0,3894) (0,0904) (0,2290)
Basic material sectors 0,8259 0,0168 0,1846
(0,3738) (0,0859) (0,2849) Finance services sectors 0,9749 0,1051 -0,5067 (-0,5067) (0,0445) (0,1637) Consumer services sectors 0,9380 0,1150 0,1034 (0,1274) (0,0497) (0,0956) Building sectors 1,0111 -0,0953 0,1559 (0,4560) (0,1056) (0,2795)
Copyright© ISSN 1923-2993 Journal of Academic Finance (J.A.F.) N° 5 fall 2015 Note: Standard deviations in parentheses. A daily time series regression model is used to estimate
the coefficients beta on each risk factor for each industry in each year using Generalized Method of Moments (GMM) Approach to Times- Series regression. This table reports the means and standard deviations by industry of the betas estimated for each industry and year.
**Results of second-step risk-return estimation
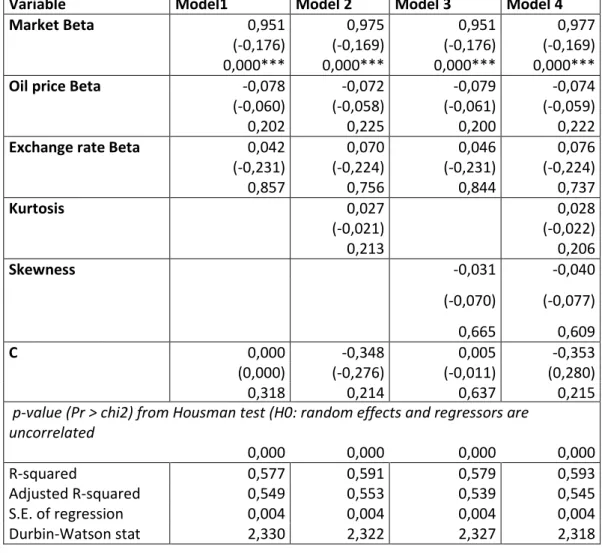
Table 5: Results of unconditional model for the top 9 industries by market Tunisia.
Variable Model1 Model 2 Model 3 Model 4
Market Beta 0,951 0,975 0,951 0,977
(-0,176) (-0,169) (-0,176) (-0,169) 0,000*** 0,000*** 0,000*** 0,000***
Oil price Beta -0,078 -0,072 -0,079 -0,074
(-0,060) (-0,058) (-0,061) (-0,059)
0,202 0,225 0,200 0,222
Exchange rate Beta 0,042 0,070 0,046 0,076
(-0,231) (-0,224) (-0,231) (-0,224) 0,857 0,756 0,844 0,737 Kurtosis 0,027 0,028 (-0,021) (-0,022) 0,213 0,206 Skewness -0,031 -0,040 (-0,070) (-0,077) 0,665 0,609 C 0,000 -0,348 0,005 -0,353 (0,000) (-0,276) (-0,011) (0,280) 0,318 0,214 0,637 0,215
p-value (Pr > chi2) from Housman test (H0: random effects and regressors are uncorrelated 0,000 0,000 0,000 0,000 R-squared 0,577 0,591 0,579 0,593 Adjusted R-squared 0,549 0,553 0,539 0,545 S.E. of regression 0,004 0,004 0,004 0,004 Durbin-Watson stat 2,330 2,322 2,327 2,318
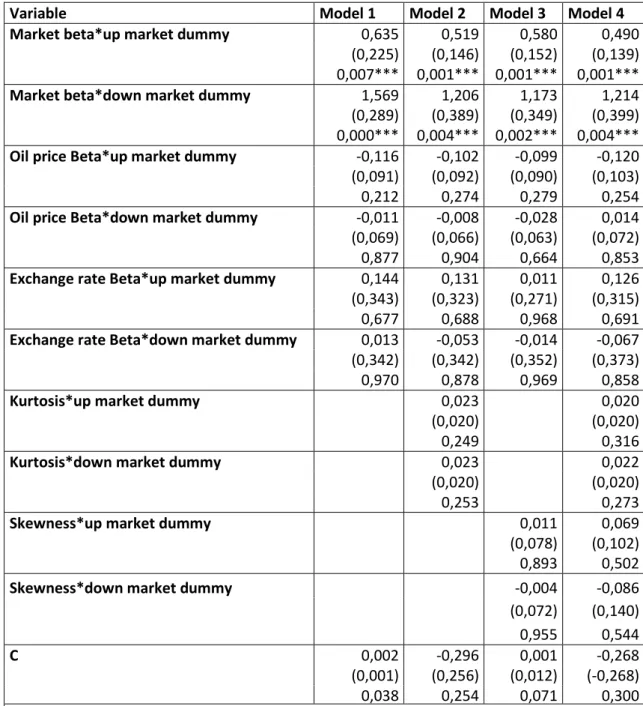
Table 6: Results of conditional model for the top 9industries by Tunisia market
Variable Model 1 Model 2 Model 3 Model 4
Market beta*up market dummy 0,635 0,519 0,580 0,490
(0,225) (0,146) (0,152) (0,139) 0,007*** 0,001*** 0,001*** 0,001***
Market beta*down market dummy 1,569 1,206 1,173 1,214
(0,289) (0,389) (0,349) (0,399) 0,000*** 0,004*** 0,002*** 0,004***
Oil price Beta*up market dummy -0,116 -0,102 -0,099 -0,120
(0,091) (0,092) (0,090) (0,103)
0,212 0,274 0,279 0,254
Oil price Beta*down market dummy -0,011 -0,008 -0,028 0,014
(0,069) (0,066) (0,063) (0,072)
0,877 0,904 0,664 0,853
Exchange rate Beta*up market dummy 0,144 0,131 0,011 0,126
(0,343) (0,323) (0,271) (0,315)
0,677 0,688 0,968 0,691
Exchange rate Beta*down market dummy 0,013 -0,053 -0,014 -0,067 (0,342) (0,342) (0,352) (0,373)
0,970 0,878 0,969 0,858
Kurtosis*up market dummy 0,023 0,020
(0,020) (0,020)
0,249 0,316
Kurtosis*down market dummy 0,023 0,022
(0,020) (0,020)
0,253 0,273
Skewness*up market dummy 0,011 0,069
(0,078) (0,102) 0,893 0,502
Skewness*down market dummy -0,004 -0,086
(0,072) (0,140) 0,955 0,544 C 0,002 -0,296 0,001 -0,268 (0,001) (0,256) (0,012) (-0,268) 0,038 0,254 0,071 0,300
p-value (Pr > chi2) from Housman test (H0: random effects and regressors are uncorrelated
0,000 0,000 0,000 0,000
Adjusted R-squared 0,576 0,594 0,578 0,581
S.E. of regression 0,004 0,003 0,004 0,004
Durbin-Watson stat 2,461 2,380 2,337 2,321
Copyright© ISSN 1923-2993 Journal of Academic Finance (J.A.F.) N° 5 fall 2015 We estimate 4 unconditional and 4 conditional models. Model 1 investigates the relationship between the returns and all the systematic risk factors (market risk, oil price risk and exchange rate risk). Models 2 and 3 add skewness and kurtosis as additional risk factors, respectively, to model 1. Model 4 evaluates the relationship between all risk factors and returns. We estimate each of these 4models for both unconditional and conditional cases. Housman test, 1978 allowed us to conclude the presence of a fixed but not random individual effect. From (table 6) the null hypothesis of random effects is rejected therefore the alternative hypothesis for all conditional and conditional models is accepted. We find that the majority of sectors are influenced by macroeconomic risks. The results of this GMM method are displayed in Tables 5 and 6.
The impact of the market risk on the stock returns
According to the results of our conditional models, the risk-return relationship is the same in up and down markets, and both of them are statistically significant at a 1% level. This result shows that Tunisian markets with higher risk receive higher return compared to markets with lower risk. This result is consistent with the theory which displays a positive (or direct) tradeoff between market risk and returns in the financial field.
This result is inconsistent with the studies of Pettengill et al, 1995; Isakov, 1999; Fletcher, 2000; Basher, Sadorsky, Tang, and Shum, 2003 who found a positive relationship in the up market and a negative relationship in the down market. However, this result is consistent with that of Sinaee and Moradi, 2010, who found a positive relationship between market risk and returns in both the up and down markets during the period 2003 to 2005.
The impact of the announcement of the macroeconomic variables on the stock returns
The impact of the real macroeconomic variables on the aggregate equity returns has been difficult to establish, perhaps, because their effects are neither linear nor time-invariant. According to Flannery and Protopapadakis , 2002, the macroeconomic variables are originally of systematic risk because the change of the macroeconomic aggregates simultaneously affects the cash flows of the firms and influences the risk-adjusted discount rate.
The coefficient on oil price risk is negative in the unconditional models and for the up market in the conditional models. The reaction of the stock returns to the oil price volatility depends on the kind of company. This coefficient is also negative in all conditional models in the up markets but is not significantly. This result is found in previous studies, such as those of Jones and Kaul, 1996; Sadorksy, 1999; Huang and al, 1996; El-Sharif and al, 2005; Naifar and Al Dohaiman, 2013; Chang and Yu, 2013. Since oil constitutes a substantial input for many industries, its price increase leads to
economic crises by creating significant cost-push inflation. Consequently, a rise in oil prices acts as an inflation tax and increases risk and uncertainty which seriously affects the stock price and reduces wealth.
The estimated coefficient on the exchange rate risk factor (TND/USD) is positive in all unconditional models. This coefficient also is positive in all conditional models in up market and statistically insignificant. But the results demonstrate a significant negative relationship between exchange rate and return in the down market. According to our results, the positive effect of the exchange rate on stock returns outweighs its negative effect in the up market but the opposite in the case in the down market. This relation indicates that the increase of the dinar TND/USD over the past two years lead to more export and also improve the competition position of Tunisian producers and thus can have a positive effect on stock returns. On the other hand, an increase in the exchange rate can also increase the costs to industries by increasing the costs of the inputs they import, thus decreasing their profit and stock return.
The results of the regression between stock returns skewness and kurtosis
Table (5, 6) presents the results of adding skewness and kurtosis to the risk-return relationship. The unconditional model (table 5) shows that skewness is negatively related to returns, but the relationship is insignificant. The conditional model (table 6) also shows a weak relationship where the estimated coefficients of skewness are statistically insignificant for both up and down markets. The overwhelming rejection of skewness indicates that it does not play a significant role in Tunisia markets ‘daily asset returns. This result is inconsistent with Tang and Shum, 2003 documented that skewness is a significant factor for conditional returns in up and down markets in most of the developed capital market they studied.
The results for the unconditional model (table 5) show that the coefficient of kurtosis is positive and not significant. In contrast, the results of the conditional model (table 6) show that kurtosis is positively related to realize returns in up and down markets, but the estimated coefficient is not significant. These results are similar to Tang and Shum, 2003 who also find that kurtosis does not play a significant role in pricing asset returns.
5. Summary and conclusion
The relation between real macroeconomic variables and stock market activity has been investigated by many scientists in the last decades but most of the publications have concentrated on the developed countries. In this paper, we investigate the tradeoff between (oil price risk, exchange rate risk) and the Tunisian stock market returns. The tradeoff between risk and return is
Copyright© ISSN 1923-2993 Journal of Academic Finance (J.A.F.) N° 5 fall 2015 one the central issues faced by individuals who trade equities, manage portfolios, or engage in capital budgeting. These individuals generally prefer investments with high return to risk characteristics.
The results of our paper show that this concern is particularly relevant in sector equity returns in Tunisia .where there are many sources of risk. These risks include the exchange rates risk and the oil price risk that will adversely affect the value of a company’s assets, liabilities or expected future cash flow.
In the same context, several authors, such as, Chen et al (1986) and Sadorksy (2001) investigate the tradeoffs between equity returns and macroeconomic variables, such as, industrial production, inflation, interest rates, consumption and oil prices.
A national multi-factor model that allows for conditional and unconditional risk factors to investigate the relationship between these types of risk and stock market returns during the Tunisian revolution. The estimated coefficient for the inflation is positive and statistically significant suggesting that the risk inflation is indeed an important factor in determining stock returns and that increase in the index of consumer prices causes increases in the stock market returns.
Regarding additional risk the relationship between skewness and return is only statistically significant in the conditional models in the up market, where it is negative. Similarly, the kurtosis-return relationship is only significant in the up market, where it is positive. Therefore there are conditional relationships between skewness and kurtosis with stock returns only in the up stock market. Moreover, the average value of Tunisia consumer prices index over the period 2011-2014 is about 124, 88. Its minimum value is equal 110, 40 to and its maximum value is equal to 152, 40. The increase in inflation in this period is one of the implications of the Tunisia revolution of 14 January 2011. In this context, the inflation rate appears to have some relation with returns stock market. (Goodhart and Smith, 1985; Graham and all, 2003; Adam et al, 2004).
References
Basher, S.A., & Sadorsky, P. (2006). Oil price risk and emerging stock markets. Global Finance Journal, 17, 224-251.
Black, F. (1972). Capital market equilibrium with restricted borrowing. Journal of Business 45, 445−455.
Campbell, J.Y., Lo, A., & MacKinlay, A. C. (1997). The econometrics of financial markets. Chan, K.C., Chen, N., & Hsieh, D.A. (1983). An explanatory investigation of the firm size Economic School. Journal of Financial Econometrics, vol.14, pp.451-471.
Cochrane, John H. (2005). Asset Pricing. Princeton, NJ: Princeton University Press. Constantinides,
El-Sharif, I., Brown, D., Burton, B., Nixon, B., & Russell, A. (2005). Evidence on the nature and extent of the relationship between oil prices and equity values in the UK. Energy Econmics. 27, 819-830.
Erb, Claude B., Campbell R. Harvey., & Tadas E. Viskanta. (1997). Demographics and International Investment. European Journal of Finance 5, 202−212.
Fama, E., & MacBeth, J. D. (1973). Risk, return and equilibrium: Empirical tests. Journal of Finance and Economics 57.
Flannery, M.J. and A.A. Protopapadakis. (2002) .Macroeconomic factors do influence aggregate stock returns,” The Review of Financial Studies, Vol. 15, No. 3, pp. 751-782. Fletcher, J. (2000). On the conditional relationship between beta and return in international stock returns. International Review of Financial Analysis 9, 235−245.
Goodhart, Charles A. E., & Richard G. Smith. (1985). The impact of News on Financial Markets in the United Kingdom.Journal of Money, and Banking 507-11.
Goriave, Alexei. (2004). Risk factors in the Russian stock market. Working Paper.
Harvey, C.R., &A. Siddique. (2000). Unconditional Skewness in Asset Pricing Tests. Journal of Finance 55: 1263-1295.
Hodoshima, J., Garza-Gomez, X., & Kunimura, M. (2000). Cross-sectional regression analysis of return and beta in Japan. Journal of Economics and Business 52, 515−533.
Huang, R., Masulis, R.W., & Stoll, H.R. .(1996). Energy Shocks and Financial Markets. Journal of Futures Markets. 16(1), 1-27.
Isakov, D. (1999). Is beta still alive? Conclusive evidence from the Swiss stock market.
Izedonmi, P.F., & Abdullahi, I.B. (2011). The effects of macroeconomic factors on the Nigerian stock returns: A sectoral approach. Global Journal of Management and Business Research, Volume 11 Issue 7 Version 1.0
Copyright© ISSN 1923-2993 Journal of Academic Finance (J.A.F.) N° 5 fall 2015 Jones, C.M., & Kaul, G. (1996). Oil and the Stock Market. Journal of Finance. 51(2), 463- 491. Lintner, J. (1965). The valuation of risky assets and the selection of risky investments in stock. Naifar, N., & Al Dohaiman, M.S. (2013). Nonlinear analysis among crude oil prices, stock markets’ return and macroeconomic variables. International Review of Economics and Finance. 27, 416-431.
Pettengill, G., Sundaram, S., & Mathur, I. (1995). The conditional relation between beta and return. Journal of Financial and Quantitative Analysis 30, 101−116.
Rekaert, Geert., Campbell R., Harvey., and Robin L. Lumsdaine. (1997). Dating the Integration of World Capital Markets. Working paper, Stanford University and Duke University.
Ross, S. (1976). The arbitrage theory of capital asset pricing. Journal of Economic Theory 13, 341−360.
Sadorsky, P.(1999). Oil price shocks and stock market activity. Energy Econmics. 21, 449- 469. Sharpe, W. (1964). Capital asset prices: A theory of market equilibrium under conditions of risk. Journal of Finance 19, 425−442.
Sinaee, Hasanali., & Moradi, Habibolah. (2010). Risk-Return Relationship in Iran Stock Market. International Research Journal of Finance and Economics, ISSN 1450-2887 Issue 41. Tang, G.Y.N., & Shum, W.C. (2003). The relationships between unsystematic risk, skewness and stock returns during up and down markets. International Business Review 12, 523−541. Theriou, Nikolaos.G., Aggelidis, Vassilios.P., Maditinos, Dimitrios.I., & Sevic, Zeljko. (2010). Testing the relation between beta and returns in the Athens Stock Exchange. Managerial Finance, Vol. 36 No. 12, 2010, pp. 1043-1056.
Tunali, Halil. (2010). The Analysis of Relationships between Macroeconomic Factors and Stock Returns: Evidence from Turkey Using VAR Model. International Research Journal of Finance and Economics 57.