HAL Id: hal-00329433
https://hal.archives-ouvertes.fr/hal-00329433
Submitted on 14 Oct 2005
HAL is a multi-disciplinary open access
archive for the deposit and dissemination of
sci-entific research documents, whether they are
pub-lished or not. The documents may come from
teaching and research institutions in France or
abroad, or from public or private research centers.
L’archive ouverte pluridisciplinaire HAL, est
destinée au dépôt et à la diffusion de documents
scientifiques de niveau recherche, publiés ou non,
émanant des établissements d’enseignement et de
recherche français ou étrangers, des laboratoires
publics ou privés.
flux transfer event near the cusp
R. C. Fear, A. N. Fazakerley, C. J. Owen, A. D. Lahiff, E. A. Lucek, A.
Balogh, L. M. Kistler, C. Mouikis, H. Rème
To cite this version:
R. C. Fear, A. N. Fazakerley, C. J. Owen, A. D. Lahiff, E. A. Lucek, et al.. Cluster observations
of bounday layer structure and a flux transfer event near the cusp. Annales Geophysicae, European
Geosciences Union, 2005, 23 (7), pp.2605-2620. �hal-00329433�
SRef-ID: 1432-0576/ag/2005-23-2605 © European Geosciences Union 2005
Annales
Geophysicae
Cluster observations of bounday layer structure and a flux transfer
event near the cusp
R. C. Fear1, A. N. Fazakerley1, C. J. Owen1, A. D. Lahiff1, E. A. Lucek2, A. Balogh2, L. M. Kistler3, C. Mouikis3, and H. R`eme4
1Mullard Space Science Laboratory, University College London, Holmbury St. Mary, Dorking, Surrey, RH5 6NT, UK 2Blackett Laboratory, Imperial College of Science, Technology and Medicine, Prince Consort Road, London, SW7 2BZ, UK 3Space Science Center, University of New Hampshire, Durham, NH 03824, USA
4CESR/CNRS, 9 Avenue du Colonel Roche, B.P. 4346, F-31028, Toulouse Cedex 4, France
Received: 15 February 2005 – Revised: 12 July 2005 – Accepted: 22 July 2005 – Published: 14 October 2005
Abstract. On the 25th January 2002 between 10:00 and
12:00 UT, the four Cluster spacecraft passed through the northern high-latitude cusp, the dayside magnetosphere and into the magnetosheath in a linear formation. In the magnetosphere the PEACE electron spectrometers on the four spacecraft all observed a series of transient bursts of magnetosheath-like plasma, but without bipolar magnetic signatures in the magnetopause normal component as might be expected if the plasma had been injected by transient re-connection (flux transfer events – FTEs). Reordering the data using the magnetopause transition parameter reveals that these plasma observations, the related variations in the mag-netic field and the balance of magmag-netic and thermal gas pres-sures are consistent with transient entries into a stable high-latitude boundary layer structure. However, once some of the spacecraft entered the magnetosheath, FTE signatures were observed outside the magnetopause at the same time as some of the boundary layer entries occurred at the other spacecraft inside. Thus, (a) the lack of a bipolar BNsignature is
incon-sistent with the traditional picture of a magnetospheric FTE, and (b) the cause of the observed entry of the spacecraft into the boundary layer (pressure pulse or passing magnetosheath FTE) can only be determined by spacecraft observations in the magnetosheath.
Keywords. Magnetospheric physics (Magnetopause, cusp
and bondary layers; Solar wind- magnetosphere interactions; Magnetosheath)
1 Introduction
Russell and Elphic (1978, 1979) studied dayside low-latitude magnetopause crossings in magnetometer data using bound-Correspondence to: R. C. Fear
ary normal coordinates, defined such that the unit vector ˆN
was the outward pointing local magnetopause normal vector (deduced by minimum variance analysis, taking the vector product of the magnetosheath and magnetospheric fields, or from a model), ˆL lay parallel to the unperturbed
magneto-spheric field (i.e. points approximately northwards) and ˆM
completed the right-handed set ( ˆL- ˆM- ˆN ), directed
dawn-wards. This coordinate system revealed examples of a sig-nature consisting of a bipolar variation in the ˆN component
of the magnetic field, with simultaneous variations of the components in the ˆL and ˆM directions. In their dataset, the
bipolar signature was always in the same sense (positive then negative), and the BLand BMvariations were not consistent
with ordinary crossings of the magnetopause. These signa-tures were observed both in the magnetosphere and the mag-netosheath; Russell and Elphic named them “flux transfer events” or FTEs, interpreting them as signatures of impulsive reconnection (earlier observations of “flux erosion events” by Haerendel et al. (1978) were shown to be FTEs by Rijnbeek and Cowley (1984)).
The Russell and Elphic model was that of two open, kinked flux tubes formed by reconnection near the subso-lar point, propagating tailward (one northward, one south-ward) in response to solar wind drag and changing form to reduce the magnetic tension (j ×B force). Neighbouring un-reconnected field lines would drape over the flux tubes caus-ing the bipolar BN signature and characteristic deviations
in BL and BM as the FTE moved past the spacecraft (see
also Farrugia et al., 1987a). Paschmann et al. (1982) also observed a bipolar BN signature when the reconnected flux
tube was crossed; this was explained by a helicity which was added to the Russell and Elphic (1978, 1979) flux tube model by Sonnerup (1987). Field-aligned plasma populations origi-nating from the opposite side of the magnetopause have been observed within FTEs (Daly et al., 1981; Paschmann et al., 1982) consistent with reconnection. The latter study noted
the following “essential” features observed in all low-latitude FTEs: a southward component in the undisturbed magne-tosheath magnetic field (negative BL); a bipolar variation in
BN; an enhanced magnetic field strength |B| and an
imbal-ance in the total pressure (pgas+B2/2µ0) within both the flux
tube and the draping region, countered by the tension in the draped magnetospheric/magnetosheath field lines. Simulta-neous observations of the same FTEs on both sides of the magnetopause were first presented by Farrugia et al. (1987b). Other reconnection models of FTEs have been proposed that are consistent with these observations (multiple X-line: Lee and Fu, 1985; bursty reconnection: Southwood et al., 1988 and Scholer, 1988).
Two alternative groups of models were also proposed to explain the observed bipolar signatures. The first hypothesis was that impulsive plasma penetration (Lemaire and Roth, 1978; Lemaire et al., 1979; Heikkila, 1982) could be a source mechanism for FTE signatures. These authors argued that impulsive penetration may occur when a plasma element in the solar wind has a larger momentum density compared with the background plasma. However, Smith and Curran (1990) showed that there is a poor correlation between FTE occur-rence and the magnetopause penetration parameter derived by Lemaire et al. (1979), compared with the correlation be-tween FTEs and magnetosheath BL (although they referred
to the magnetosheath magnetic field as the interplanetary magnetic field [IMF]). This suggests that impulsive penetra-tion is not the main cause of FTEs, although it continues to be discussed as a possible source (e.g. Lundin et al., 2003). Furthermore, Owen and Cowley (1991) disputed the mecha-nism proposed by Heikkila (1982).
The other group of models were proposed by Sibeck and colleagues (Sibeck et al., 1989; Sibeck, 1990, 1992; Sck-opke, 1991). They suggested that magnetopause waves gen-erate signatures similar to those observed by Russell and Elphic (1978) as spacecraft undergo successive crossings of near-magnetopause regions (magnetosphere, low-latitude boundary layer (LLBL), energetic particle layer, plasma de-pletion layer, magnetosheath). They argued that the mag-netopause waves are caused by brief, impulsive, large-amplitude solar wind pressure pulses, and that the passing wave causes a bipolar normal signature. This model has been the cause of much debate (e.g. Lanzerotti, 1989; Elphic, 1990; Lockwood, 1991; Smith and Owen, 1992; Kawano et al., 1992; Elphic et al., 1994; Song et al., 1994, 1996; Sibeck and Newell, 1995, 1996; Sanny et al., 1996). In particular, Kawano et al. (1992) studied bipolar signature events near the low-latitude magnetopause, and concluded that long (BNpeak-to-peak time-scale >90 s) events showed
no correlation with the interplanetary magnetic field (IMF) or AE index and occurred over a wide range of McIlwain L-shells. These were attributed to solar wind pressure vari-ations. However short (time-scale <90 s) events tended to be observed near the magnetopause during periods of south-ward IMF and high AE index, and were ascribed to reconnec-tion. Sanny et al. (1996) used similar criteria to identify bipo-lar “transient events” observed by the AMPTE CCE satellite
across a wider range of radial distances from the Earth. The occurrence of these transient events was not correlated with the IMF orientation, and they were interpreted as signatures of solar wind/foreshock pressure pulses. However, six events were observed with a duration shorter than 90 s; five of these were observed when the IMF was either steadily southward or fluctuated between northward and southward, consistent with the findings of Kawano et al. (1992).
Other studies, such as Hapgood and Lockwood (1995) and Lockwood and Hapgood (1998), have used the mag-netopause transition parameter (τ , Bryant and Riggs, 1989; Hapgood and Bryant, 1990, 1992) to distinguish between dif-ferent FTE models. τ is a proxy for the relative position of a spacecraft within boundary layers between the magneto-sphere and the magnetosheath. It is derived by fitting a curve to plasma temperature and density moments (usually electron data), projecting each data point onto the nearest point of the best-fit curve and measuring the distance along the curve to each projection. These values are then normalised to extreme values on the curve, with 0 equating to the coolest/densest part of the magnetosheath and 100 the hottest/rarest point observed in the magnetosphere. The behaviour of τ has been shown to be consistent with passage of the spacecraft across magnetic field lines which have been reconnected for differ-ent lengths of time by Lockwood and Hapgood (1997).
The four-spacecraft Cluster mission allows the first multi-point observations in three dimensions. Cluster observa-tions of high-latitude FTEs have been reported by Bosqued et al. (2001), Owen et al. (2001), Vontrat-Reberac et al. (2003) and Thompson et al. (2004). Lockwood et al. (2001) presented a study of a series of transient entries into the LLBL observed by Cluster during an interval of predom-inantly northward IMF. These entries correlated well with IMF clock angle (arctan(BY/BZ)) swings to near 90◦,
typi-cally from less than 60◦, and with ground-based observations of transient reconnection signatures. Their occurrence was consistent with sub-solar reconnection (i.e. between mag-netosheath and closed magnetospheric magnetic field lines, which may occur away from the equatorial plane). Whilst the events occurring in the “exterior” boundary layer (the newly-opened, northward-pointing magnetic field lines at the magnetopause) exhibited a weak bipolar BNsignature, those
events occurring in the “interior” boundary layer (southward-pointing field lines on the edge of the interior magnetic cusp) did not have a bipolar BNsignature at all. Lockwood argued
that this was because the bipolar signature is caused (un-der the Southwood/Scholer bursty reconnection model) by a pressure imbalance. In the interior boundary layer events, the enhanced magnetic pressure inside the events was ap-proximately cancelled by a decrease in the ion gas pressure, whereas there was a net pressure increase in the exterior boundary layer events.
So far, the reconnection/pressure pulse debate has largely been constrained to lower latitudes. In this paper, we ex-tend it to higher latitudes by presenting an analysis of two events from the 25th January 2002. In both cases, spacecraft within the magnetosphere observed signatures consistent
with moving deeper into the observed boundary layer struc-ture; however in the second example some spacecraft were in the magnetosheath, and they observed traditional FTE signa-tures.
2 Observations
2.1 Spacecraft location
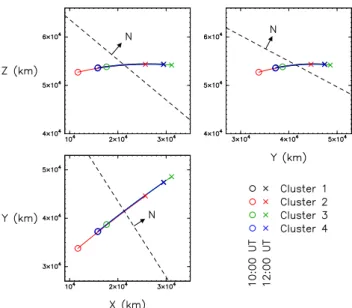
On the 25th January 2002 the four Cluster spacecraft made an outbound pass through the northern magnetosphere into the magnetosheath at 15 h MLT. Figure 1 shows the posi-tions and relative separaposi-tions of the spacecraft in GSE dur-ing the period of interest between 10:00 UT (denoted by cir-cles) and 12:00 UT (denoted by crosses). A period of orbital manoeuvres was under way, so as the spacecraft crossed the magnetopause they were in a linear formation, rather than a tetrahedron. Cluster 3 led the formation, followed by Clus-ters 1 and 4 (which were relatively close together) and then Cluster 2.
2.2 Instrumentation and data
In this paper, spectra and moments from the Plasma Electron and Current Experiment (PEACE: Fazakerley et al., 20051; Johnstone et al., 1997) on the four spacecraft are shown, to-gether with supporting data from the Flux Gate Magnetome-ter (FGM: Balogh et al., 2001), the ClusMagnetome-ter Ion SpectromeMagnetome-ter (CIS: R`eme et al., 2001) and the Electric Field and Wave experiment (EFW: Gustafsson et al., 2001). IMF data are provided by the ACE MAG instrument (Smith et al., 1998), lagged by a delay time calculated from the solar wind veloc-ity observed by the ACE SWEPAM instrument (McComas et al., 1998).
The PEACE instruments on all four spacecraft consist of two detectors: the High Energy Electron Analyser and the Low Energy Electron Analyser (HEEA and LEEA). On-board temperature and density moments, calculated using on-board calibrations and not corrected for the spacecraft po-tential, were telemetered by all four spacecraft during the period of interest. These are used in this paper as they are available at spin resolution (4 s), rather than ground moments derived from 3D reduced energy/angular resolution distribu-tions (3DR) which are not available at spin resolution on Clusters 1, 3 and 4 during this interval. The effect of the nzero spacecraft potential is minimised by the use of on-board moments from HEEA only (which covers the energy range 30 eV to 26 keV).
All proton velocities and pressures presented are derived from CIS-CODIF ground moments, which are available at spin resolution from Cluster 4, and lower time resolution from Clusters 1 and 3. A dead-time correction has been ap-plied to the Cluster 1 and 4 moments to improve accuracy in the magnetosheath, however this correction could not be applied to the data from Cluster 3 due to degradation of one
1Manuscript in preparation.
Fig. 1. The Cluster orbit traces from 10:00 UT (marked by
cir-cles) to 12:00 UT (crosses) on the 25th January 2002, in the GSE Z−X (top left), Z−Y (top right) and Y−X (bottom left) planes. The traces are plotted in the standard Cluster colours shown in the key. As this interval occurred during a period of spacecraft manoeuvres, the spacecraft were oriented in a string formation as they crossed the magnetopause (between 10:41 and 11:12 UT), rather than a tetrahe-dron. The normal vector ˆN derived in Sect. 2.5 has also been pro-jected into the plane of each panel, along with the corresponding magnetopause plane.
quadrant of the sensor. Data are unavailable from CIS on Cluster 2. Magnetic field data from the FGM instrument are presented at both 5 Hz and spin resolution (0.25 Hz). The spacecraft potential measured by EFW is over-plotted on all spectrograms at spin resolution.
2.3 Data overview
Figure 2 shows two hours of Cluster and ACE data (10:00– 12:00 UT). The top four panels are spectrograms of the dif-ferential energy flux (DEF) measured by PEACE, averaged over all pitch angles. We shall refer to this as the omnidirec-tional DEF. The spacecraft potential is over-plotted on each panel as a red line; all electrons below the equivalent energy are caused by photoionisation of the spacecraft, and are not part of the natural plasma environment. The next four panels show the magnetic field observed by FGM (in standard Clus-ter colours: ClusClus-ter 1 in black, ClusClus-ter 2 in red, ClusClus-ter 3 in green and Cluster 4 in blue), and the ACE MAG instru-ment (magenta line, lagged by a calculated propagation time of 75 min and multiplied by a factor of four) in GSE coor-dinates. The Cluster FGM and ACE MAG data are shown at 4 and 16 s resolution respectively. The penultimate panel contains the total pressure observed by Clusters 1 and 4, and the bottom panel shows τ for each spacecraft, which will be discussed in detail in Sect. 2.4. The magnetopause crossing of each satellite is indicated by a red vertical line (Cluster 3: 10:41 UT, Clusters 1 and 4: 10:46 UT, and Cluster 2: final
Fig. 2. An overview of the PEACE and FGM data and the interplanetary magnetic field (IMF). The top four panels are spectrograms of
the omnidirectional electron differential energy flux observed by the PEACE instruments on Clusters 1, 2, 3 and 4. The next four panels show the magnetic field observed by FGM on Clusters 1, 2, 3 and 4 in black, red, green and blue respectively in GSE coordinates. The magnetic field observed by ACE, lagged by 75 min and multiplied by a factor of 4, is over-plotted in magenta. The penultimate panel is the total pressure observed at Clusters 1 and 4 (calculated from the magnetic pressure and the thermal pressure derived from on-board CODIF moments corrected for dead-time effects). The bottom panel shows the magnetopause transition parameter calculated from the PEACE on-board moments. The magnetopause crossings made by Clusters 3, 1 and 4, and 2 are shown by red lines at 10:41, 10:46 and 11:12 UT respectively, and the events analysed at 10:08 and 10:52 UT are indicated by magenta boxes.
crossing at 11:12 UT), and two periods that will be the sub-ject of detailed discussion in this paper are highlighted by magenta boxes (centred on 10:08 and 10:52 UT).
Between 10:00 and 12:00 UT the lagged interplanetary magnetic field (IMF) was generally stable and dominated in the GSE clock-angle (Y−Z) plane by a negative BY
compo-nent, whilst BZvaried between slightly positive and slightly
negative values. The clock angle was close to −90◦ until 11:20 UT (not shown). At the start of the interval shown, the PEACE instrument on each spacecraft observed a mag-netospheric electron plasma distribution (hot, with relatively low differential energy fluxes) and FGM observed a rela-tively steady magnetic field of ∼(−10, −20, 0)GSEnT. The
near-zero component of the magnetospheric magnetic field in ZGSE indicates that the spacecraft were located near the
lip of the magnetospheric cusp, where BZchanges from
pos-itive to negative on closed magnetospheric field lines. In the time leading up to the magnetopause crossings, intervals of plasma of magnetosheath energy (∼100 eV) and differential energy fluxes of up to 10−3 ergs (cm2s sr eV)−1 were
ob-served from time to time, some of which corresponded to a rotation of the magnetic field which was enhanced in −BX
and +BZ, and diminished in BY. At the times indicated, the
spacecraft crossed the magnetopause into the magnetosheath. Magnetopause crossings (defined as the final entry into the magnetosheath on each spacecraft) were determined by the appearance of an isotropic electron distribution at ∼100 eV and a magnetic field rotation to ∼(20, −20, 0)GSEnT. The
Cluster 2 crossing is not as clear in the PEACE spectro-gram, however the magnetic field data suggest that there were four transient magnetosheath entries, with the last occur-ring at 11:12 UT. The differential energy fluxes observed at
∼100 eV in the magnetosheath were higher than the plasma at similar energies inside the magnetopause. A magnetic field reorientation, corresponding to a similar reorientation ob-served upstream by ACE, was obob-served in the magnetosheath between 11:15 and 11:30 UT. The total pressure remained relatively steady at ∼1 nPa until the magnetosheath magnetic field reorientation occurred at 11:15 UT.
2.4 Magnetopause transition parameter
To aid discussion of this interval, the magnetopause transi-tion parameter (τ ) is introduced. It was calculated by fit-ting a curve to a log10−log10 scatter plot of electron den-sity against perpendicular electron temperature using all data points between 10:00 and 12:00 UT for each spacecraft (Fig. 3). Detailed inter-calibration between electron mo-ments from different spacecraft would have required the use of ground moments, which would have lowered the time res-olution on Clusters 1, 3 and 4. Since all that is required to define a relative position of a spacecraft within the bound-ary layer is a consistent variation in the density and temper-ature, on-board moments from HEEA were used. As the data had not been inter-calibrated, best fit curves (4th or-der polynomials shown in Fig. 3) were calculated separately for each spacecraft. All data points were projected onto the
Fig. 3. A scatter plot of the perpendicular electron temperature
against the electron density derived from PEACE on-board mo-ments calculated by the HEEA sensor. A fourth order polynomial curve was fitted to the points from each spacecraft (shown). Each data point was projected onto the curve corresponding to the same spacecraft, and the distance along the curve to each projected point was converted to the transition parameter by normalising to extreme values.
nearest point of the corresponding curve. Extreme projected points were defined as 0 (in the magnetosheath) and 100 (in the magnetosphere) and the distance of each projected point along the curve, normalised to the extrema, was defined as τ . The resulting transition parameter values for each spacecraft are plotted in the bottom panel of Fig. 2. The general trend in τ was a decrease until each spacecraft crossed the mag-netopause, after which it stayed low. A brief enhancement of τ within the magnetosheath coincided with the magnetic field reorientation observed between 11:15 and 11:30 UT, as a region of solar wind with lower density arrived. After 11:30 UT, a region of solar wind at higher pressure arrived, which was associated with lower values of τ .
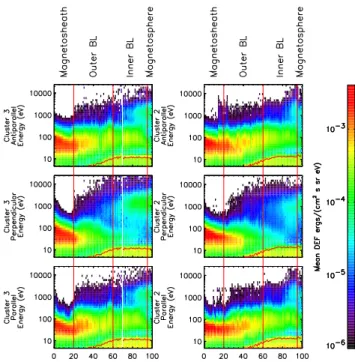
Figure 4 shows spectrograms of the PEACE HEEA and LEEA data from the first and last spacecraft to cross the magnetopause (Cluster 3 and Cluster 2, which crossed the magnetopause thirty minutes apart) in the antiparallel, per-pendicular and parallel pitch angle bins ordered by transition parameter rather than time. The data have been rebinned to pitch angles on the ground. The mean spacecraft potential is superposed as a red line. The general similarity of the two datasets in this figure demonstrates the persistence of a sta-ble boundary structure for at least 30 min in the region of interest, although data from short-lived events can also be identified within this plot. Although the variations in this structure are generally gradual, four general regions can be distinguished.
Fig. 4. Electron spectrograms from the first (Cluster 3, left-hand
column) and last (Cluster 2, right-hand column) spacecraft to cross the magnetopause, reordered by transition parameter. Although the transition parameter values were derived from on-board moments from the HEEA sensors, both HEEA and LEEA data are shown in each panel. The top, middle and bottom rows show electron fluxes antiparallel, perpendicular and parallel to the magnetic field respec-tively. A stable boundary layer structure exists since there is little change between the structure observed at Clusters 3 and 2; similar structure is also observed by Clusters 1 and 4. The regions identi-fied in Sect. 2.4 (magnetosphere, inner and outer boundary layers and magnetosheath) are labelled, separated by red vertical lines.
The first region, in the range 95<τ <100, was the magne-tospheric dayside plasma-sheet (seen most clearly on Clus-ter 3). Here there was a relatively low DEF of order 10−5ergs (cm2s sr eV)−1 at energies just above the space-craft potential, and ∼10−4 ergs (cm2s sr eV)−1 just above 1 keV (but strongest perpendicular to the magnetic field), which is consistent with a trapped electron population.
Between 60<τ <95 the second region was observed, which we refer to as the inner boundary layer. At lower values of τ within this layer, a low energy (10–100 eV) bi-directional field-aligned population of higher DEF replaced the 1 keV population. The DEF increased, and the anisotropy decreased, with decreasing τ . The trapped (90◦) 1 keV pop-ulation disappeared between τ values of 70 and 80.
A lower energy perpendicular population similar to that in the field-aligned directions appeared in the range 20<τ <60. The mean spacecraft potential also decreased in this region as τ decreased, consistent with an increase in plasma density towards magnetosheath values. The lack of magnetospheric electrons suggests that this plasma was on open magnetic field lines; we call this the outer boundary layer.
For τ <20 the low-energy DEF reached its peak of
∼10−3ergs (cm2s sr eV)−1 and the distribution became
isotropic. This was the fourth region: the magnetosheath. These regions were identified according to the value of τ , which is indicative of the time elapsed since the magnetic field line was reconnected. The terms “inner” and “outer” boundary layer are used in a completely different sense from the interior and exterior layers of Lockwood et al. (2001) which was based on BZ, and hence position relative to the
cusp in a GSE X−Y plane. Due to motion of the magne-topause as the spacecraft approach and pass the mean po-sition of the boundary layer, the layer was encountered by each spacecraft intermittently at first and then steadily until the magnetosheath was entered (Fig. 2).
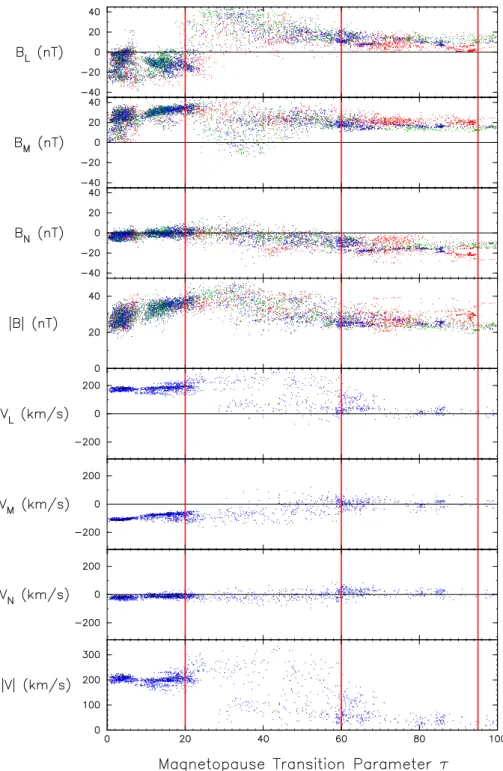
Figure 5 shows the variation of the magnetic field and CODIF proton parameters in GSE coordinates as a function of corresponding transition parameter. The top four panels show the variation with τ of the magnetic field on all four spacecraft. Data from the period of magnetosheath magnetic field reorientation (11:15 to 11:30 UT on Clusters 1, 3 and 4; 11:16 to 11:32 UT on Cluster 2) have not been plotted in these panels. Whilst a magnetospheric magnetic field orien-tation was maintained to values as low as τ =60, in the region 20<τ <60 (the outer boundary layer) a magnetic field orien-tation was observed which differed from both the magneto-sphere and the magnetosheath. There was a wider spread of values in this region, but the magnitude of the magnetic field was generally stronger than either side, the BXand BZ
com-ponents were enhanced, and BY decreased. At τ =20 there
was a clear reversal in BXand BZ, and at smaller values of
τ there was a consistently Sunward, duskward and generally southward magnetic field orientation.
The next four panels of Fig. 5 show the dead-time corrected CODIF ground moment velocities from Clus-ters 1 and 4 (which were located relatively close together). The moments from Cluster 3 are not shown, as without the dead-time correction they are not believed to be accurate in the magnetosheath; therefore it is hard to show long-lasting stability in the trends of the proton data. In most of the inner boundary layer (60<τ <95), there was little deviation from the low bulk velocities observed in the magnetosphere. In the outer boundary layer ion velocities were generally either similar to those observed in the magnetosheath or to those in the magnetosphere. However there were some enhance-ments, predominantly in −VX, which increased the
magni-tude of the ion velocity to greater than that of the magne-tosheath flow.
The next three panels show the thermal pressure calculated from the dead-time corrected CODIF density and tempera-ture ground moments, the magnetic pressure and the sum of these two pressures. There was a decrease in the gas pressure and an increase in the magnetic pressure in the outer bound-ary layer compared with the inner boundbound-ary layer and the magnetosphere. Although temporal variations caused a slight spread in values of total pressure (±0.2 nPa above τ =40;
±0.5 nPa in the region 18<τ <40), the mean value of the to-tal pressure remained close to 1 nPa down to τ =18. Pressure
Fig. 5. The magnetic field, proton velocity and gas, magnetic and total pressure reordered by transition parameter. The proton velocities
and pressure are derived from CODIF ground moments which have undergone a dead-time correction to improve their accuracy in the magnetosheath. A period of magnetosheath magnetic field reorientation (11:15 to 11:30 UT on Clusters 1, 3 and 4; 11:16 to 11:32 UT on Cluster 2) has been removed from the top four panels. The boundaries between the magnetosheath, outer and inner boundary layers and magnetosphere are indicated by vertical lines.
balance was thus conserved both between the magnetosphere and boundary layers, and the boundary layers and the mag-netosheath. After the spacecraft entered the magnetosheath, the total pressure varied more in time (penultimate panel of Fig. 2). This caused a larger spread of values and a general increase in PTotalcorresponding to τ <18.
2.5 Boundary normal coordinates
In order to examine the two events highlighted in Fig. 2, a boundary normal coordinate system was established. The linear formation of the spacecraft precluded using a multi-spacecraft timing analysis as a means of establishing the
normal vector ˆN . Therefore ˆN =(0.592, 0.378, 0.712)GSE
was determined by minimum variance analysis (MVA) per-formed using high resolution FGM data across the field ro-tation between the outer boundary layer and the magne-tosheath. Current magnetopause models do not account for any effect of the cusp on the magnetopause shape, but
ˆ
N compares with a Roelof and Sibeck (1993) model
nor-mal of (0.664, 0.437, 0.607)GSE. The angle between these
two normal vectors is 8◦. A variety of intervals were used for MVA on all four spacecraft; the largest intermedi-ate/minimum eigenvalue ratio achieved was 4.3, using Clus-ter 2 data from 10:50 to 11:50 UT. Whilst this ratio is low, and the interval is wide, the MVA frame which was de-rived did succeed in producing a minimum component of the magnetosheath magnetic field that is close to zero. This is consistent with magnetic field draping over the magne-topause. L=(−0.715, −0.161, 0.680)ˆ GSE was determined
by projecting the Earth’s magnetic dipole onto the plane de-fined by ˆN , and ˆM=(0.372, −0.912, 0.175)GSE was
con-structed from the vector product of ˆN and ˆL.
The magnetic field and proton velocity variations are plot-ted in boundary normal coordinates as a function of τ in Fig. 6, in the same format as Fig. 5. As in Fig. 5, the period of magnetosheath magnetic field reorientation (between 11:15 and 11:30 UT on Clusters 1, 3 and 4; 11:16 to 11:32 UT on Cluster 2) has not been plotted in the magnetic field panels. Since the boundary normal coordinate frame was derived at the entry into the magnetosheath, which does not equate to the exit from the magnetosphere-proper, the magnetospheric magnetic field (τ ∼100) was not entirely in BL; there was
also a positive BM component, and BN was negative as the
proximity to the cusp meant that the magnetospheric mag-netic field lines observed earlier in the interval had a com-ponent away from the magnetopause plane derived from the later crossings. As the spacecraft passed through the outer boundary layer, BL was enhanced, BM increased slightly
but sometimes became negative, and BN decreased
(some-times becoming positive). On entry into the magnetosheath,
BLreversed direction and became negative, BMwas positive
and BNdecreased back to zero. As is expected, the
magne-tosheath flow was almost entirely in the magnetopause plane (positive VLand negative VM). As noted in the discussion of
Fig. 5, the boundary layer flow velocity vectors were gener-ally either similar to the flow observed in the magnetosheath or similar to the negligible flow in the magnetosphere. How-ever, there were some enhancements in VLand VMand there
were a significant number of positive VMvalues in the range
τ >30.
2.6 Case studies
2.6.1 10:08 UT Boundary layer entry
The first event we shall consider occurred at 10:08 UT. Plasma and magnetic field data for the period 10:00– 10:15 UT are shown in Fig. 7. Electron spectra from Clus-ter 3 in the directions antiparallel, perpendicular and parallel
to the magnetic field are plotted in the top three panels. The data in these plots have been rebinned to pitch angles on the ground. Rebinning improves the reliability of the binning, since on-board binning uses on-board calibrations and bases the pitch angle on a single magnetic field value measured during the spin beforehand. If the magnetic field changes during a spin, the pitch angle selection may miss some pitch angles, usually near the magnetic field direction, as is seen near 10:08 UT. These spectrograms are followed by equiv-alent spectrograms for Cluster 4; the magnetic field did not change rapidly enough to cause problems for on-board pitch angle selection, therefore on-board binning has been used for this spacecraft. The spacecraft potential is again superposed onto each spectrogram.
The next four panels display the CODIF proton veloc-ity moments in boundary normal coordinates. These panels are followed by the high resolution magnetic field data in boundary normal coordinates, the thermal gas pressure de-rived from CODIF ground moments, the magnetic and total pressures and the transition parameter. Moments from Clus-ters 1 and 4 are dead-time corrected.
Between 10:00 and 10:02 UT, all four spacecraft were near the magnetosphere/inner boundary layer transition. In this interval the magnetic field maintained a steady value of ∼(10, 10, −20)LMNnT, the proton velocity was low and
the transition parameter was approximately 90. Between 10:02 and 10:05 UT, the transition parameter on Clus-ters 1, 3 and 4 dropped to 70. A higher DEF, of order 5×10⁻⁴ergs (cm2s sr eV)−1, of field-aligned plasma below 100 eV is evident in the spectrograms, and there was a drop-out of 1 keV plasma in the field-aligned directions. Similar spectra and values of τ were observed by Clusters 1, 3 and 4 at 10:12 UT and after 10:14 UT. These signatures are con-sistent with the behaviour in Figs. 4, 5 and 6; at these val-ues of τ , the spacecraft were well inside the inner bound-ary layer: no variation was observed in the magnetic field or bulk velocities, but bidirectional field-aligned plasma was observed.
At 10:08 UT, a deeper transient entry into the boundary layer structure was observed. τ dropped to 30 on Cluster 3 and 40 on Clusters 1 and 4. Cluster 3 observed an even higher DEF burst of low energy plasma in the field-aligned direc-tions (∼4×10⁻³ ergs (cm2s sr eV)−1). There was also an enhancement of plasma at this energy in the perpendicular direction, but only to a DEF of 10−4 ergs (cm2s sr eV)−1, and a drop-out in electrons in all directions at ∼1 keV. Clus-ter 4 observed a DEF of ∼5×10⁻⁴ ergs (cm2s sr eV)−1 in
the field-aligned directions, with little enhancement in the perpendicular direction. At the same time, Clusters 1 and 4 observed an increase in BL, BM and |B|, whilst BN
de-creased to nearly zero. The Cluster 3 magnetic field followed this behaviour at edges of the signatures (before 10:07.45 and after 10:08.30 UT), but between these times BM turned
negative. There was an enhancement in the plasma veloc-ity on these three spacecraft, which largely consisted of an increase in VM, but within this enhancement VM observed
Fig. 6. The magnetic field and proton velocity data shown in Fig. 5, rotated into boundary normal coordinates.
brief VL enhancement on Cluster 3. The proton gas
pres-sure on all three spacecraft decreased, but this was approx-imately cancelled by an enhancement of the magnetic pres-sure. The signature observed by Cluster 3 was preceded by a VN flow of ∼−80 km/s and followed by a positive VN
flow of ∼60 km/s; this bipolar flow pattern had a duration of 5 min.
Cluster 2 also observed a small increase in DEF below 100 eV at 10:08 UT (seen in Fig. 2), and a drop in τ . How-ever, these occurred slightly before those observed at
ter 3. Since Cluster 3 observed these signatures before Clus-ters 1 and 4 and the variation of τ on Cluster 2 between 10:00 and 10:15 UT is not closely related to the variation ob-served by the other spacecraft, we believe this to be a separate boundary layer entry (Cluster 2 was separated from Cluster 1 by 4400 km in ˆN , and by 3300 km tangential to the
magne-topause plane).
The BL, BM and magnetic pressure enhancements, along
with the decrease in BN and the gas pressure observed on all
Fig. 7. Plasma and magnetic field data from the 10:08 UT event. The top six panels show electron spectrograms from Cluster 3 (closest to the
magnetopause) and Cluster 4 antiparallel, perpendicular and parallel to the magnetic field. The Cluster 4 spectrograms show data resulting from on-board binning of measured data into pitch angle bins, but the Cluster 3 data have been rebinned on the ground, which results in some data gaps. The next four panels show the proton ground moment velocities in boundary normal coordinates for Clusters 1 and 4 (corrected for dead-time effects) and Cluster 3. They are followed by the high resolution magnetic field observed on each spacecraft (also in boundary normal coordinates), and the gas, magnetic and total pressures. The final panel shows the transition parameter calculated for each spacecraft.
Figs. 5 and 6 associated with the observed decrease to τ ≈40. Although at this value of τ the mean value of VLincreased
and VM became negative, there was a considerable spread
and the observed values on Clusters 1 and 4 at 10:08 UT did not lie significantly outside this distribution. The BM and
VM reversals observed by Cluster 3 are also consistent with
the slightly deeper penetration into the outer boundary layer made by Cluster 3, due to its position closer to the magne-topause than the other spacecraft.
2.6.2 10:52 UT Flux transfer event
After 10:30 UT the lagged IMF was generally southwards, although still dominated in the clock-angle plane by BY
(Fig. 2). Following their respective magnetopause cross-ings, all four spacecraft observed traditional magnetosheath FTE signatures (bipolar BN signatures and an enhancement
in the magnetic field strength; some exhibited a heating of magnetosheath electron plasma, proton velocity enhance-ments and an increase in the transition parameter). Four such FTEs, identified by their characteristic bipolar BN
vari-ations, are shown in Fig. 8, at 10:48.45, 10:49.40, 10:50.20 and 10:51.50 UT.
Figure 8, showing the period from 10:48 to 10:56 UT, adopts the same format as Fig. 7 except that spectrograms from Clusters 4 and 2 are shown. On-board binning is again used for Cluster 4 data since the magnetic field did not change rapidly enough to affect the on-board pitch angle se-lection, but Cluster 2 data have been rebinned to pitch angles on the ground. By this time, Clusters 1, 3 and 4 had crossed into the magnetosheath; the Cluster 3 CODIF moments are not shown since they are unreliable in the magnetosheath without the dead-time correction. These three spacecraft ob-served a cool, dense, isotropic electron plasma distribution typical of the magnetosheath, corresponding to a low transi-tion parameter. The plasma flow directransi-tion was in +VL and
−VM, and the magnetosheath magnetic field was
predomi-nantly along BM. Just before 10:52 UT, Clusters 1 and 4
ob-served a “standard” polarity (outward then Earthward) bipo-lar BN FTE signature in the terminology of Rijnbeek et al.
(1984), which is shown in more detail in Fig. 9. An en-hancement in BL, a decrease in BM and a small velocity
en-hancement were also observed. There was a small increase in the total pressure observed by these spacecraft due to an in-crease in the magnetic pressure, and the PEACE instruments observed accelerated magnetosheath electrons in the direc-tion parallel to the magnetic field (Cluster 1 spectrogram not shown).
By this time Cluster 3 (the leading spacecraft in the for-mation – see Fig. 1) was too far from the magnetopause to observe a change in the electron spectra, but a small amount of bipolar BNdraping was observed. On the other side of the
magnetopause, Cluster 2 observed similar, although shorter lived, signatures to those which had been observed by Clus-ter 3 at 10:08 UT (see Fig. 9). As the transition parameClus-ter dropped from around 80 to approximately 40, a burst of low energy field-aligned plasma was observed with a DEF of
or-der 10−3ergs (cm2s sr eV)−1. The DEF of plasma in the
per-pendicular direction also rose to ∼10−4ergs (cm2s sr eV)−1.
The magnetic field strength also increased, but this increase consisted of an enhancement in BL, a decrease in BM and a
unipolar positive excursion in BN.
3 Discussion
Using the transition parameter introduced by Hapgood and Bryant (1992), we have analysed the basic characteristics of the cusp/magnetopause boundary layers observed by Cluster on the 25th January 2002, when Cluster passed from within the magnetosphere near the rim of the cusp (i.e. where the magnetospheric magnetic field turns from positive to nega-tive GSE BZ) via a boundary layer to the magnetosheath.
This analysis revealed an inner boundary layer with bi-directional low-energy plasma and a similar magnetic field orientation to the magnetosphere, and an outer layer with lower anisotropy and higher fluxes than in the inner boundary layer, and with a different magnetic field orientation from the magnetosphere and magnetosheath. Details of the boundary layer structure are expected to relate to the age of the recon-nected field lines. Further work on this topic is planned, but the presence of trapped electrons (90◦ pitch angle) in part of the inner boundary layer (τ >∼80) suggests that this re-gion was on closed magnetic field lines or field lines from which not all magnetospheric electrons had had time to es-cape. The electron distribution in the inner boundary layer, and similarity of the inner boundary layer magnetic field to that of the magnetosphere-proper are consistent with being magnetically connected to the LLBL/cleft. The electron dis-tribution of the outer boundary layer is consistent with the exterior cusp (heated electrons at a lower DEF than in the magnetosheath, without a trapped population). Furthermore, we suggest that the occurrence of plasma with bulk veloci-ties greater than the magnetosheath (Figs. 5 and 6) implies that sub-solar reconnection was occurring. This is consistent with the negative IMF BZ excursions which were occurring
at the same time (Fig. 2).
In this context, we examined an example event at 10:08 UT, where the Cluster spacecraft penetrated the bound-ary layers to three different depths: Cluster 3 entered deeper than Clusters 1 and 4 and observed a greater DEF enhance-ment in all directions (largest in the field-aligned directions). Cluster 4 (and Cluster 1) only observed a significant increase in the field-aligned directions. All three spacecraft observed a positive enhancement in VM, BL and BM and a decrease
in BN (which became positive on Cluster 3); in addition,
Cluster 3 observed reversals in VMand BM. Cluster 2 made
a shallower entry into the inner boundary layer around this time, but since the variations in τ observed on this space-craft do not relate closely to those observed by the other three it is believed that this was caused separately. Therefore the scale size of these events was smaller than the separa-tion of Cluster 2 from Clusters 1 and 4 (4400 km in ˆN , and
Fig. 8. Plasma and magnetic field data from the 10:52 UT event. This figure follows the same layout as Fig. 7, except that spectrograms for
Clusters 4 and 2 are shown (Cluster 4 data use on-board pitch angle binning; Cluster 2 data have been rebinned on the ground). Cluster 3 moments are not shown as the lack of dead-time correction reduces their reliability in the magnetosheath. Four magnetosheath FTEs are identified by vertical red lines.
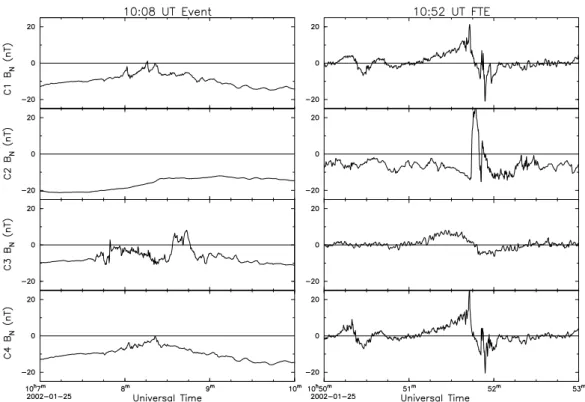
Fig. 9. The BNsignatures observed by the four Cluster spacecraft at 10:08 and 10:52 UT.
velocity components normal to the magnetopause observed by Cluster 3 before/after the magnetic field signatures show that there was an inward/outward bulk motion of the plasma with a duration of 5 min, but in the absence of observations in the magnetosheath and solar wind there is no conclusive evidence for whether this boundary layer entry was caused by a simple pressure pulse or if it had another cause, such as a passing FTE.
At 10:52 UT, the spacecraft in the magnetosheath (Clus-ters 1, 3 and 4) observed signatures which can be attributed to flux transfer events (bipolar BN signatures, field-aligned
acceleration of magnetosheath electrons, and an increase in the magnetic pressure). Cluster 2 was already in the inner boundary layer, but unlike earlier simultaneous observations of FTEs either side of the low-latitude magnetopause (e.g. Farrugia et al., 1987b), no bipolar BN signature was
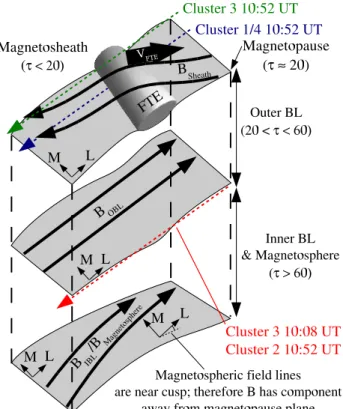
ob-served. At the low-latitude magnetopause, there is usually a simple rotation directly between the magnetospheric and magnetosheath magnetic fields. In the 10:52 UT event, a range of characteristics were observed which were consis-tent with moving deeper into the temporally stable boundary layer structure as the FTEs passed by (sketched in Fig. 10). In fact, few bipolar BN signatures occurred in the
magne-tosphere or within the boundary layer during this interval; they were first observed just before the spacecraft crossed the magnetopause. One explanation for the observed signatures might be that the velocity of the FTE has a strong component antiparallel to the magnetosheath magnetic field, producing a clear standard-polarity bipolar signature through draping of the magnetic field lines, but only a weak component along
the magnetic field directions observed by the spacecraft in the boundary layer/magnetosphere. However the best mea-sure we have of the velocity of the FTE is the peak perpen-dicular velocity, observed in the corrected CODIF moments at 10:51.55 UT, which is (239, −48, −15)LMNkm s−1(not
shown). The background magnetosheath and inner bound-ary layer magnetic fields, observed by Clusters 4 and 2 respectively at 10:51.20 UT, are (−7, 35, 3)LMNnT and
(16, 21, −7)LMNnT. These magnetic field vectors form
an-gles with the peak perpendicular velocity of 113◦ and 64◦ respectively; consequently the FTE has a stronger compo-nent of velocity along the background magnetic field in the inner boundary layer observed at Cluster 2 (107 km s−1) than
along the magnetosheath field (−95 km s−1). Hence the lack
of a bipolar BN signature at Cluster 2 does not appear to be
due to a weaker component of velocity along the magnetic field. Therefore it appears likely that local compression of the magnetosphere as the FTE passes by is sufficient to force Cluster 2 deeper into the boundary layer structure, but not sufficient to produce a bipolar signature that can be observed as far from the magnetopause as Cluster 2.
As Clusters 3 and 2 both observed effects of the FTE without entering the FTE itself, its diameter can be identi-fied as less than the separation of the two spacecraft along
ˆ
N (4800 km). This is consistent with low-latitude estimates
of ∼1 RE (Saunders et al., 1984). Other FTEs were
ob-served in the magnetosheath just before the 10:52 UT event (also highlighted in Fig. 8) for which there was either no sig-nature (10:48.45 and 10:50.20 UT) or where a less signifi-cant signature (10:49.40 UT) was present. These FTEs were
Fig. 10. A sketch of the boundary layer structure, and the
rela-tive paths of the spacecraft at 10:52 UT. Clusters 1 and 4 were in the magneosheath and passed through an FTE. Cluster 3 was also in the magnetosheath but further from the magnetopause and ob-served only field line draping. Cluster 2 was in the inner boundary layer, but entered the outer boundary layer as the FTE passed, lead-ing to characteristic plasma and magnetic field signatures, but with no bipolar BN signature. Cluster 2 observed similar signatures at 10:52 UT to those observed by Cluster 3 at 10:08 UT.
presumably smaller than the 10:52 UT event.
Lockwood et al. (2001) concluded that a bipolar BN
sig-nature was absent when an FTE was observed near the wall of the interior cusp (BZ<0). Our observations are similar to
their first “bipolar” signature; both were observed near the lip of the cusp, where BZ≈0 (Fig. 14, Lockwood et al., 2001).
Although we agree with their overall picture, we believe that the magnetic signature observed by Lockwood et al. (2001) was closer to those observed in the present study at 10:08 and 10:52 UT than to a traditional bipolar FTE signature. Our 10:52 UT event, with direct measurement of traditional mag-netosheath FTE signatures, confirms that these less orthodox boundary layer signatures are also caused by FTEs.
4 Conclusions
The magnetopause transition parameter was used to reorder plasma and magnetic field observations throughout this com-plicated interval. This procedure clarified the boundary layer structure. Although transitions within this structure were not generally sharp, we split this structure into four regions
(magnetosphere, an inner boundary layer, an outer bound-ary layer and the magnetosheath) and identified the magne-topause as the interface between the outer boundary layer and magnetosheath. After the outer three spacecraft had entered the magnetosheath, a series of FTEs was observed with clear plasma and bipolar BN signatures. At the same time as one
of these FTEs passed (10:52 UT), the spacecraft within the magnetopause observed signatures consistent with moving deeper into the boundary layer structure. Without the benefit of simultaneous magnetosheath observations, this signature would most likely not have been identified as being related to an FTE, as there was no bipolar BNvariation.
It is entirely possible that some of the earlier bound-ary layer entries (including 10:08 UT) observed by Clus-ters 1, 3 and 4 were due to passing FTEs forcing the boundary layer structure inwards, making it difficult to identify magne-tospheric FTEs at high latitudes. Contrary to the low-latitude debate, which concentrated on alternative explanations for the magnetic field and plasma observations attributed to tran-sient reconnection, this difficulty arises from the presence of the observed boundary layer structure.
Acknowledgements. The authors thank the PEACE, FGM, CIS and
EFW operations teams for their work on the Cluster data, and the ACE SWEPAM and MAG teams and ACE Science Center for pro-viding the ACE data. RCF was supported by a United Kingdom PPARC Studentship. We also thank the referee for helpful com-ments.
Topical Editor T. Pulkkinen thanks D. Sibeck for his help in evaluating this paper.
References
Balogh, A., Carr, C. M., Acu˜na, M. H., Dunlop, M. W., Beek, T. J., Brown, P., Fornac¸on, K. H., Georgescu, E., Glassmeier, K. H., Harris, J., Musmann, G., Oddy, T., and Schwingenschuh, K.: The Cluster Magnetic Field Investigation: Overview of in-flight performance and initial results, Ann. Geophys., 19, 1207–1217, 2001,
SRef-ID: 1432-0576/ag/2001-19-1207.
Bosqued, J. M., Phan, T. D., Dandouras, I., Escoubet, C. P., R`eme, H., Balogh, A., Dunlop, M. W., Alcayd´e, D., Amata, E., Bavassano-Cattaneo, M. B., Bruno, R., Carlson, C., DiLel-lis, A. M., Eliasson, L., Formisano, V., Kistler, L. M., Klecker, B., Korth, A., Kucharek, H., Lundin, R., McCarthy, M., McFad-den, J. P., M¨obius, E., Parks, G. K., and Sauvaud, J. A.: Cluster observations of the high-latitude magnetopause and cusp: Initial results from the CIS ion instruments, Ann. Geophys., 19, 1545– 1566, 2001,
SRef-ID: 1432-0576/ag/2001-19-1545.
Bryant, D. A. and Riggs, S.: At the edge of the Earth’s magneto-sphere: A survey by AMPTE-UKS, Phil. Trans. R. Soc. Lond. A., 328, 43–56, 1989.
Daly, P. W., Williams, D. J., Russell, C. T., and Keppler, E.: Particle signature of magnetic flux transfer events at the magnetopause, J. Geophys. Res., 86, 1628–1632, 1981.
Elphic, R. C.: Observations of flux transfer events: Are FTEs flux ropes, islands, or surface waves?, in Physics of Magnetic Flux Ropes, (Eds.) Russell, C. T., Priest, E. R., and Lee, L. C.
Geophysical Monograph 58, 455–471, AGU, Washington D. C., 1990.
Elphic, R. C., Baumjohann, W., Cattell, C. A., L¨uhr, H., and Smith, M. F.: A search for upstream pressure pulses associated with flux transfer events: An AMPTE/ISEE case study, J. Geophys. Res., 99, 13 521–13 527, 1994.
Farrugia, C. J., Elphic, R. C., Southwood, D. J., and Cowley, S. W. H.: Field and flow perturbations outside the reconnected field line region in flux transfer events: Theory, Planet. Space Sci., 35, 227–240, 1987a.
Farrugia, C. J., Southwood, D. J., Cowley, S. W. H., Rijnbeek, R. P., and Daly, P. W.: Two-regime flux transfer events, Planet. Space Sci., 35, 737–744, 1987b.
Gustafsson, G., Andr´e, M., Carozzi, T., Eriksson, A. I., F¨althammar, C.-G., Grard, R., Holmgren, G., Holtet, J. A., Ivchenko, N., Karlsson, T., Khotyaintsev, Y., Klimov, S., Laakso, H., Lindqvist, P.-A., Lybekk, B., Marklund, G., Mozer, F., Mur-sula, K., Pedersen, A., Popielawska, B., Savin, S., Stasiewicz, K., Tanskanen, P., Vaivads, A., and Wahlund, J.-E.: First results of electric field and density observations by Cluster EFW based on initial months of operation, Ann. Geophys., 19, 1219–1240, 2001,
SRef-ID: 1432-0576/ag/2001-19-1219.
Haerendel, G., Paschmann, G., Sckopke, N., Rosenbauer, H., and Hedgecock, P. C.: The frontside boundary layer of the magne-tosphere and the problem of reconnection, J. Geophys. Res., 83, 3195–3216, 1978.
Hapgood, M. A. and Bryant, D. A.: Re-ordered electron data in the low-latitude boundary layer, Geophys. Res. Lett., 17, 2043– 2046, 1990.
Hapgood, M. A. and Bryant, D. A.: Exploring the magnetospheric boundary layer, Planet. Space Sci., 40, 1431–1459, 1992. Hapgood, M. A. and Lockwood, M.: Rapid changes in LLBL
thick-ness, Geophys. Res. Lett., 22, 77–80, 1995.
Heikkila, W. J.: Impulsive plasma transport through the magneto-sphere, Geophys. Res. Lett., 9, 159–162, 1982.
Johnstone, A. D., Alsop, C., Burdge, S., Carter, P. J., Coates, A. J., Coker, A. J., Fazakerley, A. N., Grande, M., Gowen, R. A., Gur-giolo, C., Hancock, B. K., Narheim, B., Preece, A., Sheather, P. H., Winningham, J. D., and Woodliffe, R. D.: PEACE: a Plasma Electron And Current Experiment, Space Sci. Rev., 79, 351–398, 1997.
Kawano, H., Kokubun, S., and Takahashi, K.: Survey of transient magnetic field events in the dayside magnetosphere, J. Geophys. Res., 97, 10 677–10 692, 1992.
Lanzerotti, L. J.: Comment on “Solar wind dynamic pressure vari-ations and transient magnetospheric signatures”, Geophys. Res. Lett., 16, 1197–1199, 1989.
Lee, L. C. and Fu, Z. F.: A theory of magnetic flux transfer at the Earth’s magnetopause, Geophys. Res. Lett., 12, 105–108, 1985. Lemaire, J. and Roth, M.: Penetration of solar wind plasma
ele-ments into the magnetosphere, J. Atmos. Terr. Phys., 40, 331– 335, 1978.
Lemaire, J., Rycroft, M. J., and Roth, M.: Control of impulsive plasma penetration of solar wind irregularities into the magneto-sphere by the interplanetary magnetic field, Planet. Space Sci., 27, 47–57, 1979.
Lockwood, M.: Flux transfer events at the dayside magne-topause: Transient reconnection or magnetosheath dynamic pres-sure pulses?, J. Geophys. Res., 96, 5497–5509, 1991.
Lockwood, M. and Hapgood, M.: On the cause of a magnetospheric flux transfer event, J. Geophys. Res., 103, 26 453–26 478, 1998.
Lockwood, M. and Hapgood, M. A.: How the magnetopause tran-sition parameter works, Geophys. Res. Lett., 24, 373–376, 1997. Lockwood, M., Fazakerley, A. N., Opgenoorth, H., Moen, J., van Eyken, A. P., Dunlop, M., Bosqued, J. M., Lu, G., Cully, C., Eglitis, P., McCrea, I. W., Hapgood, M. A., Wild, M. N., Stam-per, R., Denig, W., Taylor, M., Wild, J. A., Provan, G., Amm, O., Kauristie, K., Pulkkinen, T., Strømme, A., Prikryl, P., Pitout, F., Balogh, A., R`eme, H., Behlke, R., Hansen, T., Greenwald, R., Frey, H., Morley, S. K., Alcayd´e, D., Blelly, P. L., Donova, E., Engebretson, M., Lester, M., Watermann, J., and Marcucci, M. F.: Coordinated Cluster and ground-based instrument obser-vations of transient changes in the magnetopause boundary layer during an interval of predominantly northward IMF: Relation to reconnection pulses and FTE signatures, Ann. Geophys., 19, 1613–1640, 2001,
SRef-ID: 1432-0576/ag/2001-19-1613.
Lundin, R., Sauvaud, J. A., R`eme, H., Balogh, A., Dandouras, I., Bosqued, J. M., Carlson, C., Parks, G. K., M¨obius, E., Kistler, L. M., Klecker, B., Amata, E., Formisano, V., Dunlop, M., Elias-son, L., Korth, A., Lavraud, B., and McCarthy, M.: Evidence for impulsive solar wind plasma penetration through the dayside magnetopause, Ann. Geophys., 21, 457–472, 2003,
SRef-ID: 1432-0576/ag/2003-21-457.
McComas, D. J., Bame, S. J., Barker, P., Feldman, W. C., Phillips, J. L., Riley, P., and Griffee, J. W.: Solar Wind Electron Proton Alpha Monitor (SWEPAM) for the Advanced Composition Ex-plorer, Space Sci. Rev., 86, 563–612, 1998.
Owen, C. J. and Cowley, S. W. H.: Heikkila’s mechanism for im-pulsive plasma transport through the magnetosphere: A reexam-ination, J. Geophys. Res., 96, 5565–5574, 1991.
Owen, C. J., Fazakerley, A. N., Carter, P. J., Coates, A. J., Krauk-lis, I. C., Szita, S., Taylor, M. G. G. T., Travnicek, P., Wat-son, G., WilWat-son, R. J., Balogh, A., and Dunlop, M. W.: Clus-ter PEACE observations of electrons during magnetospheric flux transfer events, Ann. Geophys., 19, 1509–1522, 2001,
SRef-ID: 1432-0576/ag/2001-19-1509.
Paschmann, G., Haerendel, G., Papamastorakis, I., Sckopke, N., Bame, S. J., Gosling, J. T., and Russell, C. T.: Plasma and mag-netic field characteristics of magmag-netic flux transfer events, J. Geo-phys. Res., 87, 2159–2168, 1982.
R`eme, H., Aoustin, C., Bosqued, J. M., Dandouras, I., Lavraud, B., Sauvaud, J. A., Barthe, A., Bouyssou, J., Camus, T., Coeur-Joly, O., Cros, A., Cuvilo, J., Ducay, F., Garbarowitz, Y., Medale, J. L., Penou, E., Perrier, H., Romefort, D., Rouzaud, J., Vallat, C., Al-cayd´e, D., Jacquey, C., Mazelle, C., d’Uston, C., M¨obius, E., Kistler, L. M., Crocker, K., Granoff, M., Mouikis, C., Popecki, M., Vosbury, M., Klecker, B., Hovestadt, D., Kucharek, H., Kuenneth, E., Paschmann, G., Scholer, M., Sckopke, N., Sei-denschwang, E., Carlson, C. W., Curtis, D. W., Ingraham, C., Lin, R. P., McFadden, J. P., Parks, G. K., Phan, T., Formisano, V., Amata, E., Bavassano-Cattaneo, M. B., Baldetti, P., Bruno, R., Chionchio, G., DiLellis, A., Marcucci, M. F., Pallocchia, G., Korth, A., Daly, P. W., Graeve, B., Rosenbauer, H., Va-syliunas, V., McCarthy, M., Wilber, M., Eliasson, L., Lundin, R., Olsen, S., Shelley, E. G., Fuselier, S., Ghielmetti, A. G., Lennartsson, W., Escoubet, C. P., Balsiger, H., Friedel, R., Cai, J. B., Kovrazhkin, R. A., Papamastorakis, I., Pellat, R., Scudder, J., and Sonnerup, B.: First multispacecraft ion measurements in and near the Earth’s magnetosphere with the identical Cluster Ion Spectrometry (CIS) experiment, Ann. Geophys., 19, 1303–1354, 2001,
Rijnbeek, R. P. and Cowley, S. W. H.: Magnetospheric flux erosion events are flux transfer events, Nature, 309, 135–138, 1984. Rijnbeek, R. P., Cowley, S. W. H., Southwood, D. J., and Russell,
C. T.: A survey of dayside flux transfer events observed by ISEE-1 and ISEE-2 magnetometers, J. Geophys. Res., 89, 786–800, 1984.
Roelof, E. C. and Sibeck, D. G.: Magnetopause shape as a bivari-ate function of interplanetary magnetic field BZand solar wind dynamic pressure, J. Geophys. Res., 98, 21 421–21 450, 1993. Russell, C. T. and Elphic, R. C.: Initial ISEE magnetometer results:
Magnetopause observations, Space Sci. Rev., 22, 681–715, 1978. Russell, C. T. and Elphic, R. C.: ISEE observations of flux transfer events at the dayside magnetopause, Geophys. Res. Lett., 6, 33– 36, 1979.
Sanny, J., Sibeck, D. G., Venturini, C. C., and Russell, C. T.: A statistical study of transient events in the outer dayside magneto-sphere, J. Geophys. Res., 101, 4939–4952, 1996.
Saunders, M. A., Russell, C. T., and Sckopke, N.: Flux transfer events: Scale size and interior structure, Geophys. Res. Lett., 11, 131–134, 1984.
Scholer, M.: Magnetic flux transfer at the magnetopause based on single X-line bursty reconnection, Geophys. Res. Lett., 15, 291– 294, 1988.
Sckopke, N.: Plasma structure near the low-latitude boundary layer: A rebuttal, J. Geophys. Res., 96, 9815–9820, 1991.
Sibeck, D. G.: A model for the transient magnetospheric response to sudden solar wind dynamic pressure variations, J. Geophys. Res., 95, 3755–3771, 1990.
Sibeck, D. G.: Transient events in the outer magnetosphere: Bound-ary waves or flux transfer events?, J. Geophys. Res., 97, 4009– 4026, 1992.
Sibeck, D. G. and Newell, P. T.: Pressure-pulse driven surface waves at the magnetopause: A rebuttal, J. Geophys. Res., 100, 21 773–21 778, 1995.
Sibeck, D. G. and Newell, P. T.: Reply, J. Geophys. Res., 101, 13 351–13 352, 1996.
Sibeck, D. G., Baumjohann, W., Elphic, R. C., Fairfield, D. H., Fennell, J. F., Gail, W. B., Lanzerotti, L. J., Lopez, R. E., Luehr, H., Lui, A. T. Y., MacLennan, C. G., McEntire, R. W., Potemra, T. A., Rosenberg, T. J., and Takahashi, K.: The magnetospheric response to 8-minute period strong-amplitude upstream pressure variations, J. Geophys. Res., 94, 2505–2519, 1989.
Smith, C. W., L’Heureux, J., Ness, N. F., Acu˜na, M. H., Burlaga, L. F., and Scheifele, J.: The ACE magnetic fields experiment, Space Sci. Rev., 86, 613–632, 1998.
Smith, M. F. and Curran, D. B.: On the correlation between a mag-netopause penetration parameter and FTE occurrence, Ann. Geo-phys., 8, 579–582, 1990.
Smith, M. F. and Owen, C. J.: Temperature anisotropies in a mag-netospheric FTE, Geophys. Res. Lett., 19, 1907–1910, 1992. Song, P., Le, G., and Russell, C. T.: Observational differences
between flux transfer events and surface waves at the magne-topause, J. Geophys. Res., 99, 2309–2320, 1994.
Song, P., Le, G., and Russell, C. T.: Comment on “Pressure-pulse driven surface waves at the magnetopause: a rebuttal”, J. Geo-phys. Res., 101, 13 349–13 350, 1996.
Sonnerup, B. U. ¨O.: On the stress balance in flux transfer events, J. Geophys. Res., 92, 8613–8620, 1987.
Southwood, D. J., Farrugia, C. J., and Saunders, M. A.: What are flux transfer events?, Planet. Space Sci., 36, 503–508, 1988. Thompson, S. M., Kivelson, M. G., Khurana, K. K., Balogh, A.,
R`eme, H., Fazakerley, A. N., and Kistler, L. M.: Cluster ob-servations of quasi-periodic impulsive signatures in the dayside northern lobe: High-latitude flux transfer events?, J. Geophys. Res., 109A02, 213, doi:10.1029/2003JA010 138, 2004. Vontrat-Reberac, A., Bosqued, J. M., Taylor, M. G. G. T., Lavraud,
B., Fontaine, D., Dunlop, M. W., Laakso, H., Cornilleau-Werhin, N., Canu, P., and Fazakerley, A.: Cluster observa-tions of the high-altitude cusp for northward interplanetary magnetic field: A case study, J. Geophys. Res., 108, 1346, doi:10.1029/2002JA009 717, 2003.