Musa germplasm diversity status across a wide range
of agro-ecological zones in Rwanda
W. Ocimati1, G. Blomme1, A. Rutikanga2, D. Karamura1, P. Ragama3, S. Gaidashova5, A. Nsabimana4 and C. Murekezi5
1Bioversity International, P.O. Box 24384, Kampala, Uganda [email protected]; [email protected];
2Bioversity International/CIALCA Project, Kigali, Rwanda [email protected] 3Kabarak University, Private Bag 20157, Kabarak, Kenya [email protected]
4Kigali Institute of Science and Technology, P.O. Box 3900, Kigali Rwanda [email protected]
5Rwanda Agricultural Board (RAB), Kigali, Rwanda [email protected]; [email protected] Original submitted in on 25th October 2013 Published online at www.m.elewa.org on 31st January 2014. ABSTRACT
Objectives: This study assessed the on-farm Musa germplasm diversity across different agro-ecologies of Rwanda and the socio-economic utilization options and selection practices that create/maintain this diversity on-farm.
Methodology and results: A Musa germplasm diagnostic survey was carried out in 2007 in five Rwandan districts on a transect from Lake Kivu (West) to Kirehe district (East) bordering Tanzania. Across all sites, 118 farms, each having at least 50 mats were sampled for determining Musa diversity. Forty three Musa cultivars were recorded across the five districts. Higher diversity was observed in the east declining westwards to the Lake Kivu region as reflected by the number of cultivars and their relative abundance. Nearly half of the recorded cultivars had a low diversity index (Gini-Simpson 1-D < 0.2) and therefore prone to genetic erosion. Cooking cultivars only dominate in the district of Kirehe, while beer cultivars dominate the banana production landscape in the other districts. Taste/flavor, bunch size and market demand were the most important criteria for banana cultivar selection and thus greatly influenced cultivar conservation and distribution on-farm. Diseases such as Fusarium wilt and Xanthomonas wilt greatly contributed to genetic erosion.
Conclusion and application of results: Musa cultivar diversity in Rwanda is under threat. Ex-situ conservation of the menaced cultivars is of crucial importance. Beer cultivars dominated the landscape. Cultivar diversity on-farm was influenced by the prevailing altitude; taste/flavor, bunch size, and market demand of the cultivars; and their susceptibility to diseases especially Fusarium and Xanthomonas wilt. Banana breeding or adaptation strategies therefore should take into account the farmer preferred traits. In addition, strategies for managing these diseases are critical for preventing the genetic erosion of the affected cultivars.
Keywords: cultivar evenness, cultivar richness, diversity index, genetic erosion INTRODUCTION
The Great Lakes region of East Africa, of which Rwanda is part, constitutes one of the secondary centers of Musa diversity, especially for the East
African highland bananas, AAA-EA (Karamura et al., 2004). Banana and plantain (Musa sp.) is an important staple and income-generating crop
Journal of Applied Biosciences 73:5979– 5990
ISSN 1997–5902grown by up to 90% of households in Rwanda (Lassoudière, 1989). Rwanda with the total estimated banana production of 2.65 MT/year ranks among the top 20 banana producers in the world (FAOSTAT, 2008). Banana consumption in Rwanda is one of the highest in the Great Lakes region and is estimated at an annual per capita consumption of 258 kg (Jagwe et al., 2008). In Rwanda, banana covers 23% of the total cultivated land (Mpyisi et al., 2000), is produced all year round and thus improving food security and significantly contributing to the resilience of the agro-ecological landscape. Its soil conserving properties through its canopy, root system and mulching a common practice in banana plantations are important for soil conservation in Rwanda that has an undulating terrain. For example, Lufafa et al. (2003) reported 30% lower erosion levels in fields cropped with bananas compared to those with annual crops. However, banana fruits are now also massively imported in Rwanda, mainly from Uganda, Tanzania and the Democratic Republic of Congo. This has partly been attributed to falling productivity as a result of banana diseases and demographic pressure which has led to land fragmentation and deterioration of the natural resource base (Jagwe et al., 2008). This region has indeed suffered a great decline in Musa production and germplasm diversity in the last ten to twenty years. The decline in Musa germplasm diversity in Rwanda has been due to land pressure, pests, diseases and plant nutritional problems (Okech et al., 2002 and 2005). In addition, population migrations before and during
the 1994 genocide led to the disappearance or
renaming of some cultivars (Nsabimana and van Staden, 2005) thus creating confusion in the nomenclature of cultivars. The 1994 genocide also disrupted the operations of the Rwanda banana programme leading to loss of archived information and a complete staff turnover (Okech et al., 2002 and 2005).
Such deterioration necessitated an urgent assessment of the current extent of diversity available in the country and its characterization in
order to take some conservation and
developmental actions. In effect, there have already been various efforts to collect and conserve ex-situ the genetic diversity of Musa in Rwanda. For example, 90 accessions from the existing ex-situ collection at ISAR, Rubona were characterized (Nsabimana and van Staden, 2005). Various socioeconomic, marketing and agro-ecological constraints are known to play an
important role in farmers’ choices and
management of crop genetic diversity at the farm, agro-ecosystems and community levels (Gauchan et al., 2005). Ex-situ facilities cannot always accommodate the full range of useful diversity; conserve the dynamic process of crop evolution and farmers knowledge of crop selection and management inherent in the development and evolution of local cultivars (Bellon et al., 1997; Fowler and Hodgkin, 2005). As such, on-farm conservation of genetic resources is increasingly being given a high attention (Bretting and Duvick, 1997; Bellon et al., 1997; Brush, 2004; Fowler and Hodgkin, 2005). However, the genetic erosion of Musa diversity is most likely going to continue in Rwanda with the ongoing government policy of
market-driven production and regionalization of crop cultivation, including bananas, into few but ‘high potential’ agro-ecological zones. Thus, an on-farm study of the Musa germplasm diversity, the key selection practices and agro-ecological factors influencing this diversity was still needed to further support Musa conservation and development in Rwanda. The objectives of this study were therefore to assess the on-farm Musa germplasm diversity across different agro-ecologies of Rwanda and the socio-economic utilization options and selection practices that create/maintain cultivar diversity on-farm in these agro-ecological niches.
MATERIALS AND METHODS
This study was conducted in 2007 through an on-farm Musa diagnostic survey in five banana growing,
Rwandan districts located along a transect ranging from
Rusizi, bordering Lake Kivu (Western Province), to Kirehe district (Eastern Province) at the border with Tanzania. The other sampled districts included
Bugesera in the Eastern province, Ruhango in the Southern province and Karongi in the Western province (Fig 2). Rainfall and temperature in Rwanda vary with the variation in altitude. Rwanda generally receives much rainfall, though rains can be erratic in the East (Verdoodt and Van Ranst, 2003). Rwanda receives the highest rainfall in the Western Highlands and lowest rainfall in the Eastern lowlands (Verdoodt and Van Ranst 2003). The high altitude regions (Western) have the lowest mean temperatures (16-17°C), while higher temperatures are observed in the central plateau (18-21°C) and in the Eastern Plateau and the Western lowlands (20-24°C) (Verdoodt and Van Ranst, 2003). Rwanda has four different seasons: a short dry season (January to February); a long rainy season (March to May); a long dry season (June to mid-September) and a short rainy season from mid-September to the end of December (Verdoodt and Van Ranst, 2003). Little
variations in temperatures are noted throughout the year, though diurnal fluctuations can exceed 12°C. The five districts were sampled based on the importance of the Musa crop in the farming system and the variability in the agro-ecologies. This was anticipated to offer a higher chance of capturing a more representative Musa cultivar diversity in the country. Bananas in Rwanda are often grown in association with one or two other important crops, including beans, sweet potatoes, cassava, sorghum and yam (Sebasigari, 1985; AATF, 2009). The five districts cut across a range of agro-ecologies (agricultural zones). Delepierre (1974) delimited 12 agricultural zones in Rwanda, based on differences in altitude, rainfall regime and soil properties (Table 1). Each of these zones has a unique combination of land resources that determines the range of well-adapted crops (Verdoodt and Van Ranst, 2003).
Table 1: Characteristics of the agricultural zones in Rwanda
Zone Altitude(m) Rainfall(mm) Soil Agricultural
value
n° name min avg max min avg max
1 Imbo 970 1,100 1,400 1,050 1,200 1,600 alluvial excellent 2 Impara 1,400 1,700 1,900 1,300 1,400 2,000 very fine, red, <
basalt
good 3 Lake Kivu Border 1,460 1,600 1,900 1,150 1,200 1,300 shallow, clay
loam
excellent-good 4 Birunga 1,600 2,200 2,500 1,300 1,500 1,600 volcanic excellent 5 Congo-Nile
Watershed Divide
1,900 2,100 2,500 1,300 1,600 2,000 humiferous, acid moderate 6 Buberuka
Highlands
1,900 2,000 2,300 1,100 1,200 1,300 laterite soil good 7 Central Plateau 1,500 1,700 1,900 1,100 1,200 1,300 humiferous good 8 Granitic Ridge 1,400 1,600 1,700 1,050 1,100 1,200 coarse, gravely moderate 9 Mayaga 1,350 1,450 1,500 1,000 1,050 1,200 clayey, < schists very good 10 Bugesera 1,300 1,400 1,500 850 900 1,000 strongly
weathered
poor 11 Eastern Plateau 1,400 1,500 1,800 900 950 1,000 laterite soil moderate–
good 12 Eastern Savanna 1,250 1,400 1,600 800 850 900 strongly
weathered
very poor Source: Verdoodt and Van Ranst, 2003
Rusizi district falls in the Imbo and Imapra zone; Karongi in the Lake Kivu Borders; Ruhango across Central Plateau, Granitic Ridge and Mayaga zones; Bugesera across the Mayaga and Bugesera zones; and Kirehe district across the Eastern Plateau and the Eastern Savanna zones. MINAGRI, (2003) reported the
Imbo, Impara, Kivu Lake Borders, Eastern Plateau and Eastern Savanna as the main banana cultivation zones. In contrast, the land suitability classification ranks the suitability of the East ranges between moderate and marginal because of the low rainfall, while the Mayaga and the peripheral part of the Bugesera as moderately
suitable (Verdoodt and Van Ranst, 2003). Agricultural zones 4, 5, 6 and 12 are of no importance to banana production following the crop regionalization (Verdoodt and Van Ranst, 2003). The socioeconomic characteristics such as the gender and wealth status typology (i.e. poor, moderately rich and rich); easy access to markets; and presence of local farmers’ institutions and NGOs interested in banana production and with the capacity to scale out research results were also considered in sampling of districts. This study built on participatory rural appraisals (PRA) and baseline surveys, which were conducted by CIALCA in the framework of the CIALCA consortium in the same districts in 2006 (CIALCA, 2008). The PRA and baseline surveys were executed in sites cutting across existing biophysical/ socioeconomic gradients of banana production potential in Rwanda. Whereas the PRA and baseline surveys were solely based on information derived through focus group discussions and household interviews, this farm diagnostic survey took a step further to quantify farming systems through actual field measurements. Interview schedules with open and close ended questions were used to capture data in this study. Across all sites, 118 farmers were sampled along the transect using a random systematic method. Sampling was done on farms that had at least 50 banana mats. The mean altitudes of the sampled farms varied across the five surveyed districts. The altitudes of farms sampled in Rusizi district in the Western province bordering the southern tip of Lake Kivu ranged from 1,594 to 1,706 masl. Karongi district also bordering Lake Kivu had altitudes ranging from 1,440 to 1,559 masl, meanwhile in Ruhango district in the Southern province altitudes ranged from 1,339 to 1,543 masl. The Eastern province districts of Bugesera and Kirehe were located at altitude ranges from 1,310 to 1,595 masl. The diagnostic survey focused on on-farm Musa germplasm diversity, socio-economic utilization options/practices that create/maintain cultivar diversity on-farm and cultivar disappearance/genetic erosion. Musa cultivar names obtained during farmer interviews were subsequently reviewed by the Rwanda banana program staff and checked against the National Banana Germplasm Collection database of the Rwandan Agricultural Research Institute (ISAR), Rubona research station. SPSS statistics 17.0 (IMB corporation, 2008) and MS Excel were used to analyze descriptive data and generate frequency distribution tables and charts. Musa germplasm diversity was quantified using the number (richness) (Equation 1) and relative abundance of cultivars (Equation 2) in the study
sites or ecosystem, often referred to as species diversity. Species diversity is a function of the number of species present (richness) and the evenness or equitability (relative abundance) of each (Hurlbert, 1971). These diversity indices determine which populations to target for conservation to maximize diversity or to model services provided by diversity (Gauchan et al., 2005). Species richness sums the number of different distinct Musa cultivars regardless of their frequencies across study communities. Species richness is the diversity of order zero and is completely insensitive to cultivar frequencies (Jost, 2006). It gives equal weight to those cultivars represented by very few plants as to those represented by many plants (Jost, 2006; Dyke, 2008; Colwell, 2009).
D=∑s
i =1 Pi0 Equation 1
where cultivar i comprises the proportion Pi of the total individuals in a community of S individuals, 0 denotes diversity of order zero.
Simpson index expressed as Gini-Simpson/ Simpson index of diversity 1–D was used as the measure of relative abundance (Equation 2). The Gini-Simpson index (1-D) i.e. evenness is a measure of how similar species are in their abundances (Magurrun, 1988). The opposite of evenness is dominance, which is the extent to which one or a few species dominate the community (Magurrun, 1988). This index takes account of the number of individuals of each cultivar as well as the number of cultivars within a community (Gauchan et al., 2005; Jost, 2006). It is conventional to equate high diversity with high evenness (equivalent to low dominance) (Magurrun, 1988).
Gini-Simpson 1–D = ∑i {ni × (ni - 1)} / (N × (N - 1)) Equation 2
where ni is the number of individuals of cultivar i and N is total number of individuals of all cultivars.
GenStat 11th Edition (VSN International Ltd, 2008) was used to compute species richness and the Simpson 1-D indices.
To determine the most important Musa cultivar selection criteria influencing the diversity of cultivars on-farm, farmers selected and ranked nine different cultivar selection criteria in order of importance. Farmers’ responses were then compiled and the means subjected to a multivariate principal components analysis using GenStat 11th Edition (VSN International
Ltd, 2008) to determine the most important selection criteria across farms. RESULTS
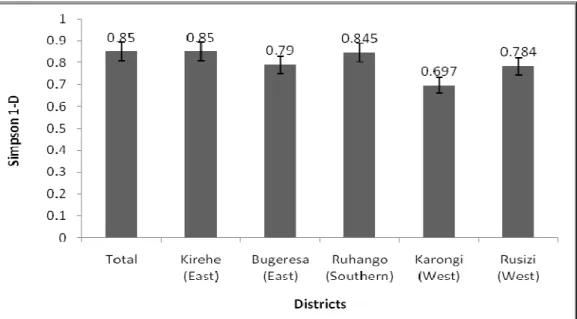
Cultivar diversity: Forty three different Musa cultivars were recorded across the five districts of Rwanda (Table 1). A higher Musa cultivar diversity was observed in the Eastern province declining to the west as shown by the number of cultivars (Table 1) and the Gini-Simpson index of diversity (which is a measure of relative abundance) (Fig. 1). Karongi district (in the West) with 12 cultivars had the least number of cultivars recorded on-farm, while Bugesera (24 cultivars) and Kirehe (23 cultivars) in the East, boasted of the highest number of cultivars on-farm among the
studied districts in Rwanda (Table 1). Similarly, the western district of Karongi had the least Gini-Simpson indices of 0.697 (i.e. dominated by fewer cultivars) compared to 0.79 and 0.85 in Bugesera and Kirehe in the west, respectively (Fig. 1). For example, the four most predominant cultivars occupied 84% and 88% of the Musa production landscapes in the western districts of Karongi and Rusizi, respectively compared to 70% and 72% in Kirehe and Bugesera, respectively (Table 1).
Figure 1: Gini-Simpson indices of diversity of Musa cultivars assessed during a germplasm survey in 2007 in Rwanda. The study covered five districts of Kirehe (in the East), Bugeresa (East), Ruhango (Southern), Karongi (West) and Rusizi (West). Vertical bars are jackknife standard errors. Only four of the 43 cultivars, i.e. ‘Intuntu’ (AAA-EA, beer), ‘Gros Michel’ (AAA, dessert), ‘Ingenge’ (AAA-(AAA-EA, cooking) and ‘Kamaramasenge’ (AAB, dessert) were widely grown across the five districts.
Five other cultivars ‘Indaya’ (AAA, beer), ‘Mujuba’ EA), ‘Mbwaziruma’ (AAA–EA), ‘Intokatoke’ (AAA-EA) and ‘Poyo’ (AAA, dessert) were grown across four districts (Table 1). Most of the 43 Musa cultivars i.e. 48% were only found grown in one district. The AAA-EA beer cultivars still dominate the Musa landscape in Rwanda (67% of landscape) with the cultivars ‘Intuntu’ (AAA-EA group, 33% of area), ‘Indaya’ (AAA-EA, 11%), ‘Umuzibwe’ (AAA-EA, 7.3%), ‘Kayinja’ (ABB, 6.9%) and ‘Intokatoke’ (AAA-EA, 5.6%) as the prominent ones (Table 1). Important cooking cultivars in Rwanda are the AAA-EA cooking bananas ‘Barabeshya’ (5.2%),
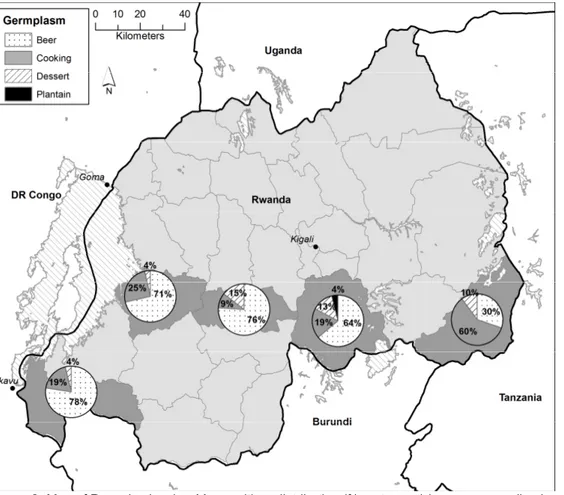
‘Ingaju’ (3.7%), ‘Mujuba’ (2.9%), while ‘Poyo’ (AAA, 4.5%) and ‘Kamaramasenge’ (AAB, 1.7%) are the important dessert cultivars. Beer cultivars predominate in the Western province (71-78% of area under Musa) declining eastwards as cooking banana gain in importance (Fig. 2). The AAA-EA highland beer cultivar ‘Intuntu’ dominates among the beer types (21to 52%). Cooking cultivars dominate in Kirehe in the east (Fig. 2) occupying up to 60% of the banana landscape in the district. The area under dessert cultivars varied between 4% in the Western districts and 15% in Ruhango district. Area under dessert types in Bugesera
and Kirehe districts was 13 and 10%, respectively. ‘Muzuzu’ (AAB) mainly eaten cooked or used for beer making was the only plantain cultivar recorded in this
study. Only 4% and 0.2% of this cultivar was recorded in Bugesera and Kirehe districts, respectively.
Figure 2: Map of Rwanda showing Musa cultivar distribution (% mat count) by use groups (i.e. beer, cooking, dessert and plantain) in five surveyed districts in 2007. From east (Tanzania border) to West (DR Congo border) are Kirehe, Bugesera, Ruhango, Karongi and Rusizi districts, respectively.
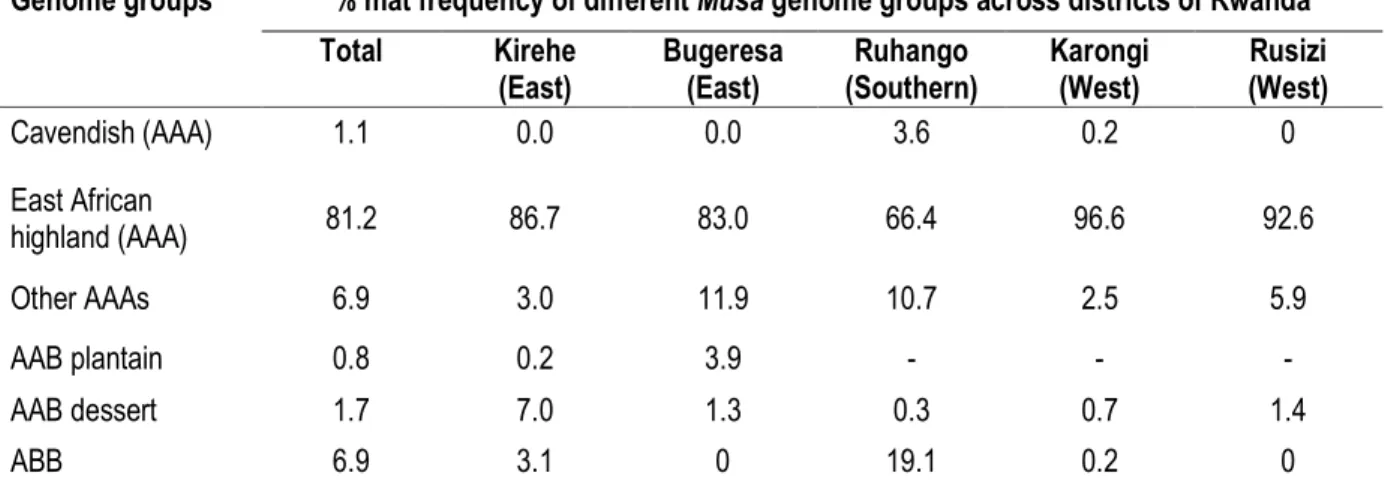
Several cultivars including ‘Intuntu’ (beer), ‘Intokatoke’ (beer), ‘Ingaju’ (cooking), ‘Ikinyangurube’ (AAA, dessert), ‘Kampala’ (AAA-dessert), ‘Mavuta’ (AAA-EA, beer), ‘Icyerwa’ (AAA-EA, cooking), ‘Gisukari’ (AAA, dessert) and Muzuzu (AAB, plantain) had multiple uses to the farmers. Most farmers observed that the dessert types helped improve the potency and quality of beer. Musa diversity on the basis of genome groups revealed dominance of the East African highland banana, Musa AAA-EA (81%) (Table 3). Other AAA types and the
ABB types were tied up at 7%. Cavendish AAA types, the AAB dessert types and AAB plantain types accounted for only 1.0%, 2% and 0.8% of the landscape, respectively. Ruhango district in the Southern had the least concentration of East African highland bananas (AAA-EA) (66%). It had a relatively high (19%) concentration of the ABB types. In contrast the West had the highest frequency of AAA-EA types (93 to 97% of the landscape) (Table 3).
Table 2: Musa cultivars listed in five districts of Rwanda, their respective genome groups, use and mat coverage (%) in a Musa germplasm diagnostic survey in 2007. A dash (-) indicates the cultivar was not detected in this location in this survey.
Cultivar name Genome group
Traditional Use
Musa mat coverage (%) Percent total Rusizi (West) Karongi (West) Ruhango (Southern) Bugeresa (East) Kirehe (East)
Intuntu1 AAA Beer C 33.0 35.64 51.63 21.17 42.55 23.28
Indaya2 AAA Beer 11.0 2.27 10.82 24.77 17.41 -
Umuzibwe AAA Beer 7.3 21.77 8.89 - - -
Kayinja3 ABB Beer 6.9 - - 19.05 - 3.08
Intokatoke AAA Beer/Cooking 5.6 13.03 - 3.54 1.71 2.89
Barabeshya AAA Cooking 5.2 17.36 - - - -
Poyo AAA Dessert 4.5 - 1.53 10.30 6.08 1.54
Ingaju AAA Cooking B 3.7 - - - 1.30 27.99
Mujuba AAA Cooking 2.9 - 11.61 3.08 4.42 1.06
NyiramabuyeN AAA Beer 1.9 - - 6.93 - -
Kamaramasenge AAB Dessert 1.7 1.42 0.73 0.33 1.30 7.02
Injagi4 AAA Cooking 1.4 - - - 0.27 10.49
Gros Michel5 AAA Dessert 1.2 2.14 1.00 0.25 5.67 1.49
Mbwaziruma AAA Cooking 1.2 - 0.93 1.06 2.71 2.07
Ikinyangurube6 AAA Multiple 1.1 0.06 - 3.58 0.24 -
Inzirabahima AAA Cooking 1.1 0.70 - 3.12 - 0.34
Kampala7 AAA Beer D 1.1 3.63 - - - -
Icyerwa* AAA Cooking B 1.0 - - - - 7.89
Intutsi AAA Cooking 0.9 - - - 4.01 -
Nyakitengwa8 AAA Cooking B 0.9 - 9.49 - 0.54 0.05
Ingenge9 AAA Cooking 0.8 0.43 2.99 0.19 1.62 3.32
Muzuzu10 AAB RoastingC,B 0.8 - - - 3.90 0.20
RumaripfaN AAA Cooking 0.8 - - - 3.58 -
Inyamunyo AAA Cooking 0.5 - - 1.83 - -
Ingumba AAA Cooking/Beer 0.4 - - - 1.25 0.87
Ishika AAA Beer 0.3 1.17 - - - -
Bakungu11 AAA Cooking 0.2 - - - - 1.59
Ingagara AAA Cooking 0.2 - - - - 1.59
Intembe AAA Beer 0.2 - - 0.42 0.35 -
Inyoya AAA Cooking 0.2 - - - - 2.31
Gisukari12 AAA Dessert B 0.1 0.17 - 0.10 0.14 -
Igihuna AAA Beer 0.1 0.02 - 0.08 0.24 -
Incakara AAA Cooking 0.1 - - - 0.27 0.05
Inyarwanda AAA Cooking 0.1 - - 0.21 - -
Mutsimawuburo13 AAA Cooking 0.1 - - - 0.24 0.34
UmugumiraN AAA Beer 0.1 - - - 0.38 -
BushokiN AAA Cooking 0.0 - 0.20 - - -
Gisubi AB Beer 0.0 - 0.20 - - -
IndundiN AAA Cooking 0.0 0.08 - - - -
Intobe AAA Cooking 0.0 - - - - 0.29
Inyabupfunsi AAA Cooking 0.0 0.12 - - - -
Isha AAA Beer 0.0 - - - 0.11 -
Kintu AAA Cooking 0.0 - - - - 0.34
Synonyms: 1: ‘Inkara’ and ‘Insiri’; 2: ‘Yangambi Km5’ and ‘Kanuka’; 3: Pisang Awak; 4: ‘Incakara’; 5: ‘Mbogoya’ and ‘Mavuta’; 6: ‘Petite Naine’ and ‘Grande Naine’; 7: ‘Madame’ and ‘Prata’; 8 ‘Mitoki’;9: ‘Inyabutembe’; 10:
‘Umushaba1’= false Horn plantain and ‘Umushaba2’ = French Plantain 11: ‘Makungu’; 12: ‘Gisukari red’ (red fruit skin variety) and ‘Gisukari green’ (yellow fruit skin variety); and 13: ‘Inzirabushera’;
N: Not present in the ISAR Rubona Musa germpasm collection, Foc: Lost from the ISAR collection due to Fusarium wilt disease *: Two types of ‘Icyerwa’- with small or big fingers
#: Has both cooking and brewing types
Other cultivar uses: C= cooking; B= beer; D = Dessert; R= Roasting Selection criteria on-farm: The first (PC1) and second
(PC2) principal components for the nine Musa selection criteria ranked by farmers accounted for 100% of the variation (Table 4). The first PC assigned nearly equal loading across the variables in all the Musa use groups (i.e. beer, cooking, dessert and roasting). The second PC gave a higher loading to taste/flavor/quantity of juice produced, market demand and bunch size for the beer, cooking and dessert group (Table 4). The results
suggest that these criteria are the most important for banana selection in Rwanda. On the contrary, ability of Musa plants to mature early and the ability of mats to perpetuate for a long period were the most important selection criteria for the single roasting (Plantain) cultivar. Banana producing areas of Rwanda are dominated by high altitudes that are unfavorable to plantain cultivation.
Table 3: Musa cultivar diversity (% frequency) distribution by genome groups in Rwanda. Data was collected during a Musa germplasm diagnostic survey in 2007. A dash (-) indicates the Musa group was not detected in this location in this survey.
Genome groups % mat frequency of different Musa genome groups across districts of Rwanda Total Kirehe (East) Bugeresa (East) Ruhango (Southern) Karongi (West) Rusizi (West) Cavendish (AAA) 1.1 0.0 0.0 3.6 0.2 0 East African highland (AAA) 81.2 86.7 83.0 66.4 96.6 92.6 Other AAAs 6.9 3.0 11.9 10.7 2.5 5.9 AAB plantain 0.8 0.2 3.9 - - - AAB dessert 1.7 7.0 1.3 0.3 0.7 1.4 ABB 6.9 3.1 0 19.1 0.2 0
Cultivar disappearance: Only13% of the respondents reported cultivar loss. The highest perceived cultivar loss was recorded in Bugesera (15%) followed by Rusizi (6%), Ruhango (6%), Kirehe (4%) and Karongi (3%) district. Most affected cultivars included the
dessert varieties ‘Kamaramasenge’ (59%), Gros Michel (38%) and ‘Gisukari’ (18%) and the ABB beer banana ‘Kayinja’ (59%). All respondents cited diseases to be responsible for the disappearance of these cultivars.
Table 4: Eigen vectors and values of two principal component axes (PCA) for nine cultivar selection criteria for 4 Musa uses groups (beer, cooking, dessert and plantains) in Rwanda in 2007 (Coefficients in bold font indicate most important criteria for each principle component).
Beer Cooking Dessert Roasting
Cultivar selection criteria PC1 PC2 PC1 PC2 PC1 PC2 PC1 PC2 Availability of planting materials -0.3966 0.0841 -0.3955 0.0877 -0.3961 0.0877 -0.3635 -0.1103 Early maturing -0.3950 -0.0997 -0.3946 -0.0970 -0.3948 -0.1006 -0.1377 -0.7377 Good flavor, taste and
high juice yield
-0.1077 0.5789 -0.0915 0.5879 -0.0900 0.5863 -0.3666 0.0406 High market demands /
prices
-0.1518 0.5562 -0.1724 0.5449 -0.1652 0.5481 -0.3635 -0.1103 Pests and diseases
resistance
-0.3955 -0.0953 -0.3943 -0.0991 -0.3950 -0.0985 -0.3670 0.0136 Size of bunch / big bunch 0.1295 0.5688 0.1313 0.5704 0.1317 0.5683 -0.3635 -0.1103 Long life span of mats -0.3975 -0.0748 -0.3969 -0.0719 -0.3976 -0.0712 0.2259 -0.6274 Tolerance to drought -0.4005 0.0121 -0.3997 0.0005 -0.4002 0.0163 -0.3670 0.0136 Tolerance to poor soil
fertility
-0.4005 -0.0112 -0.3997 -0.0047 -0.4004 -0.0071 -0.3602 0.1537 Eigen values 6.232 2.768 6.258 2.742 6.238 2.762 7.421 1.579 Percentage variation (%) 69.24 30.76 69.54 30.46 69.31 30.69 82.46 17.54 DISCUSSION OF RESULTS
Dynamic relative importance of the cultivars and its reasons: Cultivar diversity (richness and evenness) varied across the agro-ecologies of Rwanda and was influenced by the interaction between the agro-ecologies, farmer selection practices and diseases. The variable altitude across Rwanda strongly influences the rainfall amount, temperature conditions and soils, thus influencing the suitability of the districts to the banana crop and the different cultivars. The conditions in high altitudes (low temperature and high rainfall) are conducive for east African high land cultivars (AAA-EA). This could explain dominance of the AAA-EA genome group (66 to 96% of landscape) in the study region (Table 2). Altitude also influences the prevalence of pests and diseases. For example, a high prevalence of banana bunchy top disease, black sigatoka, banana weevils and burrowing nematodes occur at lower altitudes. The presence of moderate to steep slopes at high altitudes makes these sites prone to erosion (van Asten et al., 2004), thus affecting the quality of soils and could as such influence the choice of cultivars to grow. For example, introduced beer banana ‘Kayinja’ (ABB) is reported to withstand poor soils much better than the AAA- EA bananas (both cooking and beer) (Gaidashova et al., 2005). Higher cultivar diversity was observed in the Eastern districts (Kirehe and Bugesera)
compared to the Western districts (Karongi and Rusizi). The four most predominant cultivars occupied 84% to 88% of the Musa production landscape in the western districts compared with 70% to 72% in the Eastern districts (Table 1). The lower diversity in the Western region can be attributed to specialization in the production of a few, yet more productive cultivars for the market. A decline in cultivar diversity was observed in Rusizi district when current data was compared with results from the 2001 Musa germplasm survey reported by Nsabimana et al. (2008). In this district, banana production is increasingly becoming market-oriented with a special preference for the AAA-EA cooking variety ‘Barabeshya’ (17% of Musa landscape) that possess long fingers (C. Murekezi, Kigali, Rwanda, 2011, personal communication). Barabeshya falls under the AAA-EA Musakala clone set, one of the most commercial groups of East African Highland cultivars. Most (48%) of the 43 Musa cultivars in this study were not widely grown and only found in one district (Table 2). Dyke (2008), argues that when a community is dominated by only one or a few species, it may be that the rarer species are at risk being eroded. He further argues that, such a distribution pattern may indicate that the habitat lacks a sufficient diversity of structure, patchiness, or resources to allow many species to exist
together (Dyke, 2008). These cultivars, especially those in insignificant quantities and of no local cultural value could be vulnerable to genetic erosion. An in depth understanding of the community values of the individual cultivars and the conservation ex-situ of those of low community importance is therefore recommended. The AAA- EA cultivars ‘Bushoki’, ‘Indundi’, ‘Umugumira’, ‘Rumparipfa’ and ‘Nyirambuye’ are not listed among the ISAR Rubona Musa accessions. These cultivars were each observed in single districts and could be either synonyms or not yet collected into the ISAR Musa collection. There is also the possibility that they are only suited to the specific niches. Morphological characterization and or determination of their synonymy status to cultivars already established at the ISAR collection is recommended. The dominance of beer cultivars in Rwanda (67%) especially in the Western province (71-78% of area under Musa), and their declining presence eastwards in favor of cooking banana (Fig. 2) is in agreement with data collected in 2000 by Gaidashova et al. (2005). Beer bananas are considered more tolerant to adverse growing conditions, low levels of management and are better suited to regions with low market access (e.g. far from Kigali) because the beer produced has a longer shelf life (Gaidashova et al., 2005). More still, high altitudes (> 1500 masl) support the AAA-EA beer types more than the cooking types (D. Karamura, Kampala, Uganda, 2011, personal communication). However, in the Lake Kivu area (Karongi district) the proportion of the area under beer bananas has declined from 90% (Gaidashova et al., 2005) to 71.5%. This is contrary to previous reports by Gaidashova et al., (2005) who stated that farmers preferred introduced beer bananas (ABB) because they perform better on poor soils than the AAA- EA bananas (both cooking and beer). The high susceptibility of the ABB beer types to Fusarium wilt could have hampered their spread. In addition, the Government of Rwanda’s policy of reducing the area under beer banana production (from 60% to 35%) and to increase the area under cooking bananas (from 30% to 45%) and dessert bananas (from 10 to 20%) may be taking root. The dominance of cooking cultivars (60% of
the banana landscape) in Kirehe district is in agreement with previous reports by Bart (1993), Kangasniemi (1998) and Gaidashova et al. (2005). Dominance of cooking bananas in this region is attributed to the good soils (Lassoudière et al., 1989) and good access to markets of Kigali (Gaidashova et al., 2005). When comparing results from the present survey with data obtained in 2000 (Gaidashova et al., 2005), the area under dessert bananas has declined by 2 to 3% across Rwanda except in the Kirehe district where production has remained stagnant at 10% (Fig. 2). This could be due to Fusarium wilt that attacks the major dessert type ‘Kamaramasenge’. Several cultivars were observed to be of multiple uses to farmers. Most farmers observed that the dessert types helped improve the potency and quality of beer. This partly could explain the multiple uses (beer, dessert and cooking) of some of the cultivars grown in this region.
Pressures and constraints: The pulp or juice taste/flavor/quality; market demand/ price; and bunch size were the most important cultivar selection criteria used by farmers to prioritize cultivars to grow on the farms (Table 4). Cultivars lacking these attributes can be selected against, thus over long periods of farmers’ selection; these criteria could greatly influence Musa diversity on-farm. On the contrary, ability of Musa plants to mature early and the ability of mats to perpetuate for a long period were the most important selection criteria for the roasting cultivars. Banana producing areas of Rwanda are dominated by high altitudes that are unfavorable to plantain cultivation. Only 13% of the respondents reported cultivar loss in the study. Only AAA dessert and ABB ‘Kayinja types were reported to be lost. Fusarium wilt is mainly responsible for the loss of the dessert banana varieties (‘Kameramasenge’, ‘Gisukari’ and ‘Gros Michel’) and the ABB beer banana ‘Kayinja’, while Xanthomonas wilt has devastated numerous plantations with predominantly ABB ‘Kayinja’ beer types in the Western province of Rwanda. For example, Musa ABB beer type ‘Kayinja’ dominated systems are susceptible to insect mediated floral infections (Addis et al., 2004; Blomme et al., 2005).
CONCLUSION
Cultivar diversity (richness and evenness) varied across the agro-ecologies of Rwanda in addition to being on decline or under threat. Over 48% of the cultivars had a low diversity index and those of local cultural value could be vulnerable to genetic erosion. A decline in cultivar evenness was observed in Rusizi
district previously reported to have higher cultivar evenness. There is likelihood that the Government of Rwanda’s policy of crop regionalization is taking root and has an impact on Musa diversity. An in depth understanding of the community values of the individual cultivars with low diversity and the conservation ex-situ
of those of low community importance is recommended. The study further confirmed the importance of banana beer production in the country, a factor that can promote diversity of beer cultivars in Rwanda. Cooking cultivars however, dominated in the Eastern province district of Kirehe. The study clearly demonstrated that banana cultivar selection in Rwanda is market/end use driven. Taste/flavor, bunch size, and market demand are the most important criteria for banana cultivar selection and thus greatly influence cultivar conservation and distribution on-farm. These criteria are important to follow while breeding or
introducing new materials in this region. Diseases were perceived to greatly contribute to genetic erosion and thus affect Musa diversity on-farm. Fusarium wilt is mainly responsible for the loss of the dessert banana varieties (AAB ‘Kamaramasenge’, AAA-EA Red Banana ‘Gisukari’ and AAA ‘Gros Michel’) and the ABB beer banana ‘Kayinja’, while Xanthomonas wilt has devastated numerous plantations with predominantly beer types in the Western province. Strategies for managing these diseases are critical in the prevention of the genetic erosion of the affected cultivars.
ACKNOWLEDGEMENTS
The Directorate General for Development, Belgium who provided the necessary funding for this study is gratefully acknowledged. We would also like to thank the Rwandan Agricultural Research Institute, (ISAR)
Rubona for participating in the survey work. Finally, the authors also gratefully acknowledge the farmers of the five districts of Rwanda who provided the information used in this study.
REFERENCES
AATF [African Agricultural Technology Foundation], 2009. Feasibility Study on Technologies for Improving Banana for Resistance Against Bacterial Wilt in Sub-Saharan Africa. Nairobi,
Kenya.
http://aatf-africa.org/userfiles/Banana_Bacterial_Wilt_Fe asibility_Study.pdf (Accessed on 01 August, 2013).
Baart F, 1993. Montagnes d’Afrique. Terres paysannes. Le cas du Rwanda. Centre d’études de géographie tropicale. Presses Universitaires de Bordeaux. Espaces tropicaux No. 7. Bellon M, Pham J-L, Jackson MT, 1997. In Plant
Genetic Conservation: The In Situ Approach, eds Maxted, N., Ford-Lloyd B.V., Hawkes, J.G (Chapman and Hall, London), pp. 261-289. CIALCA, 2008. Final Report Phase I – January 2006 –
December 2008. Progress Report 5. pp. 8-9.
Colwell RK, 2009. Biodiversity: concepts, patterns, and measurement. Levin SA, Carpenter SR, Godfray HCJ, Kinzig AP, Loreau M, Losos JB, Walker B, Wilcove DS (Editors). The Princeton Guide to Ecology. Princeton University Press, Princeton, New Jersey, USA. Pp. 257-263. Delepierre G, 1974. Les Regions Agricoles du Rwanda.
Note technique 13. ISAR, Butare.
Dyke FV, 2008. Conservation Biology: Foundations, Concepts and Applications. 2nd edn. Springer, St. Louis, Illinois.
FAOSTAT, 2008. Food and Agriculture Organization, online statistical database. Available at:
http://faostat.fao.org/site/339/default.aspx
(accessed on the 20th November, 2012).
Fowler C and Hodgkin T, 2005. Plant genetic resources for food and agriculture; assessing global availability. Annual Review of Environment Resources 29:10.1-10.37.
Gaidashova SV, Okech SHO, Gold CS, Nyagahungu I, 2005. Why beer bananas? The case for Rwanda. Agricultural policy. InfoMusa, 14(1): 2-6.
Gauchan D, Smale M, Maxted N, Cole M, Sthapit RB, Jarvis D, Upadhyay PM, 2005. Socioeconomic and Agroecological Determinants of Conserving Diversity On-farm: The Case of Rice Genetic Resources in Nepal. Nepal Agricultural Research Journal 6: 89-98.
Hurlbert SH, 1971. The nonconcept of species diversity: a critique and alternative parameters. Ecology 52(4), 577-586.
IMB Corporation, 2008. SPSS statistics 17.0
Jagwe J, Ouma E, van Asten P, Abele S, 2008. Banana marketing in Rwanda, Burundi and South Kivu. CIALCA project survey report.
Jost L, 2006. Entropy and diversity. Oikos 113: 363-375.
Kagame A, 1972. Un Abrégé de l’Ethno-histoire du Rwanda Tome premier. Université Nationale du Rwanda. Collection ‘Muntu’. pp. 79. Kangasniemi J, 1998. Peoples and bananas on steep
slopes: Agricultural intensification and food security under demographic pressure and
environnemental degradation in Rwanda. PhD dissertation. Michigan State University. East Lansing, Michigan. Web accessible at:
http://fsg.afre.msu.edu/rwanda/1998_Dec_Kan gasniemi_People_n_Bananas.pdf. Accessed on 17 January 2014.
http://www.aec.msu.edu/agecon/fs2/rwanda/1998 Dec Kangasniemi People n Bananas .pdf
Karamura D, Mgenzi B, Karamura E, Sharrock S, 2004. Exploiting IK for the management and maintenance of Musa biodiversity on farm. African Crop Science Journal 12(1): 71-78. Karamura E, Frison E, Karamura DA, Sharrock S,
1998. Banana production Systems in Eastern and Southern Africa. In: Picq C, Foure E, and Frison EA, Bananas and food security, INIBAP, Montpellier, ISBN 2-910810-36-4. Pp. 401-412.
Lassoudière A, 1989. Enquete diagnostique sur la culture bananière en préfecture de Kibungo. Vol.1, ISAR-IRFA-CIRAD.
Lufafa A, Tenywa AM, Isabirye M, Majaliwa MJG, Woomer PL, 2003. Prediction of soil erosion in Lake Victoria basin catchment using a GIS-based Universal Soil Loss model. Agricultural Systems 76: 883-894.
Magurran AE, 1988. Ecological diversity and its measurement. Princeton University Press, Princeton, NJ
MINAGRI, 2003. Agenda Agricole. Ajenda Y’Ubuhinzi. MINAGRI-UE, Kigali.
Mpyisi E, Nyarwaya JB, Shyiringiro E, 2000. Statistiques Agricoles: Production Agricole, Elevage, Superficies et Utilisation des Terres. Ann`ee Agricole 2000. MINAGRI-FSRP-USAID.
Nantale G, Kakudidi EK, Karamura D, Karamura E, Soka G, 2008. Scientific basis for banana cultivar proportion on-farm in East Africa. African Crop Science Journal, 16(1): 41-50. Nsabimana A and van Staden J, 2005. Characterisation
of the banana germplasm collection from Rubona – Rwanda. Scientia Horticulturae 107: 58-63.
Nsabimana A, Gaidashova SV, Nantale G, Karamura D, Van Staden J, 2008. Banana cultivar distribution in Rwanda. African Crop Science Journal. 16(1): 1-8.
Okech SHO, Gaidashova SV, Gold CS, Gatarayiha C, Ragama P, 2002. Banana pests and diseases in Rwanda: A Participatory Rural Appraisal and Diagnostic Survey observations. In: Proceedings of the Integrated Pest Management Symposium, 8 to 12 September 2002, Kampala. Adipala et al. (EDs.). NARO/ Makerere University, Kampala, Uganda. Pp. 162-167.
Okech SHO, Gaidashova SV, Gold CS, Nyagahungu I, Musumbu JT, 2005. The influence of socio-economic and marketing factors on banana production in Rwanda: Results from a Participatory Rural Appraisal. International Journal of Sustainable Development and World Ecology 12(2): 149-160.
Robinson JC and Galán Saúco V, 2010. Bananas and Plantains. CAB Intl, Wallingford. 2: 1-17
Sebasigari K, 1985. Overview of banana cultivation and constraints in the Economic Community of the Great Lakes States (CEPGL). In: Kirby R and Ngendahayo D (Editors), Banana production and research In eastern and central Africa. Proceedings of a Regional Workshop held in Bujumbura, Burundi 14-17 December 1983. IRAZ/ IDRC. IDRC-MR114e. Pp. 9-22.
Ssebuliba R, Talengera D, Makumbi D, Namanya P, Tenkouano A, Tushemereirwe W, Pillay, M, 2005. Reproductive efficiency and breeding potential of East African highland (Musa AAA– EA) bananas. Field Crops Research 95(2-3): 250-255.
Verdoodt A and Van Ranst E, 2003. A large-scale land suitability classification for Rwanda. In: Land Evaluation for Agricultural Production in the Tropics. Laboratory of Soil Science, Ghent University, Belgium.