UNIVERSITÉ DE MONTRÉAL
ROBUST PRE-CLINICAL SOFTWARE SYSTEM FOR REAL TIME NIRS AND
EEG MONITORING
MAHYA DEHBOZORGI INSTITUT DE GÉNIE BIOMÉDICAL ÉCOLE POLYTECHNIQUE DE MONTRÉAL
MÉMOIRE PRÉSENTÉ EN VUE DE L’OBTENTION DU DIPLÔME DE MAÎTRISE ÈS SCIENCES APPLIQUÉES
(GÉNIE BIOMÉDICAL) DÉCEMBRE 2014
UNIVERSITÉ DE MONTRÉAL
ÉCOLE POLYTECHNIQUE DE MONTRÉAL
Ce mémoire intitulé:
ROBUST PRE-CLINICAL SOFTWARE SYSTEM FOR REAL TIME NIRS AND EEG MONITORING
présenté par : DEHBOZORGI Mahya
en vue de l’obtention du diplôme de : Maîtrise ès sciences appliquées a été dûment accepté par le jury d’examen constitué de :
M. COHEN-ADAD Julien, Ph. D., président
M. SAWAN Mohamad, Ph. D., membre et directeur de recherche M. POULIOT Philippe, Ph. D., membre et codirecteur de recherche Mme CHERIET Farida, Ph. D., membre
DEDICATION
ACKNOWLEDGEMENTS
The work accomplished in this thesis would not have been possible without the support and encouragement of many. I would like to express my sincere gratitude to my supervisor, Professor Mohamad Sawan, for providing me the opportunity to be part of his research team and the multidisciplinary project which met my interest for biomedical applications. His expertise, guidelines and motivations along the way made this journey a pleasant experience.
My appreciation also extends to my co-supervisor, Dr. Philippe Pouliot, for his valuable advice, patience and timely suggestions at every stage. His constant availability and positive feedback always clarified the path and was a constant source of motivation.
Special thanks to the collaborators of the Imaginc project, in particular Mrs. Phetsamone Vannasing and Ali Kassab at Sainte-Justine Hospital. They have provided valuable feedback and suggestions on my work and offered a unique opportunity to gain insight from a medical perspective. This work has been funded by the Heart and Stroke Foundation and Canadian Institute of Health Research.
I would also like to take this opportunity to thank my various colleagues and staff members at PolyStim who have provided a memorable and cheerful experience during my time. Special thanks to Jerome Le Lan, for his collaboration and help all throughout the project. Thanks to Nadia, Ghazal, Sina and Elie for the friendly and stimulating lab environment. It has been a pleasure working with all of you.
My deepest love and appreciation goes to my family and friends for their continuous love and support. Their confidence in me and has been invaluable to the completion of this thesis, and have always been there for me in moments of doubt.
RÉSUMÉ
Ce mémoire présente la conception et l’implémentation d’un logiciel dédié au support d’un système bimodal NIRS et EEG d’imagerie cérébrale en temps réel. En effet, l’accès à l’information en temps réel concernant l’activité cérébrale est un facteur important permettant la détection de tout changement au niveau cortex du cerveau à un stade précoce. Or, les logiciels actuellement disponibles comparables à celui présenté ici n’offrent qu’une possibilité d’ajustement limitée des paramètres en temps réel ainsi que peu de fonctionnalité permettant l’analyse rapide et efficace des données.
Le travail présenté dans ce présent mémoire a été réalisé au sein du groupe IMAGINC. Un groupe de recherche multidisciplinaire ayant comme objectif le développement d’un système d’imagerie cérébrale portatif, non invasif et sans-fil permettant d’imager le cortex entier en temps réel. Le module d’acquisition de données de ce système enregistre l’information de 128 canaux NIRS et 32 canaux EEG ainsi que différents accéléromètres et canaux analogiques le tout par l’entremise d’optodes et d’électrodes placées sur un casque d’enregistrement. Ces données sont ensuite envoyées par un lien de communication sans-fil au logiciel qui recueille et affiche l’état hémodynamique du sujet par l’entremise de son interface graphique. Il est ensuite possible de choisir différentes vues des cartes 2D du cerveau sur lesquelles les changements hémodynamiques sont présentés. La surveillance à distance de l’état du sujet est aussi possible puisque ces données peuvent être retransmises vers un autre ordinateur par un lien sans-fil. De plus, de par son interface graphique conviviale et intuitive, l’usager peut facilement ajuster différents paramètres de test tout au long de l’acquisition de données sans même l’interrompre. Dans le but d’optimiser les paramètres pour chaque sujet, une fonction de calibration automatique ajustant l’intensité d’illumination de chacun des émetteurs en quelques secondes a été implémentée. Pour faciliter le processus de test, il est possible de télécharger des fichiers (bipolaire et montage référentielle) contenant des paramètres de configurations préétablies pour le NIRS et l’EEG. Enfin, il est possible de faire une analyse automatique et rapide de l’état de tous les canaux NIRS durant les tests afin d’assurer une bonne connexion ainsi que la validité des données. Le système conçu est en mesure d’enregistrer et de traiter des données en temps réel sur une période de 24 heures. Les résultats obtenus ont été validés en utilisant des logiciels d’analyse de données NIRS similaires durant des tâches de finger tapping induisant un changement hémodynamique chez les sujets.
ABSTRACT
This master’s thesis presents the design and implementation of a real-time software system to support a bimodal NIRS and EEG brain imaging device. Real-time information on brain activity is an important factor in early detection and diagnosis at the top level of the cortex of various brain disorders. Current software systems provide limited real-time parameter adjustment and automated features for quick and easy analysis.
The project presented in this master’s thesis is part of the multidisciplinary IMAGINC research group, with the objective of developing a wireless, non-invasive and portable brain imaging system that allows imaging of the whole cortex in real time. The hardware system is capable of recording data from 128 NIRS and 32 EEG channels, as well as additional accelerometer and analog channels through the optodes and electrodes mounted onto the helmet. The software system acquires the real-time data from the hardware module using a wireless connection and displays the hemodynamic variations on the user interface. The change in hemodynamic activity is displayed on a 2D map of the brain, with selection of different views. Remote monitoring is also possible since the data can be transferred wirelessly to another computer. Through the user-friendly and intuitive user interface, the user can control and adjust various test parameters throughout the acquisition without any interruption. In order to achieve maximum illumination setting for individual subjects there is an automatic calibration function that quickly adjusts the illumination intensity for each of the emitters in just a few seconds. Previously defined NIRS and EEG configuration files (bipolar and referential montage) can be uploaded for easy testing. An automated analysis feature quickly analyzes and reports the status of all NIRS channels during the test to ensure good connection and valid results. The designed system can successfully record and process data for a continuous period of up to 24 hours. The results have been validated using similar NIRS data analysis software during figure tapping tasks and the hemodynamic variations were as expected.
TABLE OF CONTENTS
DEDICATION ... III ACKNOWLEDGEMENTS ... IV RÉSUMÉ ... V ABSTRACT ... VI TABLE OF CONTENTS ...VII LIST OF TABLES ... X LIST OF FIGURES ... XI LIST OF SYMBOLS AND ABBREVIATIONS... XIII
CHAPTER 1 INTRODUCTION ... 1
1.1 Near Infrared Spectroscopy ... 2
1.1.1 Theory and principles ... 2
1.2 Electroencephalography ... 8
1.3 Combined EEG and NIRS... 9
1.4 Other NIRS system factors ... 10
1.4.1 Helmet ... 10
1.4.2 Wavelengths and light source ... 11
1.5 Software overview ... 12
1.5.1 Software requirements ... 13
1.6 Conclusion ... 16
CHAPTER 2 LITERATURE REVIEW ... 18
2.1 NIRS-EEG acquisition systems ... 19
2.1.2 Software comparison ... 21
2.2 Portable NIRS devices ... 24
2.3 Software architecture models ... 27
2.3.1 Client-Server architecture ... 28
2.3.2 Layered Architecture ... 29
2.3.3 Model-View-Controller architecture ... 30
2.4 Conclusion ... 31
CHAPTER 3 SOFTWARE DESIGN AND IMPLEMENTATION ... 32
3.1 Feasibility ... 32 3.2 System requirements ... 32 3.3 System models ... 34 3.4 Software architecture ... 37 3.4.1 LabVIEW program ... 40 3.4.2 Matlab program ... 49
3.4.3 Hardware communication Layer ... 51
3.5 User interface ... 53
3.5.1 LabVIEW GUI ... 54
3.5.2 Matlab GUI ... 60
CHAPTER 4 EXPERIMENTS AND VALIDATION ... 63
4.1 Processing algorithm and test protocol ... 63
4.2 Software metrics ... 71
4.2.1 System testing ... 72
4.2.2 System complexity ... 73
CHAPTER 5 GENERAL DISCUSSION AND FUTURE WORK ... 78 CONCLUSION ... 83 BIBLIOGRPAHY ... 86
LIST OF TABLES
Table 2.1: Characteristics of NIRS-EEG devices ... 19 Table 2.2: Commercial NIRS devices characteristics. Adapted from (Scholkmann et al., 2014) . 26 Table 3.1: Format of emitter and detector coupling at two wavelengths ... 50 Table 4.1: Pearson correlation coefficient for each channel of subject 8 processed using all data
points. ... 67 Table 4.2: Average correlation coefficient across all channels for each subject processed using all
data points ... 67 Table 4.3: Comparison of results obtained for HbO and HbR for calculations of blocks of data.
All reported mean values (R2, RMSE and MAE) are across all channels for each subject. .. 70 Table 4.4: Average response time of system to different operations. ... 72
LIST OF FIGURES
Figure 1.1: Absorption spectra of HbO and HbR in the near infra-red region ... 3
Figure 1.2: Light travel path between the emitter and detector. The light is emitted from the emitter, travels through the tissue and is received at the detector ... 4
Figure 1.3: Various tissues of the human scalp ... 5
Figure 1.4: Illustration of the three different NIRI techniques from (Scholkmann et al., 2014) ... 8
Figure 1.5: EEG sensing device from Neuroscan ... 9
Figure 1.6: Different NIRS head caps. a) patch b) helmet. Images obtained from (Kassab, 2014) ... 11
Figure 1.7: Requirements engineering cycle ... 14
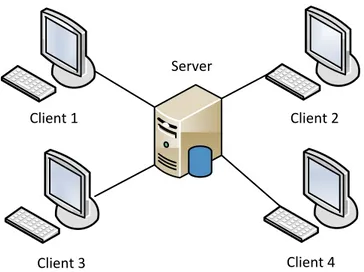
Figure 2.1: Client-server architecture ... 28
Figure 2.2: Three tier architecture model ... 29
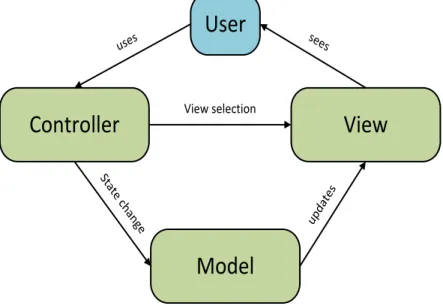
Figure 2.3: MVC model components and interactions ... 30
Figure 3.1: State diagram of IMAGINC system ... 34
Figure 3.2: UML use case diagram for the IMAGINC system ... 37
Figure 3.3: Layered architecture of the IMAGINC software ... 39
Figure 3.4: Different states of the workflow manager ... 43
Figure 3.5: 10-20 standard EEG probe placement ... 47
Figure 3.6: Processing algorithm of raw data performed in Matlab GUI ... 49
Figure 3.7: Various components of the Imaginc system. 1: Control Module, 2: Illuminators, 3: Detectors, 4: Bluetooth dongle, 5: EEG ports and electrodes, 6: Accelerometers, 7: Helmet ... 53
Figure 3.8: Interactions of the GUI with other components ... 54
Figure 3.10: Configuration window ... 56
Figure 3.11: NIRS window ... 56
Figure 3.12: EEG window ... 57
Figure 3.13: EEG montage window ... 58
Figure 3.14: Auxiliary data window ... 59
Figure 3.15: ViewData window ... 59
Figure 3.16: Matlab GUI ... 60
Figure 3.17: Absorption spectra of HbO and HbR based on values specified in reference 1 ... 62
Figure 4.1: Emitter-detector placement in the finger tapping test. Image obtained from (LeLan, 2013) ... 64
Figure 4.2: Finger tapping protocol details. Each test consists of 10 blocks of 30 seconds of finger tapping interleaved with 15 seconds of rest. Each test starts and ends with a 60 second resting period. ... 64
Figure 4.3: HbO values for all channels of subject 8. The results of HomER are shown in red and the results processed by our program are shown in blue. The x-scale has units of time(s) and the y-scale has units of dConcentration (Molar). ... 65
Figure 4.4: HbR values for all channels of subject 8. The results of HomER are shown in red and the results processed by our program are shown in blue. The x-scale has units of time(s) and the y-scale has units of dConcentration (Molar). ... 66
Figure 4.5: Block processing for one channel of subject 8. a) HbO curves for both HomER and our program (R2 = 0.8911) b) HbR curves for both HomER and our program (R2 = 0.9540) ... 68
Figure 4.6: HbO and HbR for one channel of subject 8 with rest/activation blocks. Top figure shows the entire test session (570 seconds). Bottom figure shows the results from time 0 – 150 seconds. ... 69
LIST OF SYMBOLS AND ABBREVIATIONS
ADC Analog-to-digital converter APD Avalanche photodiode BCI Brain computer interface CBF Cerebral brain flow
CW Continuous wave
DLL Dynamic link library
DPF Differential path length factor EEG Electroencephalography
fMRI Functional magnetic resonance imaging fNIR Functional near infrared imaging GUI Graphical user interface
HbO Oxy-hemoglobin HbR Deoxy-hemoglobin HbT Total hemoglobin LED Light emitting diode
MBLL Modified Beer-Lambert law MVC Model-view-controller NIRS Near infrared spectroscopy
PC Personal computer
PVF Partial volume factor SNR Signal-to-noise ratio
UART Universal asynchronous receiver/transmitter
UI User interface
CHAPTER 1
INTRODUCTION
The human brain is a complex structure which has been studied for the past centuries in order to understand the underlying mechanism and to better comprehend the chain of reactions. The human nervous system and the brain primarily consist of millions of neurons, organized in networks. All mental activity and motor tasks are the results of electrical signals passing between the axons of neighboring neurons. This message is passed from the brain to the desired organ and vice versa, in order to accomplish a task. In a healthy brain, this communication is performed quickly and automatically. However in the case of a neurological disease, the normal path of information is interrupted and can lead to devastating results. Over one billion people worldwide suffer from neurological disorders which includes degenerative diseases (such as Parkinson’s and Alzheimer’s disease), cerebrovascular diseases (such as such as stroke and vascular disorders) and convulsive disorders (such as epilepsy) just to name a few.
Monitoring and diagnostic devices are becoming increasingly important tools in detecting various health disorders and treating patients to prevent and minimize the side effects. They provide a valuable source of information for the investigation of developmental cognitive neuroscience and a potential factor in the advancement of our understanding of the brain’s function and mal function. Of the various existing brain imaging technologies, such as MRI, CT and PET scan, EEG and TDC/ECD (transcranial/extracranial Doppler sonography), Near Infrared Spectroscopy (NIRS) imaging is gaining popularity due to its ability to continuously monitor cerebral activity in an unconstrained environment at the patient’s bedside, while providing an inexpensive solution. It is a practical tool in both research and clinical settings, from psychology and neurology units to the treatment of cerebrovascular diseases, epileptic disorders and severe brain injury (Obrig, 2014). Our aim is to develop a brain imaging device that will help us to better understand the ongoing cerebral activity. The developed system consists of a signal acquisition prototype, a helmet which holds the optodes and electrodes, and the software system to support the device. The current hardware system is a multi-channel brain imaging system based on NIRS and Electroencephalography (EEG) techniques. Both of these modalities are portable and relatively inexpensive. NIRS is a non-invasive neuroimaging technique that measures changes in cerebral blood oxygenation associated with brain activity while EEG measures the electrophysiological changes on the scalp. The supporting user interface displays
the acquired information to the clinician for diagnostic purposes. In order to provide instant feedback, the acquired data is displayed in real-time, and allows for changes to the acquisition parameters during the recording. It is easy to use while allowing for control and modification of various parameters based on the specific test and subject. The combination of the hardware and software system will serve as a tool for long term clinical monitoring of patients with various neurological disorders. Subjects can easily wear the portable device on their belt while having mobility to freely move around. This can also help in reducing their physical and psychological stress that accompanies long term test sessions. A clinical neurologist can easily collect the data through the shared network and perform real time analysis from his/her personal computer.
The rest of this chapter concerns the theoretical aspects of NIRS and EEG technology and a brief overview of the software development stages and requirements that are the basis for this project.
1.1 Near Infrared Spectroscopy
1.1.1 Theory and principles
NIRS is a brain imaging technique that measures the physiological events associated with brain activity while performing various tasks. The primary component of red blood cells are the protein called hemoglobin. It is responsible for oxygen transfer from the lungs to the various organs, including the brain and vice versa. Hemoglobin is available in two main forms, oxygenated (HbO) and reduced (HbR). When an area of the brain is activated, resulting in neuronal activity, there is an increase in metabolic demand for oxygen. As a result, the cerebral blood flow (CBF) to the active region increases. There is an early decrease in HbO followed by a long lasting increase in oxy-hemoglobin. As a result there is a direct correlation between local changes of HbO and HbR concentration and brain activity.
The main concept underlying NIRS is the difference in absorption characteristics of oxygenated and deoxygenated hemoglobin when exposed to IR (infrared) and red light. Figure 1.1 shows the spectroscopic and absorptive properties of oxygenated and deoxygenated hemoglobin in the near infra-red region. In the optical window from 650 – 900 nm (NIR region), the absorption coefficients of HbO and HbR intersect at 805 nm, which is the isosbestic point (Koizumi et al., 2003; Zijlstra et al., 2000). The reason for choosing this optical window is that
NIR light can penetrate through skin and bones fairly easy in this range. Light below this range is mostly absorbed by hemoglobin, and light above this range is mainly absorbed by water. Using these principles, infrared light passes through the brain tissue and the diffuse reflectance is measured from the tissue a few centimeters apart from the emitting source(Ferrari et al., 2004; Ferrari et al., 2012; Giacometti et al., 2013; Wolf et al., 2007).
Figure 1.1: Absorption spectra of HbO and HbR in the near infra-red region
By passing light at different wavelengths through the brain tissue and based on the difference in the absorption spectrum of HbO and HbR, we can measure the relative changes of hemoglobin concentration based on the modified Beer-Lambert law (MBLL) (Delpy et al., 1988). In our system, we use two wavelengths of light, at 735 and 850 nm, in order to have one above and one below the isosbestic point to be able to differentiate the two chromophores. The recorded activity at the path between one emitter and one detector is referred to as one “channel”. With multiple source-detector pairs covering the entire scalp, we can observe the changes simultaneously in all regions of the brain. In our system, there are 32 light sources and 32 detectors. Each light source can be coupled with 4 detectors, for a total of 128 channels at each of the two wavelengths.
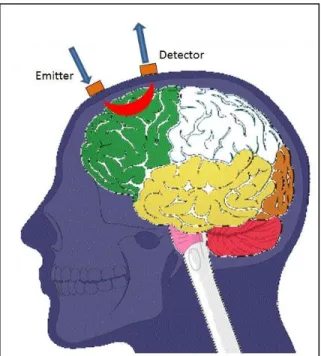
Figure 1.2 shows a typical placement of emitters and detectors in a NIRS system. The light emitted from the source travels in a banana shape path through the tissue and reaches the detector. By increasing the distance between the source and detector we can obtain information
about the hemodynamic response in deeper tissues of the brain (Fukui et al., 2003). However this distance varies based on the initial light intensity and age of patients (adults vs. infants), as well as the amount of absorbed light (Scholkmann et al., 2013).
It has been shown that an emitter-detector separation of 2 cm is sufficient for imaging the infant cortex (Duncan et al., 1995; Taga et al., 2003). Various existing devices use an inter-optode distance of 3 cm for the adult cortex (Van der Zee et al., 1992). Similarly in our device we have set the emitter and detector separation at 3 cm. The light penetration depth is around half the physical distance, which is 1.5 cm.
Figure 1.2: Light travel path between the emitter and detector. The light is emitted from the emitter, travels through the tissue and is received at the detector
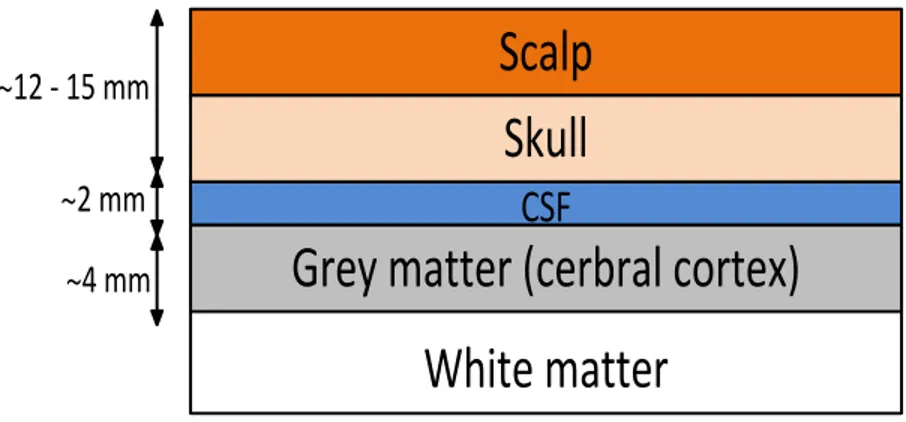
The brain consists of several layers of tissue, which absorb part of the illuminated light. Therefore only a small portion of the injected light reaches the detector and is conveyed to the measuring device. Light attenuation is due to absorption and scattering within the tissue, both for the entering and exiting light. Figure 1.3 shows the different layers of the human head that light must penetrate through.
Scalp
Skull
White matter
CSF
Grey matter (cerbral cortex)
~12 - 15 mm~2 mm ~4 mm
Figure 1.3: Various tissues of the human scalp
It was first demonstrated in 1977 by Jobsis that by measuring the light intensity observed at the detector, we can calculate the changes in hemoglobin concentrations using the Beer-Lambert law (Jobsis, 1977). The Beer-Beer-Lambert law relates the light intensity of emitted and detected light with changes in hemoglobin concentrations (Boas et al., 2004; Duncan et al., 1995). Assuming that the material is a homogenous substance, we can determine the amount of light absorption using the following equation:
𝐴 = 𝑙𝑜𝑔10𝐼0
𝐼 = 𝛼 ∙ 𝑐 ∙ 𝑙 , 𝛼 = 4𝜋𝑘/𝜆 (1.1) where 𝐴 is the attenuation, 𝐼0 is the incident light intensity and 𝐼 is the measured light intensity at the detector. In other words, the attenuation is proportional to the absorption coefficient of the chromophores, which is hemoglobin, the physical distance 𝑙 between the source and detector, as well as the concentration of the substance, 𝑐. The absorption coefficient 𝛼 is measured using the extinction coefficient at the specific wavelength 𝜆 which is determined from the literature. While this law provides a simple means of relating the light absorption to the chemical concentration of the substance, it only holds as long as the photons of the light source are either completely absorbed or transmitted in a straight line through the matter. However due to the highly scattering nature of brain tissue, there will inevitably be loss of light and the photons will travel a longer path length through the tissue. Thus it does not hold true for measurements of the brain tissue (Boas et al., 2001; Obrig et al., 2003).
In order to apply it to brain oxygenation, we must include an additive term to account for scattering losses, as well as the change in path length. The modified Beer-Lambert law is defined as:
𝐴 = 𝛼 ∙ 𝑐 ∙ 𝑙 ∙ 𝐷𝑃𝐹 + 𝐺 (1.2) where 𝐷𝑃𝐹 is the differential path length factor, which accounts for the longer path length due to scattering. The value of 𝐷𝑃𝐹 can be determined from experimentally derived studies in a non-homogenous solution based on Monte-Carlo simulations in a way which the key measurement is the change in transmitted light intensity (Duncan et al., 1995; Hemmati et al., 2012; Hiraoka et al., 1993). It has been found to be dependent on age, gender and wavelength of lights, and varies for different tissue (Essenpreis et al., 1993). The term 𝐺 is an additive scalar term for the measure of the signal loss due to scattering and is unknown. In our application which is continuous wave (CW) NIRS we are interested in the changes in concentration, and not the absolute values. Therefore under this assumption of constant light scattering the term 𝐺 cancels out when calculating the difference in attenuation for HbO and HbR. The changes in light absorbance can be calculated as follows:
𝛥𝐴 = 𝛼 · 𝛥𝑐 ∙ 𝑙 ∙ 𝐷𝑃𝐹 (1.3) When the tissue is illuminated at two different wavelength, λ1 and λ2, we can derive the following set of equations:
𝛥𝐴(𝜆1) = 𝑙 ∙ 𝐷𝑃𝐹(𝜆1)(𝛼𝐻𝑏𝑂𝜆1 𝛥𝑐𝐻𝑏𝑂 + 𝛼𝐻𝑏𝑅𝜆1 𝛥𝑐𝐻𝑏𝑅 ) (1.4) 𝛥𝐴(𝜆2) = 𝑙 ∙ 𝐷𝑃𝐹(𝜆2)(𝛼𝐻𝑏𝑂𝜆2 𝛥𝑐𝐻𝑏𝑂 + 𝛼𝐻𝑏𝑅𝜆2 𝛥𝑐𝐻𝑏𝑅 ) (1.5)
Hence we have a set of 2 equations with 2 unknowns, and solving for 𝛥𝑐𝐻𝑏𝑂 and 𝛥𝑐𝐻𝑏𝑅 , we have: [𝛥𝑐𝛥𝑐𝐻𝑏𝑂 𝐻𝑏𝑅 ] = [ 𝛼𝐻𝑏𝑂𝜆1 𝛼 𝐻𝑏𝑅𝜆1 𝛼𝐻𝑏𝑂𝜆2 𝛼 𝐻𝑏𝑅𝜆2 ] −1 [ 𝛥𝐴(𝜆1) 𝑙∗𝐷𝑃𝐹(𝜆1) 𝛥𝐴(𝜆2) 𝑙∗𝐷𝑃𝐹(𝜆2) ] (1.6)
Thus we are able to calculate the change in concentration for each of the HbO and HbR values in units of µmolars. Total hemoglobin concentration, 𝛥𝑐𝐻𝑏𝑇 , is the sum of the previous two values:
𝛥𝑐𝐻𝑏𝑇 = 𝛥𝑐𝐻𝑏𝑂 + 𝛥𝑐𝐻𝑏𝑅 (1.7) This method is based on CW-NIRS instruments. The term continuous defines that the result is based solely on the light intensity measurement at the detector. Using this method, we cannot
determine the absolute concentrations and the results obtained are relative. If the value of 𝐷𝑃𝐹 is determined, we can calculate the absolute concentrations. In contrast to CW NIRS, there are time and frequency domain techniques, which in addition to the light intensity also measure the time of flight and phase shift in order to determine the absolute value of hemoglobin concentration (Pellicer et al., 2011; Wabnitz et al., 2010). The details of these methods are discussed in the next section.
Time domain NIRS
In time domain NIRS technology, in addition to the intensity it also measures the time-of-flight, which is the time required for the injected light to travel through the tissue. Short pulses of light are injected into the tissue and the attenuation is measured by a single photon counting detector that measures the arrival time of the photons. As a result we can characterize the absolute optical properties of the brain tissue (light scattering and absorption coefficients), and calculate the absolute values of HbO and HbR. Other advantages include higher spatial resolution and penetration depth. However the drawbacks are the cost, lower sampling rate (temporal resolution in the sub-nanosecond scale), instrument size and weight.
Frequency domain NIRS
In frequency domain NIRS devices, the emitted light is modulated and sent through the tissue. At the detector the light intensity, phase shift and modulation depth is measured, and similar to time-domain NIRS, the corresponding time of flight is obtained. The advantages of frequency domain NIRS include the high sampling rate (temporal resolution at frequencies up to nearly 1 GHz) and absolute value calculation of the optical properties, as well as precise separation of absorption and scattering effects. However they have limited penetration depth, are more costly and less portable than CW NIRS devices.
Of the three mentioned techniques, time domain NIRS provides the most information about the photon migration through tissue, but at the same time comes with a lower temporal resolution and more complex technology. Figure 1.4 shows a visualization of the three different techniques.
Figure 1.4: Illustration of the three different NIRI techniques from (Scholkmann et al., 2014)
1.2 Electroencephalography
Electroencephalography is a brain imaging technique that measures the neuronal electric activity by electrodes placed on the scalp, or in invasive methods in the cerebral cortex. It was first used by Berger in 1929 to successfully measure the EEG signals from the scalp surface (Haas, 2003; Nunez et al., 2006). The underlying source of this electrical activity is the polarized neurons of various membranes. Constant ion exchange creates an ionic current. When this reaches the electrodes on the scalp, it creates a voltage fluctuation that is measured by the multiple electrodes and sent to the recording device. The measured voltage is relative to a reference electrode which is at a different position than the recording electrode. The midline position is usually used since it does not amplify the signal differently in the two hemispheres. Another common reference point is at the earlobes or mastoids. The resulting measured EEG activity is the summation of the synchronous activity of millions of neurons within the same region; individual neuron activity is too small to measure and thus it is difficult to localize the source of activity.
EEG has a temporal resolution in the range of sub-milliseconds and can be used for real time monitoring applications. However the spatial resolution is generally low. This is due to the fact the underlying neuronal activity must pass through several layers including the skull, CSF and other layers of tissue between the cortex and electrodes. In conventional EEG sessions, the electrodes are fixed to the patients scalp using conductive paste to ensure direct contact with scalp. The electrodes are either embedded into a helmet, or individually wired. Figure 1.5 shows an EEG cap with multiple electrodes.
Figure 1.5: EEG sensing device from Neuroscan
Patient movement can generate artifacts that alter the signals. Sweating and loose electrode connections can also affect the EEG signal quality. If the ground electrode has a bad connection it can cause 50/60 Hz artifacts due to the power system’s frequency. These factors need to be taken into consideration in order to obtain a stable and artifact-free signal. Typically the EEG signals are amplified and noise-reduction techniques are applied to minimize the unwanted effects, through high common mode rejection and low amplifier noise. In video EEG, the subject activity is also recorded as a video, to help in continuous monitoring so the staff can respond immediately if there are any abnormalities observed. Our system can be used with up to 32 EEG electrodes placed on various points on the scalp. The electrical activity is measured and sent to the prototype for further signal processing and noise cancelation.
1.3 Combined EEG and NIRS
Each of the mentioned techniques measure different and independent parameters of brain activity, however the relationship between them is not well understood. EEG is a well-established technique that measures the electrical activity along the surface of the scalp. We can monitor electrical activity in the range of milliseconds, providing an excellent temporal resolution. However the spatial resolution is relatively low. NIRS measures local concentration changes of HbO and HbR. The spatial resolution depends on distance between the source-detector pairs, hence in the order of centimeters. In contrast with EEG which is relatively ineffective at
differentiating specific regions, NIRS provides a more precise localization of brain activity and a higher spatial resolution. Both techniques provide a temporal resolution in the order of milliseconds, with EEG providing a slightly higher resolution.
Thus EEG and NIRS provide complementary information on electrical and local hemodynamic brain activity, providing more comprehensive information. This multimodal analysis technique has many advantages in research and clinical settings. Since there is no observed interference with the combination of these two methods, it can be used in long-term monitoring sessions which require a compact and portable device (Wallois et al., 2010). Areas of application include prolonged monitoring in epilepsy, brain machine interface and neuropsychological studies. In addition, both techniques are portable and relatively inexpensive.
1.4 Other NIRS system factors
1.4.1 Helmet
There are many solutions for imaging the cortex, some devices use a patch which can be placed on the region of interest (for example frontal cortex) while other systems provide a full helmet that can be placed on the head. A greater number of channels results in a better spatial resolution, but we must also consider the physical space available for the attachment of the optodes, as well as the channel cross talk and interference. Depending on the region of interest for imaging, a patch may be sufficient but full cortex monitoring requires a helmet. Figure 1.6 shows an example of a patch and helmet design.
Figure 1.6: Different NIRS head caps. a) patch b) helmet. Images obtained from (Kassab, 2014) The optodes must be in good contact with the scalp to achieve a good SNR and any hair must be cleared from the path. Another important factor is ambient light that can interfere with the injected light. Thus it is optimal for the helmet (or patch) to be made of an opaque material to minimize this effect. To accommodate various head sizes, the helmet material should have some degree of flexibility. Ideally it should fit the head tight enough to provide a stable connection to avoid movement artifacts without reducing the comfort. In addition, many tests involve monitoring sessions of long durations, thus it should be comfortable and breathable to wear for long periods of time.
1.4.2 Wavelengths and light source
As seen in equation 1.4, in NIRS applications the MBLL equations are solved at two or more discrete wavelengths (Delpy et al., 1988; Kocsis et al., 2006). At any wavelength, the emitted light must be selected from the near-infrared region of the spectrum. As mentioned before, in this optical window most of the emitted light can be detected by the detectors, with minimum absorption by tissue. Thus it is optimal to have maximum illumination to maximize the detected light at the detector and be able to increase the emitter-detector separation. In a portable solution, it is important to choose a light source with minimum weight, size and power consumption. The two most common sources of light used in NIRS applications are laser diodes and LEDs (Scholkmann et al., 2014).
LEDs emit incoherent light whereas laser diodes allow for coherent light emission. The operating range of laser diodes (< 1 nm) is narrower with low divergence compared to LEDs (~35 nm). However adjusting the LED light intensity is easier. While laser diodes can be easily used with fiber optics, their size is bigger compared to LEDs. There are also limiting factors such as tissue heating, patient safety and noise at the detector with laser diodes.
If the illumination power is too high it may cause tissue heating which can be hazardous for the subject and cause discomfort, as well as affecting the measurements (Bozkurt et al., 2005; Ito et al., 2000). In addition, the eye safety of the subject and the person performing the test may also be at risk (Sliney et al., 2005). Lasers can be more dangerous since they offer a higher power illumination compared to LEDs and it is important to follow the safety guidelines to limit the exposure. Another factor is light source fluctuations, which ultimately affects the signal quality at the detector (Zhang et al., 2005).Thus an optimal light source will emit light invariantly over the whole period, avoiding drift effects. This should be considered in the circuit design to minimize the effect.
Since LEDs are available in a wide range of colors, the selection of wavelengths is much more flexible compared to laser diodes. In addition, the cost of LEDs is lower compared to laser diodes. In our system we have used LEDs to provide a cost-effective and portable design.
1.5 Software overview
We can conclude from the previous section that both NIRS and EEG are feasible solutions for real-time systems, due to their high temporal resolution. Thus it is possible to design a software system that handles the acquired signals from the prototype and after signal processing, displays the relevant information to the user. It is important to note that the choice of hardware has been made before the software system and various configurations and settings are already fixed and cannot be changed. We have taken account of the constraints and hardware capabilities. In the next section, we will discuss the various stages involved in software design, from discovering and documenting the requirements to system modeling techniques and implementation.
1.5.1 Software requirements
Software requirements elicitation is an important step in any software engineering project. It is the process of defining the operations the system must perform, as well as identifying the constraints and bottle necks. An incomplete set of requirements may lead to later problems in the design process and they must satisfy all stakeholders. In our project, the end user is the clinical neurologist who will be performing tests and monitoring sessions. Requirements engineering is the set of activities performed to identify the needs, as well as analysis, documentation and validation. The output of this stage is a requirements document, which clearly specifies all the details (Ian, 2011; Lee, 2013).
Requirements can be organized into two main categories: functional and non-functional. Functional requirements are the main functions and tasks the system must fully perform. These are usually clear and depend on the end-users and the type of software developed. User requirements are more abstract, whereas system requirements are more detailed (inputs/outputs of each system is indicated).
Non-functional requirements are the constraints placed on the results of the functional requirements (for example the speed of performing a particular task). In other words, it represents the quality of a system, in terms of accuracy, speed and performance. This set of requirements is not as straight forward and depends on several factors, including the operating environment, the end user, budget constraints and interaction with other hardware/software systems. Regardless of the requirement, it must be clear and understandable to both teams. Goals that are defined too general, usually by the end user, can leave room for personal interpretation of the developer.
Requirements engineering process
The four main activates in the requirements engineering process are: 1. Feasibility study
2. Requirements elicitation 3. Requirements specification 4. Requirements validation
Figure 1.7: Requirements engineering cycle
As seen in figure 1.7, the activities are performed in an iterative process. Each step will be briefly discussed.
Feasibility Study:
The feasibility study for the overall development of the proposed software system has already been done in the initial development phase. However the specific details and specifications, such as choice of development platform, have been decided in the scope of this project.
Requirements Elicitation:
In the requirements elicitation phase, the required tasks/features of the system are derived, based on the shortcomings of existing systems and user feedback. It is common to develop a basic prototype of the specified system in order to better clarify the primary requirements and design phases needed to complete the project. This will ensure that the end-user and developer needs are consistent, complete and unambiguous. This can also include questionnaires, observations and direct feedback from the users. While one requirement may seem intuitive and essential to the user, it is not always easy or efficient to implement.
Common problems that occur during the requirements elicitation phase can be categorized into three main groups: problems of scope, mutual understanding and the changing nature of requirements. Problems of scope arise when the requirements are too broad to establish boundary conditions, or are over-specified and contain unnecessary details. This may lead to ambiguous
and unnecessary conditions that do not reflect the main user needs and are not implementable given the project time constraints. One of the factors that affect our project scope is the existing hardware architecture already in place. While this does not impose any significant limitations but the software must be designed with this factor in mind. Problems from misunderstandings can be due to the various backgrounds of the two teams; common knowledge to one group is not necessarily obvious to the other group. In our project, the end users come from a medical domain, whereas the development team has limited knowledge of the application domain. The user may not understand the limitations involved in adding a new feature or not have full appreciation for the effort required to make what may seem a minor modification. In our project, some of the basic requirements had already been defined through the development of the initial user interface (more details in section 3.4). Many more have been defined and implemented during this project. Another common problem is the volatile nature of requirements. While new changes can be integrated into the system, they must also remain consistent with the program architecture and existing modules. In our software cycle, the program development was completely iterative, meaning that after each set of small changes the prototype was examined by the end user to ensure there are no mistaken assumptions or misinterpreted information.
Requirements Specification:
The next step is the requirements specification. Once all the requirements have been extracted, they need to be documented and structured to clarify all the details. In this stage we also demonstrate that the system requirements have been defined to accurately meet the customer needs.
Requirements Validation:
The final activity is requirements validation. At this point the specified requirements are examined to ensure they are realistic and achievable within the desired time frame. Prioritization can be useful in determining what the most important features are and what details can be implemented in the next product iteration. The end-users can also experiment with the system prototype to see if it satisfies their needs. After defining all the requirements, a software requirements document is written to clearly identify the agreed terms and conditions. Once the requirements have been defined, we can visualize the system in various graphical models. Each
model focuses on a particular aspect of the system, such as the context, interaction structure or timing.
UML (unified modeling language) is a standardized way of modeling software and non-software systems. By using the models we can properly visualize and describe the system in a uniform manner that can be easily understood and is comparable. The current version, UML 2.0, consists of 13 diagram types, which are divided into structure, behavior and interaction diagrams (Ian, 2011). We will only discuss the relevant cases to our design.
Use case diagram:
Use case diagrams are used to develop a graphical and higher-level representation of the system. Each project can be organized into a system, and one or more actors that interact with it. An actor makes a decision, but is not necessarily a human; it can be a computer program or hardware system.
Each use case identifies the interactions between an actor and the system in various scenarios. The system details are not defined, and it is treated as a black box. These scenarios help both teams to better understand how the system functions and validate it by relating it to real application examples. While use cases provide a static and simplified view of the system, they do not capture all the details, such as the performance and timing of a system.
State diagram:
A state diagram describes the state of each object at any given time, as well as the event that triggers a state change and the resulting action. Each state transition is unique. Overall, it shows the end result of the systems behavior.
Activity diagram:
Activity diagrams are similar to state diagrams, in addition to providing information on the flow of events. It shows the dependency of different states, meaning which process needs to be completed before transitioning to the next stage, as well as parallel activities.
1.6 Conclusion
We have discussed the major advantages of NIRS and EEG as non-invasive imaging technologies that allow us to monitor cortical activates in non-clinical settings while performing
daily routines. Due to the high temporal and spatial resolution that both techniques provide, the development of a software system for real time viewing and long term monitoring of brain activity is quite promising.
The theoretical aspects of NIRS and EEG were presented, as well as the benefits and limitations of a dual mode device. In order to define the system requirements, we must have clear and effective communication with the end user to capture all the details required. By providing an early system prototype and various system models, we can identify the requirements early on in the process. In the next chapter a literature review of existing NIRS-EEG imaging systems with similar functionality will be presented. Chapter 3 will discuss the details of the software system, design methods and the software architecture. In chapter 4 we will present and discuss the results obtained using our system, as well as system metrics and measures. The last chapter will conclude with a general discussion of the work accomplished in this project, the limitations and future directions of development.
CHAPTER 2
LITERATURE REVIEW
In recent years the real-time monitoring of NIRS and EEG data has gained attention as a practical tool for brain-computer interfaces (BCIs), various brain disorders including epileptic patients as well as stroke and rehabilitation units (Gallagher et al., 2008; Gallegos-Ayala et al., 2014; Haginoya et al., 2002; Irani et al., 2007; Li et al., 2012; Matthews et al., 2008; Nguyen et al., 2012, 2013; Osharina et al., 2010; Sokol et al., 2000; Soraghan et al., 2008; Strangman et al., 2006; Terborg et al., 2009; Wang et al., 2008; Watanabe et al., 2002). In order to better understand the advantages and disadvantages of the existing strategies, as well as to define the need for a new system, this chapter aims to provide an overview of the most recently developed NIRS/EEG systems with real time data monitoring. There are two aspects to consider: the hardware component and the software platform. As the hardware system becomes more complex, the software platform must also be updated to reflect these changes. However it must still be robust, easy to use and have a modular design to facilitate the integration of new components and modifications. We will consider the system from two perspectives: one to compare our system as a whole with similar systems in terms of hardware specifications, and one that will focus on the software features and limitations that were considered in our design.
In the first section we will consider five NIRS/EEG devices. The following systems are developed by:
1. “Safaie et al.” (Safaie et al., 2013) 2. “Leamy et al.” (Leamy et al., 2011) 3. “Hebden et al.” (Hebden et al., 2012) and two commercial devices:
4. LABNIRS developed by Neurospec (Shimadzu Corporation, 2014) 5. Asalab developed by Ant-neuro (Antneuro, 2014)
In the second section we will look at the user interface and software aspects of two systems. The first one is an earlier version of the brain imaging device developed by our group presented in Lareau’s work (Lareau et al., 2011). The second solution is the software system described in (Safaie et al., 2013). In section 2.2 we will consider a number of commercial and
non-commercially available NIRS acquisition systems with similar features and do a comparison. Finally in section 2.3 we will discuss the software design concepts and proposed architectures.
2.1 NIRS-EEG acquisition systems
2.1.1 Hardware comparison
The characteristic of five NIRS-EEG devices is summarized in Table 2.1. All solutions support dual mode, both NIRS and EEG, but they are not necessarily an integrated device.
Table 2.1: Characteristics of NIRS-EEG devices
The system developed by (Safaie et al., 2013) is a portable and wireless bimodal NIRS-EEG acquisition system with an online interactive environment for real time monitoring. The hardware design of the system has similar characteristics to ours, with a few differences that are discussed.
1 http://nirx.net/uploads/Brochures/NIRSport%20Brochure.pdf. 2 http://www.biosemi.com/faq/adjust_samplerate.htm
Characteristics [1] [2] [3] [4] [5]
Integrated NIRS
and EEG yes no no no no
Portable yes no no no (cables extend up to
13 meters) EEG is briefcase-sized, NIRS depends #Emitters/Detectors 32/4 7/3 32/16 Maximum of 142 channels 8/8 #EEG 16 3 3 128 32-128 NIRS Sampling
rate 8 25 10 166 Connects to NIRx device1
EEG Sampling rate 1024 2048 0.3-70
Connects to BioSemi EEG device2 (up to 16
kHz) max 10kHz
Data transmission Bluetooth USB USB USB USB
Head coverage patch patch helmet patch/helmet helmet for EEG, patch for NIRS
Their system has 32 emitters, 4 detectors and 16 EEG channels. The limited number of detectors greatly reduces the number of available channels and limits the brain area that can be imaged. In comparison with our system, we are able to couple 32 emitters with a selection of the 32 detectors (which can be coupled with 4 or 8 detectors), providing a total of 128 NIRS channels. Our NIRS channels are sampled at a rate of 20 Hz, which is higher than the reported system at 8 Hz. The primary benefit of more channels and a faster sampling rate is improved spatial resolution. The proposed system supports only 16 EEG (32 EEG channels for our system) at a sampling rate of 1024 Hz, while in our system it is at 320 Hz.
Another important difference that affects the number of emitter/detector pairs is the helmet design. In the mentioned design the optodes are mounted onto a flexible material that is fixed to the patients head by a Velcro strap. This patch can only cover one area of the cortex, and as a result cannot report the cerebral activity from all regions of the brain. In our system, we have designed a full helmet that covers the entire adult head, with the optodes placed at equidistant sockets. The helmet has been designed with both stability and flexibility in mind, and to allow easy mounting of the optodes.
Our system supports up to 32 EEG electrodes. Depending on the helmet being used, these locations are either fixed based on the 10-20 montage standard, or the electrodes can be inserted at desired locations through the helmet using electrolyte gel. We have also included an auxiliary analog channel that has been proven to be very practical and convenient during experiments. While there is no designated purpose for this channel, it can be easily connected to other physiological and respiration instruments devices, such as an electrocardiogram or pulse oximeter. This provides an easy mode of displaying all data from the various sources on a single display.
The second system by (Leamy et al., 2011) is a combination of separate NIRS and EEG devices which yields a non-portable solution. In addition it offers a low number of NIRS (3 detectors, 3 emitters) and EEG (7) channels. The acquired data is transferred to the host computer via cable connection. The imaging is also limited to a specific part of the cortex, since the optodes are fixed onto a patch.
The third system developed by (Hebden et al., 2012) is a combination of two separate devices, which offers a high number of NIRS channels (32 emitters and 16 detectors). However
there is no wireless data transmission and due to its size it is not portable. The optodes are fixed onto a helmet which covers the entire cortex. The NIRS sampling rate is 10 Hz and uses the frequency domain technology. The EEG system records at a frequency range of 0.3 – 70 Hz, using 3 EEG channels.
The commercial system developed by NeuroSpec, which is called LABNIRS, is a combination of two separate NIRS and EEG devices (Shimadzu Corporation, 2014). While the system is described to be useful in various tasks involving patient movement, the monitoring device is stationary (due to its size), and only connected by fibres to the optodes (which can be extended up to 13 meters). Thus the portability of the system is arguable.
The system developed by Ant-neuro offers a similar solution for NIRS-EEG monitoring using separate devices. The system is designed to interface with NIRx system for acquiring NIRS signals (Antneuro, 2014). It is not mentioned which version of NIRx devices is used, however only one version (NIRSport) is a portable solution, which is limited to the frontal cortex and limited number of emitters and detectors.
2.1.2 Software comparison
In this section we will look at the software aspects and features of two similar systems. The first system is the initial GUI for the portable NIRS-EEG system developed by Lareau (Lareau et al., 2011) which is the base platform for the developments made in this thesis. The initial prototype was created in a reduced channel count version (8 emitters, 8 detectors and 8 EEG channels) with a software module for displaying the results. We will focus on the details of the user interface design and the enhancements/additions that have been made in our system. The GUI in the mentioned system is developed entirely in Matlab, and allows limited user control of the acquisition parameters while transmitting the data in real time via USB to a PC. Our system is developed mainly in LabVIEW with some processing in Matlab. The advantages of using LabVIEW as a centered workstation to control all aspects of the instrument is outlined in (Soraghan et al., 2008). We still have the option of including user defined signal processing functions (written in C or C++) which can be easily integrated via DLL (Dynamic Link Library). LabVIEW supports direct Matlab code, thus we were able to minimize development and test time by taking advantage of existing modules. The developer can monitor the required time for each particular task and identify the bottlenecks of the system in the real time processing chain. In
particular, we have reused previously developed C++ libraries for the serial data communication. In Lareau’s system the raw data is received and recorded by the PC, while no additional processing is done online. HomER, which is a specific Matlab toolbox dedicated to the processing of optical functional brain data, was used to perform further processing on the raw signals, and to calculate oxy and deoxy-hemoglobin values and display a 2D image reconstruction of the concentration changes (Huppert et al., 2009). The following is the shortcomings of the user interface which we aim to overcome in our current system:
Very basic user interface
Limited parameter adjustments
Offline signal processing
Configuration parameters are not adjustable during the test
In this work, we have made the following improvements and included these additional features: 1. Real time parameter adjustment without interruption during a recording session
2. Real time display of HbO and HbR values
3. 2D mapping of the oxygen concentration changes 4. NIRS signal quality monitoring during sessions
5. Ability to restart an acquisition using previously set configurations 6. Adjustable window frame (scale) for both NIRS and EEG graphs 7. Bipolar and referential EEG montage
8. Individual show/hide setting for each graph
9. Functional wireless communication between control module and PC 10. Wireless communication for data transfer between two or more computers
11. Auto calibration feature that quickly adjusts the individual emitter light intensity to achieve best results based on the specific test settings
12. Battery level indicator for the control module
13. Convenient raw data storage (.tdms ) and conversion to HomER and Matlab compatible format (.nirs and .mat)
14. Much more robust and flexible graphical user interface
15. Modular design and organization of the code that facilitates maintenance and future development
16. Grouping of various functions into libraries which can be reused and configured as needed
With these additional features, we are fully capable of monitoring, configuring, recording and processing data in real-time.
In the system designed by (Safaie et al., 2013) they have developed a dedicated user interface. The auto-calibration function is present in both systems. This allows the user to achieve the best illumination intensity for each individual emitter, ensuring a good SNR. One common problem in NIRS systems is poor connection between the NIRS optodes and the scalp due to patient movement or hair in the light path. To reduce undesired effects and to ensure the quality of connection, we have also included a software option to monitor the status of all channels. The “analyze” function of our system provides a quick update on the status of all NIRS channels, and states whether they are saturated (from ambient light) or if there is cross-talk between channels. The status can be regularly checked at any time during a test to validate signal quality. This feature does not exist in the mentioned system. They have described a similar feature for EEG signals. This includes a dedicated circuit for determining the electrode-skin impedance to identify any bad connections. Due to hardware limitations, our design does not include this feature; however an impedance meter can be quickly used to verify the skin-electrode connection quality prior to an acquisition. Since the EEG electrodes are securely fixed onto the patients head using electrolyte gel, the contact quality remains relatively stable throughout testing.
Another important detail to consider in all monitoring systems is motion artifact and noise reduction. Our present system uses two external 3D accelerometers, one that is placed on the helmet and the other can be freely placed on a desired location depending on the activity performed. The system reported by (Safaie et al., 2013) only uses one 3D accelerometer. Our current design displays and records the information along the three axes of the accelerometers, but it is not yet applied in motion artifact removal of the NIRS or EEG signals. It appears that the mentioned system does not make any corrections for movement artifacts either. Similar to our system, they simply display the results to help distinguish between normal and abnormal motion artifacts. This source of information is still practical for analyzing the results offline. The data from the accelerometer will be soon integrated as a function in the future version of our system.
Both systems have been designed with long term monitoring in mind. Thus it is important that the system operates for a relatively long period of time without requiring battery replacement. The system developed in (Safaie et al., 2013) can perform acquisitions for up to 5 hours. While this may be sufficient in some applications, it is not suited for all tests. Our system can monitor and record for up to 24 hours, hence providing a much longer testing period.
The mentioned system can be used to simultaneously connect to up to 7 prototypes placed on different locations on the body. This can be used to monitor cerebral as well other muscle tissue activity, creating a network of devices. Our current system supports one prototype connected to a PC for monitoring, but this can be easily extended to include more acquisition models connected to the same PC to create a network of devices if needed.
Another design feature is the choice of development platform. We have chosen to use LabVIEW and Matlab, while the system by (Safaie et al., 2013) has been developed entirely in Matlab. It is difficult to determine which has a better performance; LabVIEW provides easy integration of software and hardware components through a graphical programming technique, while Matlab is solely based on coding. In addition, Matlab code can be directly inserted into LabVIEW programs, which has allowed us to take advantage of previously developed Matlab functions and include them in our design. Thus it appears that both platforms are well suited for this application, and it is more a design decision of the developer.
In terms of hemodynamic value calculations, we have used MBLL for calculating oxygen concentration values (Delpy et al., 1988). The mentioned system has used an additional method, spatial-resolved spectroscopy (SRS), to calculate the tissue oxygenation index (TOI) as well.
2.2 Portable NIRS devices
While there are a limited number of portable NIRS-EEG devices, there are many portable devices dedicated solely to NIRS, commercial and non-commercial ones. We will discuss the details of a similar system to ours, developed by (Hemmati et al., 2012). Based on a recent review by (Scholkmann et al., 2014) a number of existing commercial NIRS acquisition devices have been analyzed and compared in terms of features and specifications.
The system developed by (Hemmati et al., 2012) is dedicated solely to CW-NIRS monitoring and provides 4 emitters and 10 detectors, for a total of 16 NIRS channels. They
process the retrieved data in real time and display oxygen concentration values. However there is no indication of a real-time topographical image reconstruction, or real-time configuration of the parameters. In addition, the data is transferred via cable connection to the processing computer. This will limit the patient’s mobility to the close proximity of the monitoring computer, which can be inconvenient in long term testing. Also in the mentioned system the stability and quality of the optode connection is only maintained by ensuring it holds an orthogonal orientation to the skin surface. Thus there is no means of monitoring the connection through the software during long term acquisitions. In addition, in the mentioned system they only monitor the prefrontal cortex activity, as a result the attachment of the probes to the skin surface is much easier to maintain. Similar to our system, they have used the MBLL to calculate oxygen concentration values.
To the best of our knowledge, the mentioned system does not have a dedicated software system for their control unit. The software platform has not been clearly detailed, and only the final results are presented. The limitation of such a system is that it may be difficult to achieve the best possible results for all tests, since they require some level of customization based on the particular task and patient. While our system provides a higher channel count and additional hardware add-ons, such as an accelerometer, it is flexible and allows the user to easily customize the test settings based on individuals and the application. This feature makes our system usable across various applications. Table 2.2 shows a list of commercial NIRS monitoring devices characteristics.
Table 2.2: Commercial NIRS devices characteristics. Adapted from (Scholkmann et al., 2014)
Device Sampling
frequency Emitters Detectors Portability Wireless
D1 – Oxymon MkIII 250 32 16 no yes
D2 – PortaLite 50 3 1 yes yes
D3 – fNIR1100 2 Up to 4 Up to 10 no yes
D4 – fNIR1100w 2 1 Up to 4 yes yes
D5 – ETG 4000 10 18 8 no yes
D6 – ETG 7100 10 40 40 no yes
D7 – WOT 5 8 8 yes yes
D8 – Genie 5.02 4-16 8-32 yes yes
D9 – NIRScout 6.25-62.5 8 or 16 4-24 no yes
D10 – NIRScoutX 6.25-62.5 48 32 no yes
D11 – NIRSport 6.25-62.5 8 8 yes yes
D12 – Brainsight NIRS 100 4-16 8-32 no yes
D13 – FOIRE-3000 7.5-40 4-16 4-16 no yes D14 – OEG-SpO2 1.52 or 12.2 6 6 yes no D15 – CW6 10-50 4-48 8-32 no yes D16 – UCL Optical Topography System 10-160 16 16 no yes D17 – Imagent 16-60 16 or 32 4 or 8 no yes
In order to provide a meaningful comparison in regards to our work, we will categorize the devices based on the following priority list:
1. Portability
2. High-channel count 3. Wireless monitoring
Of the devices listed above, many are small enough to be considered a portable solution, meaning that the patient can wear the device and it is battery operated. Devices D2, D4, D7, D8, D11 and D14 meet this criterion. In terms of channel count, most devices have a relatively low number of emitter-detector pairs, which limits its applications. D8 which is developed by Genie offers a greater number of emitter-detector pairs (4-16 emitters and up to 32 detectors). However the temporal resolution is significantly lower than our device, and is at 5.02 Hz.
The third criterion is wireless monitoring. This is important since we do not want to reduce the patient’s mobility by using a wired connection in long term monitoring. In addition, it allows us to use the prototype in outdoor settings where the patient undergoes gait or similar protocols. Of the six devices that were considered portable, all had wireless data transmission to a host PC except for D14 (the data is recorded in the device). Although the mentioned systems provide information from both NIRS and EEG sources, none of them provide an integrated portable solution with a high channel count.
2.3 Software architecture models
The larger a software project is, the more important it is to have well-organized code. Otherwise it will become difficult to continue development and make any minor changes without creating more problems. If the development is already complete, it is even more time consuming to ensure the maintenance and evolution of such software, and can be very challenging to change. This section will focus on the architectural design of the Imaginc software and we will introduce the supporting software tools that are available and can be used in our design. It is important to mention that we are focused at the architectural level of the application. We need to consider the software and components as a whole, while satisfying the requirements. Some design decisions have been made during the initial phases of the project development (by previous team members who carried out the implementation), and we have made the future design choices based on those.
The choice of software architecture is partially dependent on the perspective of the designer. It also depends on the specific constraints and objectives of the project. In our case, there are certain hardware specifications, as well as end-user requirements. The latter is acquired by interaction with the end user, as well as user feedback from trial versions of the software. In our work regular feedback has been an integral part from the beginning with the goal of