UNIVERSITÉ DE MONTRÉAL
SYNTHESIS AND CHARACTERIZATION OF BISMUTH
TELLURIDE-BASED NANOSTRUCTURED THERMOELECTRIC COMPOSITE
MATERIALS
MOHSEN KESHAVARZ KHORASGANI DÉPARTEMENT DE GÉNIE MÉCANIQUE ÉCOLE POLYTECHNIQUE DE MONTRÉAL
THÈSE PRÉSENTÉE EN VUE DE L’OBTENTION DU DIPLÔME DE PHILOSOPHIÆ DOCTOR
(GÉNIE MÉTALLURGIQUE) MARS 2014
UNIVERSITÉ DE MONTRÉAL
ÉCOLE POLYTECHNIQUE DE MONTRÉAL
SYNTHESIS AND CHARACTERIZATION OF BISMUTH TELLURIDE-BASED NANOSTRUCTURED THERMOELECTRIC COMPOSITE MATERIALS
présenté par : KESHAVARZ KHORASGANI Mohsen en vue de l’obtention du diplôme de : Philosophiæ Doctor a été dûment accepté par le jury d’examen constitué de :
M. THERRIAULT Daniel, Ph.D., président
M. TURENNE Sylvain, Ph.D., membre et directeur de recherche M. MASUT Remo A., Ph.D., membre et codirecteur de recherche M. YELON Arthur, Ph.D., membre
DEDICATION
I dedicate this work to
my supportive parents,
my lovely wife
&
my beautiful son.
“The true human ornaments are: knowledge, love, and freedom.”
ACKNOWLEDGMENTS
First, the financial support of the Natural Science and Engineering Research Council of Canada (NSERC), and the Fonds Québécois de la Recherche sur la Nature et les Technologies (FQRNT) is gratefully acknowledged.
I feel truly blessed to find the position as Ph.D. student in the thermoelectric research group of École Polytechnique de Montréal. It is genuinely a privilege to be working with and under the instruction of such group of prestigious scholars; Prof. Sylvain Turenne, Prof. Remo Masut, and Dr. Dimitri Vasilevskiy. Thanks and gratitude is given to my research director, Prof. Sylvain Turenne, for his open-ended support, insightful opinions, and extremely valuable advices in many occasions. Special thanks to my research co-director, Prof. Remo Masut, who has given very generously of his time to discuss various aspects of this project. In addition to his help in working on the project, writing the articles, and my dissertation, he has always been available to encourage, and lend perspective along the way. I would like to express my deep gratitude to my mentor, Dr. Dimitri Vasilevskiy, for his strong encouragement, support, guidance, and advices through my Ph.D. study. I am extremely indebted to him for his fatherly generosity, detailed instructions, high-standard education, also for sharing lots of time doing experiments, doing discussions, and helping me to develop my understanding specially in physics fundamentals. I just can say that without him, I would not have accomplished my Ph.D.
I would be remiss not to thank my friends, my colleagues and other members of thermoelectric research group of École Polytechnique de Montréal who helped and supported me a lot during my study. I would also like to recognize and thank the following individuals for their assistance in various aspects of this work: Mr. Siamak Kashi, Dr. Javier Arreguin Zavala, Mr. Melik Bouhadra, Mr. Frédéric Tremblay Verville, Mr. Jean-Philippe Masse, and Mrs. Carole Massicotte, besides all the staff of École Polytechnique de Montréal specially the secretaries and technicians of departments of mechanical engineering and engineering physics.
Most of all, I would like to gratefully thank my wife, and my parents in Iran for their love, support, and inspiration. My wife, Hoory, has been always a good listener for my toughest moments of life. She has always been there to help unconditionally, support unlimitedly, and inspire me amorously, and I owe her a special debt of gratitude.
ABSTRACT
Thermoelectric (TE) materials and devices are attractive in solid-state energy conversion applications such as waste heat recovery, air-conditioning, and refrigeration. Since the 1950’s lots of unremitting efforts have been made to enhance the efficiency of energy conversion in TE materials (i. e. improving the figure of merit (ZT)), however, most of commercial bulk TE materials still suffer from low efficiency with ZTs around unity. To enhance the performance of bismuth telluride based TE alloys, we have developed composite TE materials, based on the idea that introducing more engineered interfaces in the bulk TE materials may lead to thermal conductivity reduction due to increased phonon scattering by these interfaces. In this approach it is expected that the electronic transport properties of the material are not effectively affected. Consequently, ZT enhancement can be achieved.
In this dissertation we will discuss synthesis and characterization of two types of bismuth telluride based bulk composite TE materials. The first type is engineered to contain the presence of coherent interfaces between phases in the material resulting from different mixtures of totally miscible compounds with similar composition. The second type includes the nanocomposites with embedded foreign nano-particles in which the matrix and the particles are delimited by incoherent interfaces. The synthesis procedure, micro- and nano-structures as well as thermoelectric properties of these composites will be presented.
In our study on the composites with coherent interfaces, we produced a series of different composites of p-type bismuth antimony telluride alloys and studied their microstructure and thermoelectric properties. Each composite consists of two phases that were obtained in powder form by mechanical alloying. Mixed powders in various proportions of the two different phases were consolidated by hot extrusion to obtain each bulk composite. The minimum grain size of bulk composites as revealed by scanning electron microscopy shows a 50% reduction compared to the conventional (Bi0.2Sb0.8)2Te3 . XRD analysis indicates a systematic decrease of crystallite size in the composite materials. Scattering mechanisms of charge carriers were evaluated by Hall effect measurements. There is no evidence of carriers scattering linked to the composite nature in these materials. The composites show no significant degradation of the power factor and high peak ZT values ranging from 0.86 to 1.04. It was found, contrary to expectations that the thermal conductivity of the composites slightly increases compared to the conventional alloy. This
behavior has been attributed to two factors: (1) the grains of the composites are not sufficiently small to increase phonon scattering, and (2) the lattice thermal conductivity of single phase (Bi0.2Sb0.8)2Te3 alloy has the smaller value in comparison with the lattice thermal conductivity of each of the components of the composites.
Importantly, we have already demonstrated the feasibility of this approach to conserve the electronic transport properties while more interfaces are introduced in the material. We believe that continued investigation following this approach can guide us to achieve an enhanced figure of merit.
We have also studied bulk nanocomposites of p-type (Bi0.2Sb0.8)2Te3 and n-type (Bi0.95Sb0.05)2(Te0.95Se0.05)3 with embedded MoS2 nano-inclusions, which were obtained by mechanical alloying and hot extrusion. This series of TE nanocomposites contain incoherent interfaces between nano-particles and the matrix. We have found that addition of molybdenum disulfide (MoS2) nano-particles to the matrix improves the extrusion process and limits the grain growth in bismuth telluride based alloys. Transmission electron microscopy revealed that grain boundaries of the matrix are decorated by nano-inclusions, leading to a significant reduction of average grain size and crystallite size compared to those of the conventional single phase alloy. Scanning electron microscope images show that the average grain size of p-type (Bi0.2Sb0.8)2Te3 composites containing 0.2, 0.4 and 0.8 wt% MoS2 nano-particles, under otherwise identical extrusion conditions, is reduced by a factor around four. Scherer’s formula applied to x-ray diffraction data indicates that after the hot extrusion process, the average crystallite size in composites increases only by 10% (~ 18 nm) compared to about 400% growth (~ 80 nm) observed in the single phase bismuth telluride based alloy. Smaller crystallites, as expected, lead to a reduction of the thermal conductivity in these nanocomposites (~1.4 W/m·K at 450 K for 0.4 wt.% MoS2) when compared to the conventional alloy (~1.8 W/m·K). The structural changes in the nanocomposites characterized by mechanical spectroscopy in the temperature range 293-540 K show an increase of the internal friction accompanied by a systematic reduction of its activation energy with increase in MoS2 content, which is an indication of higher density of crystal defects in the nanocomposites that largely contribute to the internal friction background. Investigation of TE properties shows a reduction of the room temperature figure of merit (ZT values) from 0.9 to 0.7 due to a lower power factor. However, once above 370 K, the figure of merit of alloys containing MoS2 nano-particles surpasses that of single phase (Bi0.2Sb0.8)2Te3, due
to a more pronounced reduction in the thermal conductivity at temperatures above the cross point of the ZT values.
Remarkably, we have demonstrated that adding nano-particles of MoS2 to bismuth telluride based alloys is an approach to significantly reduce the grain size of the matrix resulting in an important thermal conductivity decrease. The enhanced ZT values above 370 K in nanocomposites show the preeminent achievement of this approach, although further study is required to obtain optimum transport properties, and boost up the ZT more effectively.
RÉSUMÉ
Les matériaux et dispositifs thermoélectriques (TE) sont intéressants pour les applications en conversion d’énergie tels la récupération de chaleur, la climatisation et la réfrigération. Depuis les années 50, plusieurs efforts ont été déployés pour améliorer l’efficacité des matériaux TE pour la conversion d’énergie (amélioration de la figure de mérite ZT). Malgré ces efforts, la plupart des matériaux TE atteignent au mieux une valeur de ZT de l’ordre de 1. Pour améliorer la performance des alliages TE à base de tellurure de bismuth, nous avons développé des matériaux TE composites à partir de l’hypothèse que par addition d’interfaces dans la structure du matériau TE, il soit possible de réduire la conductibilité thermique par la diffusion des phonons sur ces interfaces. En suivant cette approche, on suppose que les propriétés de transport électronique ne seront pas grandement affectées, menant ainsi à une augmentation de ZT.
Dans cette thèse, nous discuterons des procédés d’élaboration et de la caractérisation de deux types de composites TE basés sur le tellurure de bismuth. Le premier type de composite est obtenu en créant des interfaces cohérentes entre différentes phases miscibles de compositions chimiques similaires. Le second type de nanocomposite est fabriqué par l’addition de nano-particules d’une espèce différente menant à la présence d’interfaces incohérentes entre les particules et la matrice. Les étapes des procédés, la caractérisation micro- et nanostructurale ainsi que les propriétés thermoélectriques seront présentées dans cette thèse.
Dans l’étude des composites avec interfaces cohérentes, nous avons produit différents mélanges d’alliages de type p de tellurure de bismuth et d’antimoine pour évaluer leurs propriétés TE et leur microstructure. Chaque composite est constitué de deux phases qui sont élaborées à partir de poudres par mécanosynthèse. Le composite est obtenu en extrudant à chaud différentes proportions des deux phases de compositions différentes. La taille de grains minimale pour les composites, évaluée par microscopie électronique à balayage, montre une réduction de 50% par rapport à la taille de grains de l’alliage (Bi0.2Sb0.8)2Te3 élaboré par la méthode conventionnelle. L’analyse par diffraction des rayons x (XRD) indique une décroissance systématique de la taille des cristallites dans e composite. Les mécanismes de diffusion des porteurs de charges ont été caractérisés à partir de mesures de l’effet Hall. Nous n’avons pas observé d’évidence de diffusion des porteurs dans ces composites. Aucune décroissance significative du facteur de puissance n’a été observée et de hautes valeurs de la figure de mérite ZT ont été obtenues, entre 0.86 et 1.04.
Contrairement à ce qui avait été anticipé, nous avons observé une légère augmentation de la conductibilité thermique des composites comparée à celle caractérisant l’alliage conventionnel. Ce comportement peut être expliqué par deux facteurs : (1) les grains du composites ne sont pas suffisamment petits pour augmenter la diffusion des phonons et (2) la composante du réseau de la conductibilité thermique de la phase (Bi0.2Sb0.8)2Te3 est plus faible que celle de chacun des constituants des composites.
Il est important de mentionner que cette approche de fabrication de composites permet de conserver les propriétés de transport électronique tout en augmentant la présence d’interfaces. Nous croyons qu’il sera aussi possible en poursuivant nos travaux d’améliorer la figure de mérite. Pour l’étude des nanocomposites du second type, nous avons élaborés les composites par addition de nano-inclusions de disulfure de molybdène (MoS2) dans des matrices de type p (Bi0.2Sb0.8)2Te3 et de type n (Bi0.95Sb0.05)2(Te0.95Se0.05)3 par mécanosynthèse et extrusion à chaud. Ces nanocomposites contiennent des interfaces incohérentes entre les nano-particules et la matrice. Nous avons observé que l’addition de nano-particules de MoS2 facilite le processus d’extrusion et limite la croissance des grains des alliages de tellurure de bismuth. La microscopie électronique à transmission révèle que les nano-particules se situent au niveau des joints de grains, limitant ainsi significativement la croissance des grains et des cristallites, comparé au cas de l’alliage conventionnel monophasé. La microscopie électronique à balayage montre que la taille de grains moyenne pour les composites basés sur l’alliage de type p (Bi0.2Sb0.8)2Te3 contenant 0.2, 0.4 et 0.8% poids de nano-particules de MoS2, extrudés dans les mêmes conditions, subit une réduction par un facteur 4 par rapport à l’alliage conventionnel. La formule de Scherer appliquée sur les données de XRD indique qu’après le procédé d’extrusion à chaud, la taille moyenne des cristallites n’augmente que de seulement 10% (~18 nm) dans les composites comparé à environ 400% (~80 nm) dans les alliages monophasés de tellurure de bismuth. Comme prévu, la réduction de taille des cristallites mène à une diminution de la conductibilité thermique des composites (~1.4 W/m·K à 450 K pour 0.4% poids MoS2) comparé à celle des alliages conventionnels (~1.8 W/m·K). Le changement structural dans les nanocomposites caractérisé par spectroscopie mécanique dans la gamme de température 293-540 K montre une augmentation du frottement interne accompagné d’une réduction systématique de l’énergie d’activation pur ce mécanisme avec une augmentation du contenu en MoS2. Ceci est une indication que l’augmentation de défauts cristallins dans les composites contribue à l’augmentation du niveau de frottement
interne. La mesure des propriétés TE à la température ambiante montre une diminution de la figure de mérite ZT de 0.9 à 0.7 due à un facteur de puissance plus faible. Cependant, au dessus de 370 K, la figure de mérite des nanocomposites contenant du MoS2 dépasse celle de l’alliage monophasé (Bi0.2Sb0.8)2Te3 due à la plus grande réduction de la conductibilité thermique à une température située au dessus du point de croisement des valeurs de ZT.
Pour les composites du deuxième type, nous avons montré que l’addition de nano-particules de MoS2 à des alliages de tellurure de bismuth permet de réduire significativement la taille de grains de la matrice pour ainsi obtenir une réduction de la conductibilité thermique. L’amélioration de la figure de mérite ZT au dessus de 370 K montre le bénéfice de cette approche, malgré qu’il reste à approfondir les études pour optimiser les propriétés de transport électronique pour améliorer encore plus la figure de mérite.
TABLE OF CONTENTS
DEDICATION ... III ACKNOWLEDGMENTS ... IV ABSTRACT ... V RÉSUMÉ ... VIII TABLE OF CONTENTS ... XI LIST OF TABLES ... XIV LIST OF FIGURES ...XV LIST OF ABBREVIATIONS AND SYMBOLS... XXI LIST OF APPENDICES ... XXIVINTRODUCTION ... 1
CHAPTER 1 STATE OF KNOWLEDGE AND CRITICAL REVIEW OF THE LITERATURE… ... 4
1.1 Introduction to thermoelectricity ... 4
1.1.1 History and developments ... 4
1.1.2 Thermoelectric properties ... 5
1.1.3 The figure of merit ... 7
1.2 Current issues in thermoelectrics ... 8
1.2.1 Particular thermoelectric nanocomposites ... 10
1.2.2 Random nanocomposites vs. ordered nanocomposites ... 21
1.3 Bismuth telluride- based alloys ... 23
1.4 The molybdenum disulfide system ... 29
CHAPTER 2 EXPERIMENTAL METHODS ... 33
2.2 Synthesis ... 34
2.3 Characterization techniques and sample preparations ... 36
2.3.1 Microstructure analyses ... 36
2.3.2 Atomic structure analyses ... 36
2.3.3 Phases, elemental, and crystallite size analyses ... 36
2.3.4 Thermoelectric properties ... 38
2.3.5 Transport properties ... 40
2.3.6 Mechanical spectroscopy ... 41
CHAPTER 3... 43
ARTICLE 1: P-TYPE BISMUTH TELLURIDE BASED COMPOSITE THERMOELECTRIC MATERIALS PRODUCED BY MECHANICAL ALLOYING AND HOT EXTRUSION ... 43
3.1 Abstract... 44
3.2 Introduction... 44
3.3 Experimental procedures ... 46
3.4 Results and discussion ... 47
3.4.1 Microstructure and grain size... 47
3.4.2 Carrier transport analysis ... 52
3.4.3 Thermoelectric properties ... 55
3.5 Conclusion ... 59
3.6 Further discussion ... 60
CHAPTER 4... 61
ARTICLE 2: SYNTHESIS AND CHARACTERIZATION OF BISMUTH TELLURIDE-BASED THERMOELECTRIC NANOCOMPOSITES CONTAINING MoS2 NANO-INCLUSIONS ... 61
4.2 Introduction... 62
4.3 Experimental procedure ... 63
4.4 Results and discussion ... 64
4.5 Conclusion ... 70
4.6 Further discussion ... 71
CHAPTER 5... 72
ARTICLE 3: EFFECT OF SUPPRESSION OF GRAIN GROWTH OF HOT EXTRUDED (Bi0.2Sb0.8)2Te3 THERMOELECTRIC ALLOYS BY MoS2 NANOPARTICLES ... 72
5.1 Abstract... 73
5.2 Introduction... 73
5.3 Experimental procedure ... 75
5.4 Results ... 76
5.4.1 Microstructure and mechanical properties analyses... 76
5.4.2 XRD analysis ... 78
5.4.3 TEM observations ... 80
5.4.4 Thermoelectric properties ... 81
5.5 Discussion ... 85
5.6 Conclusion ... 86
5.7 Characterization of n-type nanocomposite ... 87
5.7.1 Microstructure ... 87
5.7.2 Thermoelectric properties ... 87
CHAPTER 6 SUMMARY AND GENERAL DISCUSSION ... 92
CONCLUSIONS AND FUTURE DIRECTIONS ... 101
BIBLIOGRAPHY ... 103
LIST OF TABLES
Table 2.1 : Powder contamination during mechanical alloying. ... 35 Table 3.1: Composition and weight percentage of different phases mixed in powder form to
produce composite TE alloys by hot extrusion. ... 47 Table 3.2 : Lattice parameters of alloys based on Bi, Sb, and Te (adapted from database of X’pert
Highscore analyzer software). ... 60 Table 6.1 : Comparison between literature and our work on bismuth telluride based
nanocomposites with embedded nano-particles. The values are adopted from measurements at 370 K. ... 100
LIST OF FIGURES
Figure 1.1: Schematic of illustration of Seebeck effect between the junctions of two dissimilar conductors when a temperature gradient is present. ... 6 Figure 1.2 : The skutterudite crystal structure, metal atoms are the white circles and pnictogen
atoms are the black ones [58]. ... 11 Figure 1.3 : Typical crystal structure of half-Heusler alloys [72]. ... 14 Figure 1.4 : Thermoelectric properties of ZrNiSn-ZrO2 nanocomposites: (a) electrical resistivity,
(b) the Seebeck coefficient, (c) thermal conductivity, and (d) figure of merit [80]. ... 15 Figure 1.5 : Lattice thermal conductivity in PbTe-based nanocomposites with different type of
nano-inclusions [29]... 16 Figure 1.6 : The microstructure of solidified alloys with the composition of Te-36at.%Sb-5at.%Pb (a) cooled in air, (b) quenched in water [100]. ... 17 Figure 1.7 : Microstructure of transformed Pb2Sb6Te11 to PbTe and Sb2Te3 lamellae by annealing.
The darker regions are Sb2Te3, the lighter regions PbTe. (a) annealed at 500 ⁰C for 5 days, (b) annealed at 400 ⁰C for 5 days, (c) annealed at 300 ⁰C for 5 days [98]. ... 18 Figure 1.8 : TEM images of (a) Bi0.3Sb1.7Te3 matrix (b) magnified area of panel a, (c) SiC nano-particle in the matrix, (d) HRTEM image of the interface between SiC nano-nano-particle and the matrix [111]. ... 20 Figure 1.9 : Microstructure of water-quenched Bi2Te3-PbTe alloys with chemical composition
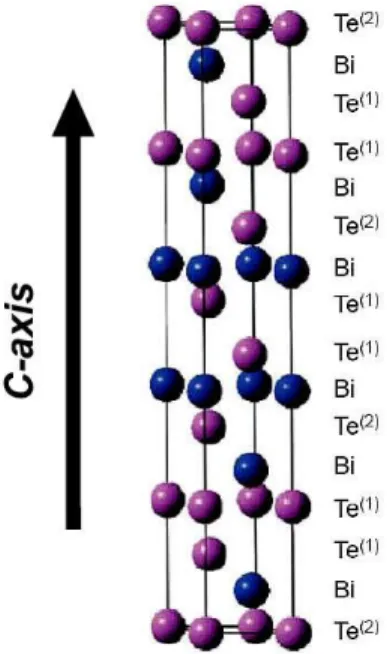
of: (a) Pb2Bi2Te5 and, (b) PbBi6Te10 [112]. ... 21 Figure 1.10 : Schematic of random nanocomposites (a-e), and ordered nanocomposites (f-j) [29]. ... 22 Figure 1.11 : Hexagonal representation of bismuth telluride crystal structure. Bi atoms in blue
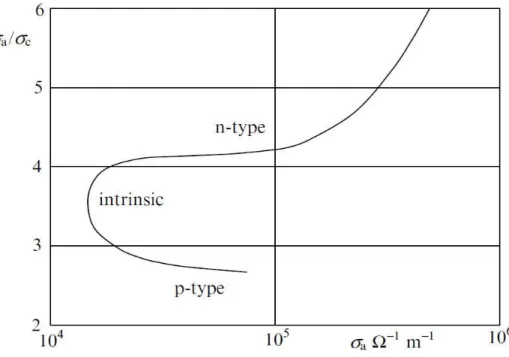
spheres and Te atoms in purple [118]. ... 24 Figure 1.12 : Plot of the ratio of electrical conductivities of single crystal bismuth telluride at 300
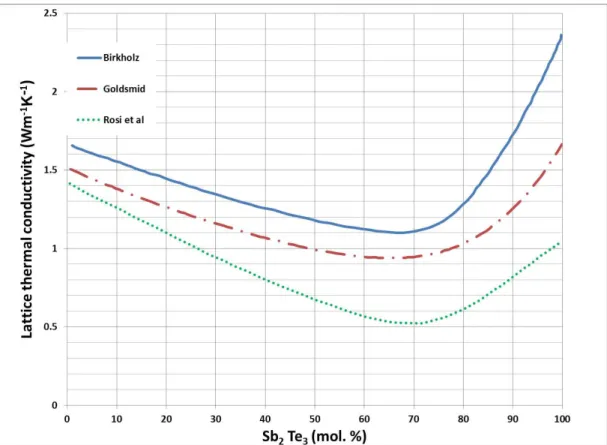
Figure 1.13: Seebeck coefficient of bismuth telluride as a function of Te at.%. Dash line indicate at around 62 at.% the conduction mode of bismuth telluride changes [123]. ... 26 Figure 1.14: Plot of lattice thermal conductivity against molar percentage of Sb2Te3 in solid
solutions of (Bi-Sb)2Te3 (based on data of Birkholz, Goldsmid, and Rosi et al. [24]). ... 27 Figure 1.15: Plot of lattice thermal conductivity at 300 K against molar percentage of Bi2Se3 in
solid solutions of (Bi-Sb)2Te3 [1]. ... 28 Figure 1.16: The thermoelectric figure of merit plotted against electrical conductivity for n-type
and p-type solid solutions and pure compound of bismuth telluride [1]. ... 28 Figure1.17: Crystal structure of molybdenum disulfide and distances between its atomic
layers[140]. ... 30 Figure 1.18 : Size-dependent electronic band structure of MoS2. The bottom of the conduction
band (in red) and top of the valance band (in blue) are highlighted. The Fermi level is set at 0 eV and the arrow shows the smallest value of the indirect or direct band gap[146]. ... 31 Figure 1.19 : Schematic of different edge configurations in (a) MoS2 monolayer, (b) side view of
monolayer, (c) top view of MoS2 monolayer. The horizontal orientation shows the armchair configuration and the vertical orientation shows the zigzag configuration [148]. ... 32 Figure 2.1 : Elemental pellets of starting materials used to synthesize bismuth telluride based
alloys. ... 33 Figure 2.2 : Morphology of MoS2 nano-particles as provided by supplier. ... 34 Figure 2.3 : Schematic of attrition system used for mechanical alloying. ... 35 Figure 2.4 : An example of samples prepared for XRD analyses. The upper surface is ground with
SiC grinding paper (1200 grit), then polished using slurry of Alumina (particles < 0.05 microns). ... 38 Figure 2.5: Samples prepared for TE properties measurement. ... 39 Figure 2.6: Schematic of voltage vs. time graph for a TE material once the current is switched off. ... 40 Figure 2.7: Samples prepared for Hall Effect measurements. ... 41
Figure 2.8 : Schematic of MS setup as sample installed in the furnace. ... 42 Figure 3.1: Microstructure of homogenous part of the extruded rods in conventional alloy (a) and
composite #6 (b) obtained by using Secondary electron images. The porosity is typical for hot extruded alloys. ... 49 Figure 3.2: Backscattered electron images showing the microstructure at the beginning of the
extruded rods in conventional alloy (a), and in composite #5 (b). Observe the grains size reduction and the lamellae within grains (stacking faults or twins). They are much smaller in the composites. ... 50 Figure 3.3 : Evolution of peak broadening in the composites for the (110) and (113) diffracting
planes. There is no conclusive evidence of separate peaks in these curves. ... 51 Figure 3.4: Calculated crystal sizes from XRD data of extruded composites and conventional
alloy from the homogenous part of the rods (blue diamonds) and from the beginning of the extruded rods (red triangles). Inserted XRD patterns for conventional alloy and composite #6 illustrate peak broadening (patterns taken from the homogeneous part). ... 52 Figure 3.5: (a) Hole Hall Mobility vs. temperature obtained from Hall measurements in the range
15-360K, (b) Conductivity vs. temperature from Harman measurements in the range 290-380K. ... 54 Figure 3.6: Inverse Hall mobility vs. carrier concentration at T=15K acquired from Hall
measurements. ... 55 Figure 3.7: Peak ZT values of all composites and conventional alloy for both beginning (red
squares) and homogenous part (blue diamonds) of the extruded rods. The solid line is included to highlight the decrease in peak ZT values in composites. ... 56 Figure 3.8: Maximum power factor of the conventional alloy and of the composites as was
measured by our Harman setup. The solid line is included as a guide showing the overall tendency of the power factor. ... 57 Figure 3.9: Thermal conductivities of the composites and the conventional alloy as were obtained
Figure 3.10: The composition (from Table 3.1) of the constituents of the composite materials (# on right axis) showing the molar percentage of Sb2Te3 in each phase (phase 1: green diamonds and phase 2: red squares). The graph also shows the values of the thermal conductivity (left axis) taken from the literature [24]. ... 58 Figure 4.1: HRTEM images of (a) decorated grains of (Bi0.2Sb0.8)2Te3 with nano-flakes of MoS2 in extruded nanocomposite containing 0.8 wt.% MoS2,(b) MoS2 nano-flake with few atomic layers decorating a grain in a extruded nanocomposite with 0.2 wt.% MoS2, (c) several MoS2 nano-particles (indicated by arrows) dispersed in the matrix of an extruded nanocomposite with 0.4 wt.% MoS2 and (d) EDX spectrum of indicated area in panel (b). ... 65 Figure 4.2: Backscattered electrons SEM images revealing: (a) the microstructure of a
conventional single phase (Bi0.2Sb0.8)2Te3 alloy (0 wt.% MoS2), (b) the sub-micron matrix grains in (Bi0.2Sb0.8)2Te3:MoS2 nanocomposite containing 0.4 wt.% MoS2. ... 66 Figure 4.3: Peak broadening in nanocomposites (a) selected peaks corresponding to (110) plane,
(b) crystallite sizes of the powders and extruded samples of conventional alloy and nanocomposites, as determined by Scherrer’s formula. ... 67 Figure 4.4: (a) Measurements of the internal friction of nanocomposites with different amount of
MoS2 nano-particles compared with conventional alloys, as a function of absolute temperature; (b) Arrehnius plot of p-type nanocomposites, and (c) illustration of the internal friction activation energy trend as a function of MoS2 content. ... 68 Figure 5.1: SEM images of the fracture surfaces perpendicular to the extrusion axis of a)
conventional (Bi0.2Sb0.8)2Te3 alloy (0 wt.% MoS2), and nanocomposites with b) 0.2 c) 0.4 d) 0.8 wt.% MoS2. ... 77 Figure 5.2: Young’s modulus measured by mechanical spectroscopy as a function of temperature
and MoS2 content. ... 78 Figure 5.3: (a) X-ray diffraction patterns of extruded samples with different amount of MoS2 nanoparticles, (b) Peaks’ broadening in nanocomposites compared to the alloy without MoS2... 79 Figure 5.4: Crystallite sizes of the powders and extruded samples of conventional alloy and
Figure 5.5: TEM images of (a) dispersed nano-flakes which decorate the matrix grains in extruded nanocomposite with 0.4 wt.% of MoS2 , (b) extruded nanocomposite with 0.4 wt.% MoS2 and (c) EDX spectra of positions labeled 1-3 in panel (b). ... 81 Figure 5.6: (a) Electrical conductivity (log-log scale) and (b) thermal conductivity of p-doped
samples as a function of temperature. Both conductivities are measured on a plane containing the extrusion axes (except for the case of one sample, measured perpendicular to the extrusion axis, represented by solid triangles guided by a dashed line)... 83 Figure 5.7: (a) Comparison of ZT values as a function of temperature of the conventional
(Bi0.2Sb0.8)2Te3 compound with samples containing 0.4 wt.% MoS2 obtained with different processing parameters, (b) comparison of the Seebeck coefficient of samples in panel (a). As in the previous figure, one of the samples is measured in a direction along the extrusion axis (solid triangles guided by a dashed line). ... 84 Figure 5.8: SEM images of the fracture surfaces perpendicular to the extrusion axis of a) n-type
(Bi0.95Sb0.05)2(Te0.95Se0.05)3 alloy (0 wt.% MoS2), and (b) n-type nanocomposite with 0.3 wt.% MoS2... 87 Figure 5.9: Electrical conductivity of n-type conventional and nanocomposite materials with 0.3
wt.% of MoS2 as function of absolute temperature (log-log scale). The measured values in the direction parallel to the extrusion direction are presented for both conventional (red triangles) and nanocomposite (blue circles), as well as values measured on a plane perpendicular to the extrusion axis for the nanocomposite sample (blank squares). ... 88 Figure 5.10: Thermal conductivity of n-type conventional and nanocomposite samples (with 0.3
wt.% MoS2). The blank squares show the measured value for the nanocomposite sample along a direction perpendicular to the extrusion axis. ... 89 Figure 5.11: ZT values of n-type conventional and nanocomposite samples as a function of
temperature. As in the previous figure, one of the samples is measured in a direction perpendicular to the extrusion axis. ... 90 Figure 5.12: Seebeck coefficients of n-type conventional and nanocomposite (0.3 wt% MoS2)
samples as a function of temperature. Values of nanocomposite sample shown by blank squares were measured in the direction perpendicular to the extrusion axis. ... 91
Figure 6.1: Mean crystallite size of powders after milling (circles) and sintered samples (squares) of bismuth telluride based nanocomposites as a function of fullerene concentration [180]. . 95
LIST OF ABBREVIATIONS AND SYMBOLS
Abbreviation Meaning
CNTs Carbon Nanotubes
EDS Energy dispersive spectroscopy
FEG-SEM Field emission gun – scanning electron microscope
HH Half-Heusler
HRTEM High resolution transmission electron microscope
IET Impulse excitation technique
MS Mechanical spectroscopy
PF Power factor
TE Thermoelectric
XRD X-ray powder diffraction
IF Internal friction
Symbol Meaning (Unit)
ZT Dimensionless figure of merit
α Seebeck coefficient (μV/K)
V Electric potential (Volts)
T Absolute temperature (K)
ΔT Temperature difference (K)
αAB Differential Seebeck coefficient of conductors A and B (μV/K)
Π Peltier coefficient (Volts)
I Electric current (A)
τ Thomson coefficient (V/K)
Z Figure of merit (1/K)
λ Thermal conductivity (W/mK)
σ Electrical conductivity (S/m)
λe Electronic thermal conductivity (W/mK)
λph Lattice thermal conductivity (W/mK)
n, p Charge carriers density (cm-3)
e Electron charge (Coulombs)
μ Charge carrier mobility (cm2/(V·s))
ρ Electrical resistivity (Ωcm)
L Lorenz number (WΩK-2)
KB Boltzmann constant (1.3806488 × 10⁻²³ m2 kg s-2 K-1)
Ef Fermi energy (eV)
Λ X-ray radiation wavelength (Angstrom)
D Average crystallite size (nm)
B Full width at half maximum (Degree)
θ Diffraction angle (Degree)
ΔX Difference in electronegativites (eV)
E Young’s modulus (GPa)
EC Young’s modulus of composite material (GPa)
Em Young’s modulus of matrix phase of composite (GPa)
Enp Young’s modulus of nano-particles in the composite (GPa)
Vnp Volume fraction of nano-particles in the composite (vol.%)
LIST OF APPENDICES
INTRODUCTION
When fossil fuel resources are becoming exhausted, followed by the environmental issues, the emerging global need for alternative energy sources, conservation, and management has increased interest in more effective, clean, and sustainable resources of power generation. Thermoelectric devices can be used as power generators or cooling devices. Despite high cost and relatively low efficiency of thermoelectric materials, which are used in these devices, there are some features under development that make them a promising alternative in energy conversion. Thermoelectric materials can play an important role in energy conservation (i.e. waste heat harvesting) if efficient, stable, and inexpensive novel materials can be developed. Thermoelectric generators are solid-state generators with no moving parts and minimum maintenance needed. These devices are environmentally friendly, silent, and reliable. The most clearly defined application of thermoelectricity is in energy recovery from waste heat. Currently, due to relatively high cost and low efficiency, thermoelectric materials are employed in limited applications. However, there are still key applications of thermoelectric devices where their restrictive parameters are not prohibitive. Nonetheless, more efficient materials need to be identified in order to extend their use in power generation and cooling applications.
Bismuth telluride based alloys are the most promising thermoelectric materials for near room temperature applications due to their low thermal conductivity and large Seebeck coefficient. However, the efficiency of these materials has not been significantly improved during the last 40 years.
During the past decade, several reports have shown improvement in thermoelectric performance. Most of these advances have been connected with the use of nanostructures. One of the most efficient values in the bismuth telluride system has been obtained from a superlattice based on bismuth telluride and antimony telluride. In this case, the improvement of the performance can be related to the lattice conductivity reduction [1]. Addition of nano-inclusions to increase interfaces has shown a significant impact on lattice thermal conductivity reduction despite its simultaneous effect on electrical conductivity [2, 3]. Alternatively, composite thermoelectric materials containing several phases may enhance the performance of thermoelectric materials by conserving a relatively high electrical conductivity while introducing more interfaces leading to a decrease in the thermal conductivity. Although several reports on synthesis of composite
thermoelectric materials have been published [4-12], the production of bulk bismuth telluride based thermoelectric composites including several constituent phases of the same family has not been reported, and its consequences on thermoelectric and transport properties have not been studied. Also, synthesis approaches to obtain nanostructure thermoelectric materials, which are amenable to mass production for industrial applications, would attract more interests. On the other hands, one of the main concerns when synthesizing nanostructured thermoelectric alloys is to conserve the nanostructure and inhibit grain growth. Making diffusion barriers at grain boundaries such as adding nano-inclusions, or mixing dissimilar phases when making composite thermoelectrics, may suppress the grain growth.
The basis of the present Ph.D. work is the production of nanostructured bismuth telluride based thermoelectric nanocomposites. These composites contain different phases such as binary, ternary, or quaternary alloys of Bi, Te, Sb, and Se, and/or nano-inclusions of molybdenum disulfide (MoS2). These alloys are produced by mechanical alloying, and then mixed and consolidated via hot extrusion.
The general objectives of this dissertation besides a contribution to advance the knowledge in the field of bulk thermoelectric nanocomposites, were to employ cost and time efficient techniques to synthesize and produce bulk TE composites with possibility of commercialization and mass production, also to establish the relation between structure and thermoelectric properties of these materials with the aim to shed light on their functional properties.
The specific objectives of this work were to study the differentiation of transport properties, microstructures, atomic structures, and phases’ distribution of nanostructured bismuth telluride based composites in comparison with single phase alloy material. Evaluation of the thermoelectric and mechanical properties of conventional single phase and composite bismuth telluride based materials, and comparison of thermoelectric properties of produced composites with theoretical expectations are another objectives of this dissertation.
We expect the myriad nanoscopic interfaces produced by means of these nanocomposites, which according to the theoretical and experimental investigations described in Chapter 1, effectively reduce the lattice thermal conductivity, thus improving the thermoelectric performance.
This Ph.D. dissertation includes a brief review on the history, theories, and current issues of thermoelectricity and thermoelectric materials and a literature review on efforts to make
thermoelectric nanocomposites and hypothetical as well as practical approaches to obtain nanocomposite thermoelectrics with enhanced performances. In addition to these topics, the atomic and electronic structures of the constituent phases of composites are presented in Chapter 1. The experimental methods such as basis of materials synthesis, characterization techniques, and samples specifications are given in Chapter 2.
The efforts whose results establish this research work as a Ph.D. dissertation are multifaceted, and indicated below as research efforts A-D.
A – Synthesizing thermoelectric composites containing Bi-Sb-Te based phases – In Chapter 3 (Manuscript 1), we report production of six different composites of p-type bismuth antimony telluride alloys.
B – Synthesizing the MoS2 nano-inclusion embedded thermoelectric nanocomposites – Production of four different nanocomposites incorporated with MoS2 nano-inclusions is reported in Chapter 4 (Manuscript 2).
C – Microstructures, phases, and atomic structures characterization of composites – Analyses of microstructure, phases and crystallite sizes are provided in Chapters 3, 4, and 5 (Manuscript 3).
D – Thermoelectric properties characterization – Results and analyses of thermoelectric properties of composites such as electrical conductivity, thermal conductivity, Seebeck coefficient and figure of merit, are described in Chapter 3 and Chapter 5.
Finally, a general discussion of this research is presented in Chapter 6, followed by the conclusion.
STATE OF KNOWLEDGE AND CRITICAL REVIEW OF THE
Chapter 1
LITERATURE
In this chapter, an overview of theories related to principles of thermoelectricity is given. In addition, current issues in processing thermoelectric (TE) materials with enhanced performance, and proposed approaches to improve the performance of TE materials are reviewed. Moreover, the crystal structures as well as the electronic and thermal properties of alloys used in this Ph.D. work will be described.
1.1 Introduction to thermoelectricity
In this section, a short review of discovery and developments of thermoelectricity and TE materials is given. TE properties and principles are reviewed.
1.1.1 History and developments
The earliest reported discovery on thermoelectricity dates back to 1821, when Thomas Johan Seebeck observed for the first time a direct conversion between thermal and electrical energy [13]. Seebeck observed that a compass magnet would deflect when it is close to a circuit made from two dissimilar metals, with junctions at different temperatures [14]. In other words, the temperature difference at the junctions of two dissimilar metals produces an electric potential. Nowadays, this effect is known as the Seebeck effect.
In 1834, Jean Charles Athanase Peltier found that an electrical current would produce heating or cooling at the junction of two dissimilar metals. In 1838, Lenz revealed that depending on the direction of current flow, heat can be generated, or by reversing the current flow, heat could be absorbed from a given junction. The heat which is absorbed or created at the junction is proportional to the electrical current. Later, this proportionality constant was called the Peltier coefficient [15].
William Thomson (Lord Kelvin) found and described the interrelationship between Seebeck and Peltier effects. The third thermoelectric effect, which is now termed “Thomson effect”, describes relations between the Seebeck and Peltier coefficients through thermodynamics. The Peltier coefficient is simply the Seebeck coefficient times absolute temperature [16]. However, research in thermoelectricity and TE materials did not show promising developments until 1950 when
Abram Fedorovich Ioffe found that doped semiconductor alloys would have better thermoelectric performance than pure metals. He also developed the modern theory of thermoelectricity using the concept of figure of merit (ZT), to show the performance of TE materials [17, 18]. This spurred research in thermoelectricity and today, considerable numbers of new TE materials have been developed. During the 1990’s, the new ideas that making engineered structures and nanometer scale TE materials will improve ZT, renewed interests in thermoelectricity [19-21].
1.1.2 Thermoelectric properties
In this section, the definitions of the Seebeck and Peltier coefficients are presented, as well as how they are related to one another.
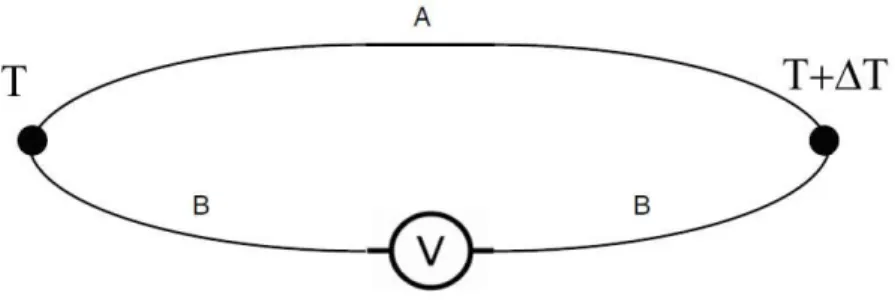
The Seebeck coefficient, also known as thermopower or thermoelectric power, α, represents the power of the Seebeck effect. When there is a conductor (A) joined at both ends to another conductor (B), and B is divided in two parts being connected to a voltmeter (Figure 1.1), then by establishing a temperature difference ΔT between the two junctions, a potential difference V will appear between the free ends (which can be measured by the voltmeter). The differential Seebeck coefficient is defined as,
AB
= V
T
(1.1)
The typical unit of Seebeck coefficient is μV/K. Intuitively, the establishment of a temperature gradient causes electron diffusion between the two sides of the junction. Electrons in the hot region become more energetic than those in the cold region, thus, there is a relative difference in electron velocities which implies a net diffusion of electrons from hot region to the cold region. As a result, the sign of the Seebeck coefficient is typically negative for n-type materials, where electrons are the majority charge carriers, and positive for p-type materials, where holes are the primary carriers [1, 18].
Figure 1.1: Schematic of illustration of Seebeck effect between the junctions of two dissimilar conductors when a temperature gradient is present.
The representation of the strength of the Peltier effect is the Peltier coefficient, Π, which is defined as the ratio of the rate q of heating or cooling at each junction of two dissimilar conductors to the applied electric current I,
AB
q I
(1.2)
By applying an electric current across a junction of two dissimilar conductors, the rate of heating (cooling) will be different through each material. Consequently, heat will be either absorbed (cooling) or produced (heating) at that junction. Heating or cooling will be reversed by changing the polarity of the electric current at the junction due to the inversion of heat flow between two conductors[1, 18].
In the Thomson’s studies, as mentioned earlier in this chapter, the Peltier coefficient in terms of the Seebeck coefficient is expressed by this equation,
AB ABT
(1.3)
where T is the absolute temperature of the materials. The Thomson effect describes the production or absorption of heat from a material that is exposed to both temperature and voltage gradient [1, 18], through the Thomson coefficient, τ, which is related to the Seebeck coefficient, and in fact evaluates the magnitude of the Thomson effect by the following equation:
d d T T (1.4)
1.1.3 The figure of merit
The essential goal of using thermoelectric materials is energy conversion. In order to evaluate the thermoelectric performance of a material, its efficiency in energy conversion of TE devices has to be assessed. The efficiency of TE devices translates into a figure of merit for materials, a parameter, Z, with dimension of K-1, which is given by
2
Z
(1.5)
where α is Seebeck coefficient, σ is the electrical conductivity, and λ is the thermal conductivity of the material. However, mostly, the more practical dimensionless figure of merit, ZT, which is obtained by multiplying the figure of merit by the absolute temperature, T, is often used [1, 18, 22]. Knowing and understanding Z and its related parameters (in equation (1.5)), one can analyze and develop a TE material. In section 1.1.2, the Seebeck coefficient and its relation to other TE effects were described. The other parameters of interest in evaluation of the figure of merit of TE materials are the electrical and thermal conductivities. Transport of energy by both electrons and phonons (which are quanta of lattice vibrations modes in a crystal) contributes to thermal conduction of materials [23, 24]. The total thermal conductivity, λ, can then be written as:
e ph
(1.6)Electrical conductivity is dependent on the ability of the charge carriers to travel through a material, under an applied external field. The charge carrier mobility, μ, illustrates how quickly the charge carriers responds to an electric field and travel through the material. The movement of charge carriers can be limited by collisions with lattice imperfections, impurities, and phonons. In semiconductors, there are in general two types of carriers contributing to the electrical conductivity, which each one (n or p) has the form
,
n p
ne
(1.7)where e is the magnitude of the electron charge, n is the concentration of charge carriers (usually denoted by p for positive carriers (or holes))[22, 25]. Hence, the total electrical conductivity is given as
n p
Thermal conductivity and electrical conductivity are both dependent on charge carrier transport, and are related by Wiedemann-Franz law. This means that efforts to increase electrical conductivity to enhance ZT, will result in an increased thermal conductivity as well. In another words, since these parameters are interdependent it is challenging to find adequate ways to enhance the figure of merit. The most studied way to improve ZT, is by thermal conductivity reduction. It is well known that amorphous materials or glass have the lowest thermal conductivity of solid materials. This led to the idea of a thermoelectric material with a glass-like thermal conductivity when it has crystal-like electronic properties [1].
When a semiconductor has a high electrical resistivity, then heat conductivity is mainly dominated by lattice vibrations (phonons), although in some semiconductors the contribution of the electronic component of the thermal conductivity is high enough to make it important. Thus, it is necessary to separate the contributions of lattice and electronic components to the thermal conductivity [24, 26-28]. The lattice thermal conductivity can be reduced by the scattering of phonons on various types of defects. These could be point, line and volume (bulk) defects such as ions, impurities, dislocations, grain boundaries or particles as well as nano-inclusions. In a system containing dissimilar materials or when an abrupt dimensional mismatch occurs, interfaces may be responsible for significant phonon scattering [1, 24].
1.2
Current issues in thermoelectrics
As we discussed in the previous section, the figure of merit is entirely dependent on the electrical conductivity, the thermal conductivity, and the Seebeck coefficient. The power factor (PF), of TE materials is defined as 2 2 PF (1.9)
where ρ is the electrical resistivity. In the 1950’s and 60’s, TE researches mostly focused on the PF improvement, obviously, by making efforts to increase the electrical conductivity and/or Seebeck coefficient when the thermal conductivity is not affected. Nevertheless, as it is shown in section 1.1.3, thermal conductivity has an electronic contribution (λe), which according to the
Wiedemann-Franz equation, is represented by a component of thermal conductivity directly proportional to the electrical conductivity [27]:
e L T
(1.10)Here, L stands for Lorenz number, which in the case of thermoelectric materials is mostly within a range of 1.6 - 2.2 10-8
W.Ω/K2 [29].
Although the Lorenz number is not constant for all thermoelectric materials, and each material has a specific Lorenz number, this range can help to provide a rough estimation of the electronic contribution to the thermal conductivity. The difficulties arise in improving ZT since any attempt to enhance the electrical conductivity leads to a corresponding increase in the thermal conductivity. Moreover, the Seebeck coefficient is proportional to the logarithmic derivative of the electrical conductivity according to the Mott formula [30, 31],
2 2 ln 3 f B E k T d e dE (1.11)
where kB represents the Boltzmann constant, e is the electron (carrier) charge, and Ef stands for the Fermi energy. This equation shows the interrelations between electrical conductivity and Seebeck coefficient that introduce more challenges to maximize the figure of merit.
To sum up, between two main approaches to optimize and maximize the figure of merit, which are; power factor boost, and lattice thermal conductivity reduction, the latter one is the easier to implement, since a single parameter is involved to achieve the goal.
Some of suggested methods to lower the lattice thermal conductivity are; making alloys and solid solutions, increasing the average atomic mass [1], and using materials with intrinsic complex structures [32, 33]. However, it was in the 1990’s that for the first time the idea of using low dimensional structures to enhance the figure of merit was presented [34, 35]. Though that proposed theoretical framework to increase the figure of merit was based primarily on enhancement of power factor due to quantum confinement effects rather than from any thermal conductivity reduction [36]. Later, a work on Bi2Te3/Sb2Te3 superlattices, and soon after another study on PbTe/PbSexTe1-x superlattices showed ZT enhancement due to phonon scattering at the interfaces between layers in superlattice structures [37, 38]. These results began to attract interest in TE research to reduce thermal conductivity by phonon scattering.
However, due to the thin morphologies of superlattices, they are more studied in thin film applications than in bulk applications. In order to utilize the benefits of low dimensional morphologies within bulk applications the concepts of composite and nanocomposite have been followed by several TE research groups during the last ten years. One of the earliest reported studies to produce such a TE composite involved the incorporation of 9-15 nm diameter Bi nanowires into porous alumina and porous silica [39].
The words, composite and nanocomposite, in the thermoelectric related literature are used with different meanings. In some reports, nanocomposite refers to adding nano-inclusions to the bulk thermoelectric materials [40, 41], in some others, it pertains to mixing two or more different particle sizes ranging from nano to micro-scale of the same material [42], or mixing two different TE phases [43]. In general, one can call a material, a TE nanocomposite when it consists of nano-inclusions, nano-particles randomly dispersed, nano-grains, and secondary phases or precipitates. More recently several approaches have been developed to produce TE nanocomposites mainly based on the idea of the phonons scattering by introducing more interfaces in the material, such as utilizing phase decomposition to create embedded nanostructures [44, 45]. Several types of nano-inclusions such as semimetals, semiconductors, metals, ceramics, and even carbon nanotubes were also used in thermoelectric materials to produce TE nanocomposites [40, 41, 46, 47].
1.2.1 Particular thermoelectric nanocomposites
There are several groups and families of TE materials including semimetals, semiconductors, and ceramics in different crystalline forms and various dimensions [48-54]. Recently, even some polymers retained attentions by their interesting TE properties [55-57]. However, in this section, some of the scientific works on bulk TE nanocomposites with a special focus on the well-known classified compounds are reviewed.
1.2.1.1 Skutterudites
Filled skutterudites are among the most promising TE materials. Skutterudites comprise compounds with a general formula of MX3 (where M is Co, Rh, or Ir, and X is a pnictogen atom like P, As, or Sb) [29, 58]. The typical crystal structure of skutterudites is depicted as in Figure 1.2. In this structure, the metal atoms M forming a simple cubic sub-lattice and pnictogen atoms X placed in planar, near-square rings.
Figure 1.2 : The skutterudite crystal structure, metal atoms are the white circles and pnictogen atoms are the black ones [58].
Looking to the skutterudites crystal structure, it is easy to see the open nature of the structure. In fact, two of the eight cubes in the structure remain empty. These empty spaces in the structure are called voids of the structure. Filling these voids by atoms of other elements such as ions of rare-earths, alkaline rare-earths, or alkali metals, results in the formation of filled skutterudites. These materials are suitable for electronic as well as lattice properties modifications, which make them potential TE materials [29, 58].
Recently, several reports showed the interest of making nanocomposites of skutterudites by introducing nano-inclusions into the skutterudite matrix [59-64]. These studies are mostly on the cobalt triantimonide based materials due to their electrical properties (high carrier mobility and large effective mass). However, the high thermal conductivity of these materials is the main issue that remains unsolved to maximize their TE performance [65]. Indeed, adding nano-inclusions could be an option to reduce thermal conductivity and improve the TE properties.
Chubilleau et al. [64] reported a study of adding ZnO nano-inclusions to CoSb3 skutterudite. They added 2-12 wt.% of ZnO nano-particles to the synthesized CoSb3 particles and sintered the mixtures by spark plasma sintering (SPS) technique. Their results showed a significant enhancement in the Seebeck coefficient values in addition to a decrease in the thermal conductivity. However, the smallest amount of nano-inclusions (i.e. 2 wt.%) had the most beneficial effect on the figure of merit while the sample with 12 wt.% ZnO nano-inclusions showed a drastic increase in electrical resistivity. Another report from this research team
investigated the effect of PbTe inclusions on the CoSb3 skutterudite. In this report [63], nano-particles of PbTe (6 nm in diameter) were introduced, in various wt.% from 0 to 8, into CoSb3 skutterudite matrices. They showed that PbTe-CoSb3 TE composites are n-type materials whereas the single phase CoSb3 skutterudite is a p-type semiconductor. They claimed that this change in the conduction mode is due to the small amount of Sb for Te substituting in the composites. Also, the agglomerates of PbTe were observed at grain boundaries. Thermal conductivity reduction was observed for all composites regardless of the amount of nano-inclusions in the material. Fu et al. [66] used AgSbTe2 nano-inclusions in Yb0.2Co4Sb12 filled skutterudite to make TE nanocomposites. They added 2, 4, and 8 wt.% of the nano-inclusions in the matrix and investigated the TE properties. It was shown that the electrical conductivity of these nanocomposites is higher than that of the matrix single phase sample. The proposed explanation involves two reasons; the added nano-inclusions are p-type semiconductors, while the matrix has an n-type conduction mode, therefore, the charge carrier concentration of the nanocomposites decreased as the nano-inclusion content increased, but carrier mobility increased by a factor of three. Furthermore, AgSbTe2 nano-inclusions precipitated at the grain boundaries of the matrix, which as it is claimed, led to improvement in electrical conductivity at grain boundaries. As it is reported, there is an energy barrier with a height of about 0.48 eV at the boundaries of nano-inclusions and the filled skutterudite matrix. This barrier needs to be overcome by the charge carriers leading to low energy electrons filtration. As a result, enhancement of the Seebeck coefficient is achieved. Although the lattice thermal conductivity of nanocomposites in this study decreased, there is an increment in the electronic contribution to their thermal conductivity, thus, there is no systematic relation between the amount of nano-inclusions and the total thermal conductivity. However, due to the simultaneous increment of the Seebeck coefficient and the thermal conductivity reduction in the nanocomposites, their reported ZT values of these nanocomposites improved. The maximum ZT was obtained for the nanocomposites with 4 wt.% of AgSbTe2 nano-inclusions at 300 K, which is one of the best reported ZT values (1.27 at about 600 K) in the skutterudite based composites [59, 61, 66-69].
Besides using nano-inclusions in skutterudites to reduce the lattice thermal conductivity, a remarkably low lattice thermal conductivity was observed in the single-, double-, and triple-filled skutterudites. For instance, the lattice thermal conductivity of triple-filled BauLauYbwCo4Sb12 is reported as low as 1-2 Wm-1K-1 at 300 K and ~ 0.2 Wm-1K-1 at 800 K (samples without filling
showed lattice thermal conductivity between 4-6 Wm-1K-1 at 300 K and between 2-4 Wm-1K-1 at 800 K). Although there are still some disagreements on the lattice thermal conductivity of multiple-filled skutterudites at high temperatures yet the multiple-filling certainly reduced the lattice thermal conductivity of these materials in several reports [70, 71].
1.2.1.2 Half-Heuslers
The half-Heusler (HH) alloys with the general formula of ABC are one of the well-known intermetallic compounds. These alloys crystallize in the cubic structure that could be understood as a simple rock salt structure which formed by atoms of type A and C, and filled by atoms of type B at one of the two body diagonal positions (see Figure 1.3) [72]. HH alloys are suitable TE materials for high temperature applications due to their high temperature stability [73]. The reported HH nanocomposites are mostly nano-inclusion embedded HH alloys or with nano-scale precipitates within the matrix. Nano-particles of ZrO2, C60, γ-Al2O3, WO3, and NiO are used as nano-inclusions in the HH matrix [74-86]. Huang et al. reported a 35% reduction of thermal conductivity by the addition of 6 vol% ZrO2 nano-inclusions to a ZrNiSn matrix compared to the single phase alloy. This led to a 15% improvement in the ZT value of this nanocomposite at 900 K in contrast to the pure ZrNiSn compounds (see Figure 1.4) [80]. Another study of HH nanocomposites showed that the lattice thermal conductivity of nanocomposites of Zr0.5Hf0.5Ni0.8Pd0.2Sn0.99Sb0.01-ZrO2 with 3, 6, and 9 vol% ZrO2 nano-inclusions approximately reduced 5%, 14%, and 34%, respectively, compared with the lattice thermal conductivity of matrix phase. Besides the action of nano-inclusions as phonon scattering centers, this relatively big impact on the lattice thermal conductivity reduction was explained by the induced defects in the material by adding nano-inclusions [85]. In addition to the effect of ZrO2 nano-inclusions on thermal conductivity of HH nanocomposites, Poon et al. and Chen et al. reported the energy filtering effect in HH-ZrO2 nanocomposites, but this energy filtering effect was not strong enough to considerably improve the Seebeck coefficient [85, 86].
Figure 1.3 : Typical crystal structure of half-Heusler alloys [72].
Another approach to produce HH nanocomposites is the formation of nano-scale precipitates within the homogeneous matrix. Xie et al. reported the formation of nano-scale InSb inclusions in the MCoSb (M= Ti, Zr, or Hf) system. By addition of In into the mixed starting materials during the induction melting, indium could react with antimony and resulted in the formation of nano-precipitates [82]. They experimentally showed that by formation of this nano-scale phase in the matrix, the Seebeck coefficient, electrical conductivity, and thermal conductivity could be tuned somewhat individually. By formation of these nano-precipitates, the InSb phase injects electrons that can increase the carrier concentration (electrical conductivity) of the HH nanocomposite, and the interfaces between the precipitates and matrix act as a potential energy barrier resulting in an improvement of the Seebeck coefficient. In the meantime, higher phonon scattering at these interfaces leads to a lattice thermal conductivity reduction. Due to the combination of all these effects, the ZT of the HH nanocomposites with 1 at.% InSb has reached an enhancement of ~160% (ZT=0.5 at 820 K) compared to the HH matrix [82].
Figure 1.4 : Thermoelectric properties of ZrNiSn-ZrO2 nanocomposites: (a) electrical resistivity, (b) the Seebeck coefficient, (c) thermal conductivity, and (d) figure of merit [80].
1.2.1.3 Chalcogenides
In general, when there is at least one chalcogen anion and at least one electropositive element in a chemical compound, it is called a chalcogenide. All the elements in the group 16 of the periodic table are defined as chalcogen, however, the term chalcogenide is more generally used for tellurides, selenides, and sulfides, rather than the other elements of this group [87]. Some of the well-known TE chalcogenides such as PbTe, PbSe, or even PbS crystallize in a rock salt crystal system. However, there are other TE chalcogenides or dichalcogenides such as bismuth telluride and molybdenium disulfide with hexagonal crystal structure [88-92].
Embedding nano-inclusions in the chalcogenide TE nanocomposites has been widely studied. For instance, using PbS nano-particles in PbSe matrix, adding PbTe nano-inclusions into PbS, or embedding Sb, Ag2Te, AgSbTe2, NaSbTe2, and SrTe nano-particles in PbTe have been reported [44, 93-97]. In almost all of these studies, the lattice thermal conductivity of the nanocomposites
decreased. Figure 1.5 illustrates the comparison of lattice thermal conductivity in various PbTe based nanocomposites.
Figure 1.5 : Lattice thermal conductivity in PbTe-based nanocomposites with different type of nano-inclusions [29].
The concept of coherent and incoherent nano-inclusions has received more attention recently. When the nano-inclusions and the matrix have similar lattice parameters, and there is a lattice alignment at the contact of the two phases, the interface is called coherent. In contrast, an incoherent interface involves lattice parameters mismatch between nano-inclusion and the matrix, which leads to a clear boundary between two phases. Although both coherent and incoherent interfaces in nanocomposites could significantly reduce the lattice thermal conductivity, yet the mechanisms of phonon scattering in each one is different from the other to some extent. In fact, coherent interfaces act more like point defects, therefore they do not effectively scatter phonons with long wavelength, while the incoherent interface will filter out the phonons, and the phonons with long wavelength could not pass through the nano-inclusion. In addition, for the incoherent interfaces, the mismatched phonon modes also lead to lattice thermal conductivity reduction [29]. The incoherent interfaces not only have impact on thermal conductivity but also have a negative impact on electrical conductivity. These differences between coherent and incoherent interfaces in nanocomposites could be the main reason to see different effect of nano-inclusions on the lattice thermal conductivity as shown in Figure 1.5 [29]. To obtain coherent interfaces in the TE nanocomposites, the idea of using in-situ approach to synthesize these materials, such as
formation of nano-scale precipitates or other secondary phases via nucleation and growth through material synthesis stages, is used in several reports [72, 96, 98, 99]. Ikeda et al. presented several studies on in-situ processes of PbTe based TE materials. They studied the effect of cooling rate until the material cooled below the eutectic temperature of the alloy on the microstructure and phases of pseudo-binary alloys of PbTe-Sb2Te3. As it is shown in Figure 1.6 they obtained finer microstructure by increasing the solidification rate [100].
Figure 1.6 : The microstructure of solidified alloys with the composition of Te-36at.%Sb-5at.%Pb (a) cooled in air, (b) quenched in water [100].
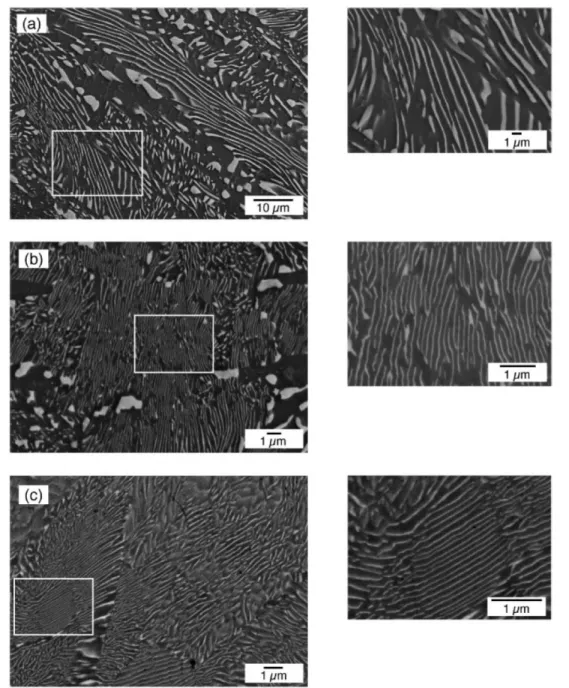
They also tried to produce a layered (lamellar) microstructure of Sb2Te and PbTe by decomposition of metastable Pb2Sb6Te11 phase when they showed the possibility of interlamellar spacing control during decomposition process (see Figure 1.7) [98]. The decomposition of the Pb2Sb6Te11 solid solution occurs during annealing at a temperature below the eutectoid temperature. The lamellae of the PbTe and Sb2Te3 are crystallographically oriented with an average lamellar spacing as small as 180 nm, corresponding to a PbTe layer thickness of 40 nm [98].
Figure 1.7 : Microstructure of transformed Pb2Sb6Te11 to PbTe and Sb2Te3 lamellae by annealing. The darker regions are Sb2Te3, the lighter regions PbTe. (a) annealed at 500 ⁰C for 5 days, (b) annealed at 400 ⁰C for 5 days, (c) annealed at 300 ⁰C for 5 days [98].
Moreover, this research group studied the formation of Widmanstätten precipitates in the PbTe while Pei et al. studied Ag2Te precipitates in the PbTe-Ag2Te system and showed the precipitates formation mechanism in this composite is similar to the Widmanstätten precipitates in PbTe-Sb2Te3 [99, 101].
![Figure 1.5 : Lattice thermal conductivity in PbTe-based nanocomposites with different type of nano-inclusions [29]](https://thumb-eu.123doks.com/thumbv2/123doknet/2334112.32399/40.918.295.654.178.477/figure-lattice-thermal-conductivity-pbte-nanocomposites-different-inclusions.webp)
![Figure 1.6 : The microstructure of solidified alloys with the composition of Te-36at.%Sb- Te-36at.%Sb-5at.%Pb (a) cooled in air, (b) quenched in water [100]](https://thumb-eu.123doks.com/thumbv2/123doknet/2334112.32399/41.918.169.810.306.482/figure-microstructure-solidified-alloys-composition-cooled-quenched-water.webp)
![Figure 1.9 : Microstructure of water-quenched Bi2Te3-PbTe alloys with chemical composition of: (a) Pb 2 Bi 2 Te 5 and, (b) PbBi 6 Te 10 [112]](https://thumb-eu.123doks.com/thumbv2/123doknet/2334112.32399/45.918.264.656.104.530/figure-microstructure-water-quenched-pbte-alloys-chemical-composition.webp)
![Figure 1.10 : Schematic of random nanocomposites (a-e), and ordered nanocomposites (f-j) [29]](https://thumb-eu.123doks.com/thumbv2/123doknet/2334112.32399/46.918.113.805.102.467/figure-schematic-random-nanocomposites-e-ordered-nanocomposites-f.webp)
![Figure 1.16: The thermoelectric figure of merit plotted against electrical conductivity for n-type and p-type solid solutions and pure compound of bismuth telluride [1]](https://thumb-eu.123doks.com/thumbv2/123doknet/2334112.32399/52.918.155.754.598.992/figure-thermoelectric-electrical-conductivity-solutions-compound-bismuth-telluride.webp)
