UNIVERSITÉ DE MONTRÉAL
CHLORINATION OF TOXIC CYANOBACTERIAL CELLS AND THEIR
ASSOCIATED TOXINS
YAN FAN
DÉPARTEMENT DES GÉNIES CIVIL, GÉOLOGIQUE ET DES MINES ÉCOLE POLYTECHNIQUE DE MONTRÉAL
MÉMOIRE PRÉSENTÉ EN VUE DE L’OBTENTION DU DIPLÔME DE MAÎTRISE ÈS SCIENCES APPLIQUÉES
(GÉNIE CIVIL) SEPTEMBRE 2012
UNIVERSITÉ DE MONTRÉAL
ÉCOLE POLYTECHNIQUE DE MONTRÉAL
Ce mémoire intitulé:
CHLORINATION OF TOXIC CYANOBACTERIAL CELLS AND THEIR ASSOCIATED TOXINS
présenté par : FAN Yan
en vue de l’obtention du diplôme de : Maîtrise ès sciences appliquées a été dûment accepté par le jury d’examen constitué de :
M. DESJARDINS Raymond, M. Ing., président
Mme PRÉVOST Michèle, Ph. D., membre et directrice de recherche M. BARBEAU Benoit, Ph. D., membre et codirecteur de recherche Mme DORNER Sarah, Ph. D., membre
DEDICATION
To my family in China
ACKNOWLEDGEMENTS
It is a pleasure to thank the many people who made this thesis possible.Firstly, I would like to express my appreciation to my supervisors Dr. Michèle Prévost and Dr. Benoit Barbeau. Thanks for accepting me as a student and giving me the opportunity to be part of the CREDEAU. I would have been lost without their teaching, guidance, and patient encouragement.
I would also like to thank Dr. Arash Zamyadi for his time, his advices and his great efforts to explain details clearly and simply. It has been a great honour to work with him.
My gratitude also goes to the secretaries and the whole laboratory in the Department of CGM for helping me in many different ways. The assistance of Shokoufeh Nour, France Boisclair, Laura Razafinjanahary, Manon Latour, Jacinthe Mailly, Julie Philibert, Marcelin Fosting, Yves Fontaine, Mireille Blais, Sisi Zhao, Natasha McQuaid, and Yan Wang is gratefully acknowledged.
This study was financially supported by Natural Sciences and Engineering Research Council (NSERC) Canada and partners of Industrial Chair on Drinking Water Treatment at Ecole Polyechnique of Montreal.
RÉSUMÉ
Les cyanobactéries (algues bleu-verts), sont des microorganismes photosynthétiques aérobies qui sont présentes dans les milieux aquatiques situés partout sur le globe. L’eutrophisation croissante des eaux et le changement climatique tendent à favoriser la prolifération de cyanobactéries et la formation des fleurs d’eau (blooms). Les cyanobactéries sont généralement considérées comme des sources de goût et d’odeur dans les systèmes d’approvisionnement en eau potable. En particulier, les cyanotoxines produites par certaines espèces de cyanobactéries peuvent nuire à la santé humaine et animale. Par conséquent, les cyanobactéries suscitent une grande inquiétude dans le monde entier.
La pré-chloration est utilisée dans certaines usines de traitement des eaux en Amérique du Nord. La chloration directe de cyanobactéries peut permettre d’enlever des cellules et des toxines. Toutefois, elle peut aussi causer des problèmes de qualité de l’eau, telles que la lyse cellulaire, le relargage des toxines et du COD (Carbone organique dissous), l’augmentation de la demande en chlore et la formation des sous-produits de désinfection (SPD).
La présente étude vise à examiner les effets de la pré-chloration des cyanobactéries (Microcystis
aeruginosa cultivée et fleurs d’eau naturels) et leur toxines associées. Les objectifs spécifiques de
ce projet sont de : (1) déterminer et modéliser la lyse cellulaire de M. aeruginosa, le relargage des toxines et du COD et l’oxydation des MCs (Microcystines) pendant la chloration de l’eau ultra-pure et de l’eau naturelle dopée avec des cultures en laboratoire; (2) estimer la demande en chlore pour chaque cellule de M. aeruginosa lorsque la lyse cellulaire survient suite à la chloration; (3) étudier la formation de SPD associés avec la chloration des composés provenant de la cellule de
M. aeruginosa; (4) évaluer l’efficacité de la chloration des cellules des cyanobactéries toxiques
dans des échantillons naturels de fleurs d’eau toxiques.
Les valeurs de CT (l’exposition au chlore) de 110.7 mg.min/L (pour l’eau de Rivière Mille-Île dopée avec des M. aeruginosa cultivée) et 130.3 mg.min/L (pour l’eau extra-pure dopée avec des
M. aeruginosa cultivée) sont requis pour obtenir 76% de la lyse cellulaire et à oxyder les toxines
libérées jusqu’à un niveau inférieur à la valeur spécifiée de 1.0 µg/L de MC-LR dans les Directives de l’OMS (Organisation mondiale de la Santé). Dans l’eau ultra-pure, les taux d’oxydation des toxines étaient similaire ou plus rapide que les taux de lyse cellulaire. Une valeur constante de 5.6±0.2 pgCl2/cellule est estimée comme la demande en chlore de chaque cellule de
M. aeruginosa lorsque la lyse cellulaire survient suite à la chloration. Il n’existe pas de formation
de SPD significative dans la chloration de suspension lysée de M. aeruginosa (500,000 cellules/L) dans l’eau ultra-pure. Les fleurs d’eau naturelle sont plus résistantes à la chloration que la suspension cellulaire des cultures en laboratoire.
ABSTRACT
Cyanobacteria (Blue-green algae) are photosynthetic micro-organisms commonly existing in most aquatic systems. Because of climate change and increasing eutrophication of waters, the occurrence of algae blooms is becoming more frequent worldwide. Cyanobacteria are widely considered as sources of taste and odour in drinking water supplies. Cyanotoxins produced by a number of cyanobacteria species are a hazard for the health of human and animals. Therefore, cyanobacteria are a global concern.
Pre-chlorination is still practiced in many North American water treatment plants. Direct chlorination of cyanobacteria can increase the removal of their cells and toxins. However, it may also cause some water quality problems, such as cell lysis, which leads to toxin and DOC (Dissolved organic carbon) release, an increase in chlorine demand and disinfection by-products formation.
This study is to examine the effects of pre-chlorination on cyanobacteria (cultured Microcystis
aeruginosa and natural bloom) and their associated toxins. The major objectives of this work are:
(1) to determine and to model M. aeruginosa cell lysis, toxin and DOC release, and MCs oxidation during chlorination of ultrapure and natural waters spiked with laboratory cultures; (2) to estimate the M. aeruginosa cellular chlorine demand when cell lysis occurs due to chlorination; (3) to study the DBP formation associated with the chlorination of M. aeruginosa cell-bound materials; (4) to evaluate the efficiency of chlorination of toxic cyanobacterial cells in natural bloom samples.
Chlorine exposure (CT) values of 110.7 mg.min/L (for cultured M. aeruginosa spiked in Mille-Île River water) and 130.3 mg.min/L (for cultured M. aeruginosa spiked in ultrapure water) were required to achieve 76% cell lysis and oxidation of released cell-bound toxins at levels below the WHO (World Health Organazation) guideline value of 1.0 µg/L for MC-LR in drinking water. In ultrapure water, the rates of toxin oxidation were similar or faster than the rates of cell lysis. A constant value of 5.6±0.2 pgCl2/cell is estimated as the M. aeruginosa cellular chlorine demand
when cell lysis occurs due to chlorination. There is no significant DBP formation in chlorination of lysed M. aeruginosa suspension (500,000 cells/L) in ultrapure water. Natural blooms are more resistant than cell suspension of laboratory cultures.
TABLE OF CONTENTS
DEDICATION ... III ACKNOWLEDGEMENTS ... IV RÉSUMÉ ... V ABSTRACT ...VII TABLE OF CONTENTS ... VIII LIST OF TABLES ... X LIST OF FIGURES ... XI LIST OF ABBREVIATIONS ... XIII LIST OF APPENDICES ... XV
INTRODUCTION ... 1
Background ... 1
Objectives ... 3
Structure of the thesis ... 3
CHAPTER 1 LITERATURE REVIEW ... 4
1.1 Cyanobacteria ... 4
1.2 Harmful effects and occurrence of cyanobacterial blooms and cyanotoxins ... 5
1.3 Classification of toxins and principal toxins ... 6
1.4 Measurement methods for cyanotoxins ... 9
1.5 Treatment methods of cyanobacteria ... 9
1.5.1 Conventional treatment ... 12
1.5.2 Chemical oxidation / Chlorination ... 12
CHAPTER 2 MATERIALS AND METHODS ... 17
2.2 Water Source ... 17
2.3 Chlorination experiments ... 18
2.4 Taxonomic counts with species identification ... 22
2.5 Analysis of MCs and DBPs ... 22
2.6 Data analysis ... 22
CHAPTER 3 RESULTS AND DISCUSSION ... 24
3.1 Impact of cyanobacterial celluler compounds and water matrix on chlorine demand ... 25
3.2 Chlorination effect on cells lysis and estimation of chlorine demand per cell ... 28
3.3 Impact of chlorination on release and oxidation on cell-bound cyanotoxins ... 35
3.4 Chlorination effect on cellular organic carbon release and DBP formation ... 39
CONCLUSION ... 42
REFERENCES ... 44
APPENDICES ... 51
LIST OF TABLES
Table 1.1: Techniques for treatment of cyanobacterial cells and their toxins ... 11 Table 1.2: Ratio of HOCl to OCl- and concentrations of the species at different pH. Initial
concentration 5.4 mg/L as Cl2 ... 13
Table 2.1: The summary of various chlorination experiments conducted in this study ... 19 Table 3.1: First-order apparent rate constants (kCl2) in s
-1
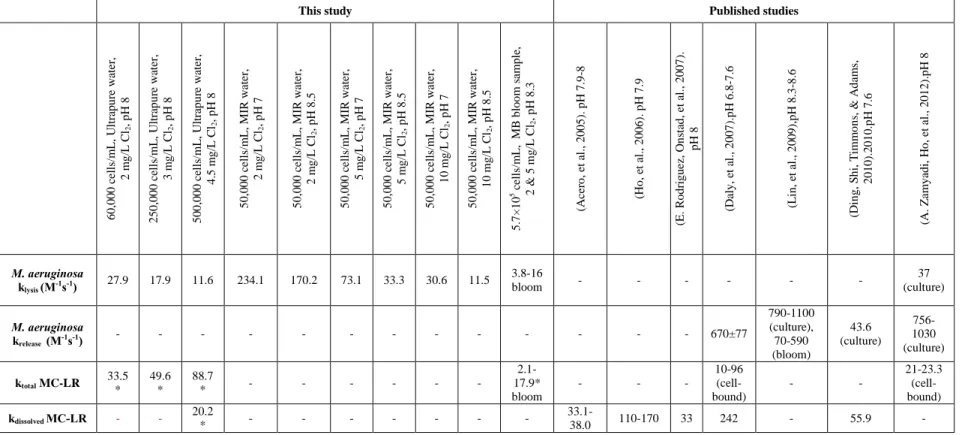
for chlorine decay ... 27 Table 3.2: Apparent rate constants for cell lysis or reduction in total cell count (klysis - M-1s-1), for
loss of cell integrity or cell rupture (krelease - M-1s-1), for total toxins oxidation (ktotal - M-1s-1)
and for the oxidation of dissolved toxins released from damaged cells (kdissolved - M-1s-1)
derived from this study compared to published results. Comments in parenthesis describe the origin of the CB cells (from laboratory cultures or environmental bloom samples) and the toxins (from standard extracts or cell-bound) (* MC-LR equivalent) ... 32 Table 3.3: DBP formation in chlorination of lysed M. aeruginosa suspension of 500,000 cells/mL
LIST OF FIGURES
Figure 1-1: Chemical structures of different variants of microcystin (MC), 3-desmethylmicrocystins (dmMC) ... 8 Figure 3-1: Chlorine demand of M. aeruginosa suspensions in (a) ultrapure water with 60,000,
250,000 and 500,000 cells/mL under 2, 3 and 4.5 mg/L Cl2 respectively at pH 8, and 50,000
cell/mL in MIR water under 2, 5 and 10 mg/L Cl2 (b) at pH 7, (c) pH 8.5, and (d) chlorine
demand in Missisquoi Bay (MB) bloom water samples with 5.7×10⁵ (±4%) cells/mL at ambient pH (pH ambient before chlorination was 7.8; pH augmented to 8.1 and 8.3 after chlorination with 2 and 5 mg/L Cl2 respectively, and remained constant for the rest of the
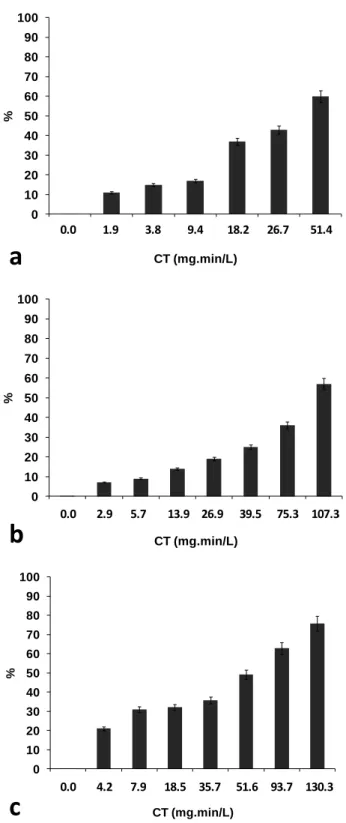
experiment) ... 26 Figure 3-2: Reduction in number of cells (cell lysis) during chlorination of M. aeruginosa
suspensions of (a) 60,000 cells/mL with 2 mg/L Cl2, (b) 250,000 cells/mL with 3 mg/L Cl2,
and (c) 500,000 cells/mL with 4.5 mg/L Cl2, in ultrapure water at pH 8 ... 29
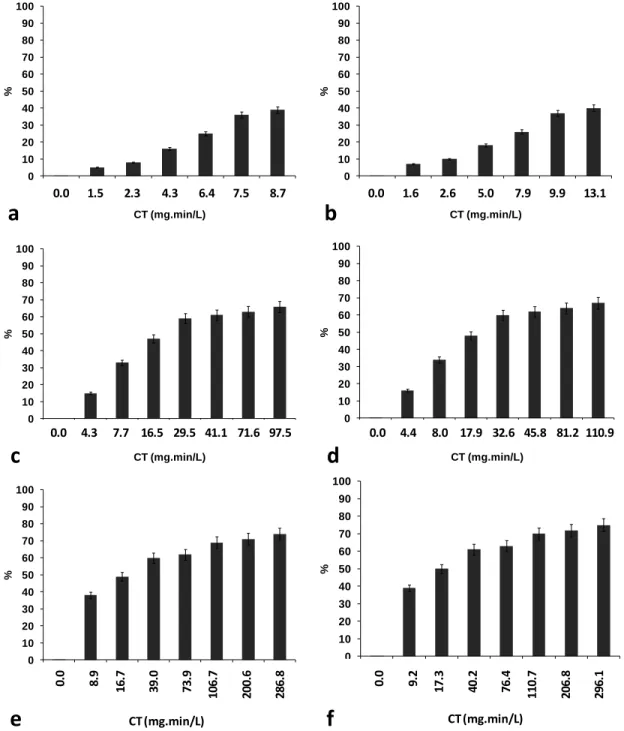
Figure 3-3: Reduction in number of cells (cell lysis) during chlorination of M. aeruginosa suspensions (50,000 cells/mL) in MIR water (a) at pH 7 with 2 mg/L Cl2, (b) at pH 8.5 with
2 mg/L Cl2, (c) at pH 7 with 5 mg/L Cl2, (d) at pH 8.5 with 5 mg/L Cl2, (e) at pH 7 with 10
mg/L Cl2, and (f) at pH 8.5 with 10 mg/L Cl2 ... 30
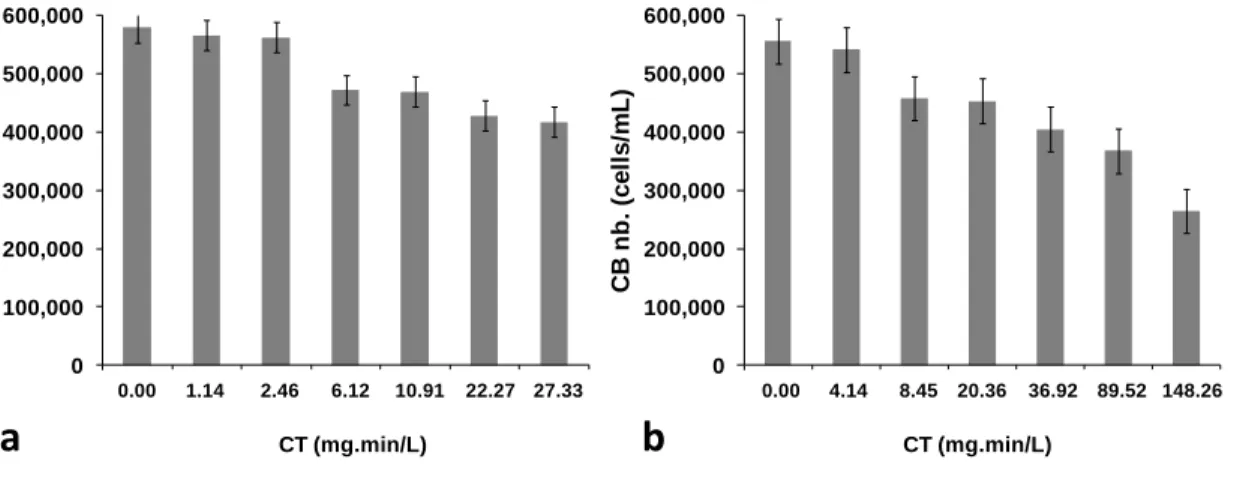
Figure 3-4: Cell numbers after chlorination of Missisquoi Bay bloom water samples using (a) 2 mg/L Cl2, and (b) 5 mg/L Cl2 ... 33
Figure 3-5: Proportion of seven cyanobacteria (CB) species out of total cyanobacteria cell in Missisquoi Bay bloom sample (a) before chlorination (5.7×10⁵ (±4%) cells/mL), and (b) after chlorination using a CT of 148 mg.min/L (2.7×10⁵ (±4%) cells/mL – 53% reduction of total cell numbers) ... 33 Figure 3-6: Toxins release and oxidation from M. aeruginosa suspensions in ultrapure water at
pH 8 with cell number and chlorine doses of (a) 60,000 cells/mL and 2 mg/L Cl2, (b)
250,000 cell/mL and 3 mg/L Cl2, and (c) 500,000 cells/mL and 4.5 mg/L Cl2, respectively 36
Figure 3-7: Toxins release and oxidation after chlorination of Missisquoi Bay bloom water samples (approximately 5.7×10⁵ ±4% cells/mL) using 2 and 5 mg/L Cl2 ... 37
Figure 3-8: DOC release from chlorination of M. aeruginosa suspensions in (a) ultrapure water at pH 8 and (b) MIR water at pH 8.5 spiked with 50,000 cells/mL (results in MIR water at pH 7 were similar to those of pH 8.5) ... 39
LIST OF ABBREVIATIONS
ADN 3-amino-9-methoxy-2, 6, 8-trimethyl-10-phenyldeca-4, 6-dienoic acid ANTXs Anatoxins
AOM Algogenic organic matter
CB Cyanobacteria
Cl2 Chlorine
CYL Cylindrospermopsin DBP Disinfection by-products DOC Dissolved organic carbon
ELISA Enzyme-linked immunosorbent assays EOM Extracellular organic matter
GTXs Gonyautoxins
HPLC High performance liquid chromatography IOM Intracellular organic matter
LD50 Lethal dose 50 LPS Lipopolysaccharides MCs Micorystins
MC-LR Microcystin- leucine arginine Mdha N-methyldehydroalanine
MMPB 3-menthoxy-2-methyl- 4-phenylbutyric acid
MS Mass spectrograph
NODs Nodularins
NOM Natural organic matter PDA Photo-diode array
PPIA Protein phosphatise inhibition assays TOC Total organic carbon
LIST OF APPENDICES
APPENDIX 1: Cyanotoxin name, producer organisms and health effects ... 51 APPENDIX 2: Measurement methods for cyanotoxins ... 52 APPENDIX 3: Conventional treatments of cyanobacteria ... 54 APPENDIX 4: Chlorination of Microcystis aeruginosa: toxin release and oxidation, cellular
chlorine demend and disinfection by-products formation ... 56 APPENDIX 5: Toxic cyanobacterial breakthrough and accumulation in a drinking water plant: A
INTRODUCTION
Background
Nowadays, because of climate change (especially global warming) and increasing eutrophication of waters, the occurrence of cyanobacteria blooms is becoming more and more frequent and has been highlighted as a great concern worldwide. Cyanobacteria, as known as blue-green algae, are oxygenic photosynthetic prokaryotes commonly existing in almost every conceivable freshwater, marine and terrestrial environment and also can be found in some extreme habitats (Chorus & Bartram, 1999). A number of them can produce lethal toxins (cyanotoxins) as well as taste and odour substances, which are counted as severe problems in drinking water resources (Miao & Tao, 2009).
Cyanotoxins have been responsible for death of animals and human illness in many countries. Microcystins (MCs), which were first extracted from the genera of cyanobacteria Microcystis
aeruginosa, are hepatotoxins and the most frequently detected cyanotoxins in harmful
cyanobacteria blooms from fresh water (Chorus & Bartram, 1999). Because of liver damage caused by microcystins, the symptoms of human illness are gastroenteritis and allergic or irritation reactions (Brookes et al., 2008; Merel, Clément, & Thomas, 2010). Furthermore, MCs have also been reported as potential tumour promoters in rats and mice (I. R. Falconer, 1991; Ho et al., 2006). Thus, chronic exposure to even low concentrations of microcystins can result in a serious health issue in humans (de Figueiredo, Azeiteiro, Esteves, Gonçalves, & Pereira, 2004). Among MCs, microcystin-LR (MC-LR) is the most frequent and toxic MC with an LD50 of 50 µg/kg of body weight (E. M. Rodriguez, Acero, Spoof, & Meriluoto, 2008; Westrick, Szlag, Southwell, & Sinclair, 2010). The World Health Organization (WHO) has set a provisional guideline value of 1.0 µg/L for MC-LR in drinking water (World Health Organization (WHO), 1998). This value has been adopted and used as a basis in many countries; Canadian Guideline for Drinking Water Quality for MC-LR is a proposed value of 1.5 µg/L which was established by Health Canada (Health Canada, 2007).
In Canada, cyanobacteria and their toxins, mianly microcystins, have been detected commonly in fresh water sources, especially during the seasons of summer and autumn (Jones, Gurney, & Rocan, 1998; Kotak & Zurawell, 2007; McQuaid, Zamyadi, Prévost, Bird, & Dorner, 2011). In
Quebec, 30.9% of raw water samples collected in the supply of drinking water plants using high risk sources dominated by potentially toxic cyanobacteria in 2004; this percentage increased to 82.6% in 2006 (Robert, 2008). In addition, the maximum concentration of cyanotoxins detected in these samples of raw water was 5.35 μg/L equ. MC-LR (Carrière, Prévost, Zamyadi, Chevalier, & Barbeau, 2010; Robert, 2008). Obviously, to minimize the threat of toxins, the treatment for cyanobacteria and their toxins is necessary.
To choose proper treatment of cyanobacteria and cyanotoxins, it is important to consider both cell-bound and dissolved components. In aquatic systems, most of cyanotoxins usually remain contained within intact cells (cell-bound toxins), and the remaining are extracellular dissolved toxins (Chorus & Bartram, 1999; Donati, Drikas, Hayes, & Newcombe, 1994). Conventional treatment processes (coagulation, flocculation, sedimentation and filtration) is effective for removal of cyanobacterial cells but inadequate for removing dissolved cyanotoxins (Chow, Drikas, House, Burch, & Velzeboer, 1999; Svrcek & Smith, 2004). Chemical oxidation with some common oxidants, such as chlorine, chloramines, ozone, chlorine dioxide and potassium permanganate, is a promising option as a safe barrier against cyanobacteria and their toxins (Hou, Hu, Jia, & Liu, 2008; E. M. Rodriguez, et al., 2008). Furthermore, the oxidation could be considered as a pre-treatment function or a disinfection stage.
There are increasing interests regarding the pre-treatment by oxidation, because of a wide variety of uses including: control of biological growth, tastes and odours and oxidizing organic matter to improve the coagulation/flocculation (Chorus & Bartram, 1999). Also, pre-chlorination at the raw water intake or intermediate chlorination ahead of the filters are still practiced in many water treatment plants. In drinking water pre-treatment, the addition of oxidants such as chlorine (Cl2)
to untreated water prior to coagulation has been shown to increase the removal of cyanobacteria cells and improve the following treatment processes (J. Plummer & Edzwald, 2002). However, it can also cause several water quality problems by decomposing of cells, e.g. increased chlorine demand, elevated chlorination by-products (DBP) formation, the release of DOC and cell-bound toxin and consequent increase in dissolved toxin levels (Daly, Ho, & Brookes, 2007). Therefore, pre-chlorination should be investigated to choose the suitable treatment conditions (i.e. dose, pH, contact time), which can be more effective on killing cyanobacteria cell, oxidizing released toxins to non toxic materials, controlling the DOC release and avoiding the DBP formation. Otherwise,
it would cause cell lysis and released toxins might end up in treatment station even in treated water.
Objectives
This study is to examine the effects of chlorine pre-treatment on cyanobacterial cells (cultured
Microcystis aeruginasa and natural bloom) and their associated toxins. The specific objectives of
this research are to:
1. Determine and to model the M. aeruginosa cells lysis, toxins and DOC release, and MCs oxidation during chlorination of ultrapure and natural water spiked with laboratory cultures;
2. Estimate the M. aeruginosa cellular chlorine demand when cell lysis occurs due to chlorination;
3. Study the DBP formation associated with the chlorination of M. aeruginosa cell-bound materials;
4. Evaluate the efficiency of chlorination of toxic cyanobacterial cells in natural bloom samples.
Structure of the thesis
Chapter 1 will present the literature review by providing an in-depth review of the current knowledge of cyanobacteria and their toxins, the measurement methods of cyanotoxins and the treatment by chlorination. Chapter 2 will provide the materials and methods used for the laboratory testing. The results and discussions will be then presented in Chapter 3. Finally, the conclusions and recommendations will be given at the end in the Conclusion chapter.
CHAPTER 1
LITERATURE REVIEW
1.1 Cyanobacteria
Cyanobacteria, also known as blue-green algae, are a large and heterogeneous group of asexual photosynthetic micro-organisms that possess the ability to synthesize chlorophyll a (Hou, et al., 2008). They commonly exist in a wide variety of freshwater, marine and terrestrial environments and also can be found in some extreme habitats, such as hypersaline, hot springs (at temperature up to 72 oC), and deserts (Chorus & Bartram, 1999).
Cyanobacteria had been classified with the algae because of their mechanism of photosynthesis; however, they are unicellular or multicelluar prokaryotes (i.e. whose cells lack a cell nucleus and have no membrane-bound sub-cellular organelles) with gram-negative cell walls (Hou, et al., 2008); whereas the cells of algae and plants are eukaryotic. They are classified within Eubacteria due to their cell structure and consist of more than 120 genera and 2000 species (Gerrath, Wehr, & Sheath, 2003). Most cyanobacteria can grow with light as an energy source through CO2
-dependent oxygen-evolving photosynthesis (Chorus & Bartram, 1999). The photosynthetic pigments of cyanobacteria, which contribute to the variety of cell colors from blue-green to violet-red, are chlorophyll a and accessory light-harvesting pigments such as phycocyanin, allophycocyanin and phycoerythrin (Chorus & Bartram, 1999). Many species of cyanobacteria have the ability of nitrogen-fixing (convert atmospheric N2 to NH3) which contribute greatly to
the nitrogen economy of aquatic and terrestrial habitats (Fay, 1992; Oliver & Ganf, 2000; Svrcek & Smith, 2004).
Cyanobacteria have been found as fossils in early Archaean rocks of Western Australia dated 3.3- 3.5 billion year ago (Hudnell, 2008; Sedmak & Kosi, 1998). Cyanobacteria are thought to be one of the pioneer oxygen-producing photosynthetic organisms on the early Earth and likely responsible for the conversion of the atmosphere from anaerobic to aerobic (Chorus & Bartram, 1999; Svrcek & Smith, 2004). Today, they still remain important as primary producers in marine environment.
1.2
Harmful effects and occurrence of cyanobacterial blooms and
cyanotoxins
As known to all, cyanobacteria are integral parts of many ecosystems. However, there has been an increasing occurrence of cyanobacterial blooms and cyanotoxins (Paul, 2008; Svrcek & Smith, 2004). Cyanobacterial bloom, which is a rapid enlarge or dense accumulation of numerous buoyant cyanobacterial cells or colonies in an aquatic systems, occur when a combination of favourable conditions such as nutrient enrichment (particularly phosphorus and nitrogen), warm temperature (15 oC to 30 oC), neutral to alkaline pH (pH 6 to 9), and calm stable waters (W.W. Carmichael, 1994; Hitzfeld, Höger, & Dietrich, 2000; Newcombe, House, Ho, Baker, & Burch, 2010). Therefore, the increased eutrophication and climate change (especially global warming) caused by human actions and activities, are majorly responsible for the formation of bloom (Anderson, Glibert, & Burkholder, 2002; El-Shehawy, Gorokhova, Fernández-Piñas, & del Campo, 2012; Paerl & Paul, 2012).
Cyanobacterial blooms are undesirable. They hinder drinking, recreational and agricultural use of water bodies by producing offensive taste and odour compounds (such as geosmin and 2-methylisoborneol) and contributing to total organic carbon (TOC) and turbidity (Nguyen et al., 2005; Taylor et al., 2006). More importantly, 60 to 70% of observed cyanobacterial bloom includes toxin-producing strains of cyanobacteria (Fawell, Hart, James, & Parr, 1993); and the substaintial amounts of harmful cyanotoxins can be released into watershed during the death and lysis of cells in a cyanobacterial bloom (W.W. Carmichael, 1994; W. W. Carmichael, 2001; Svrcek & Smith, 2004). Cyanotoxins, as secondary metabolites produced by a small group of cyanobacteria mainly include Anabaena, Aphanizomenon, Cylindrospermopsis, Lyngbya,
Microcystis, Nodularia, Nostoc, Oscillatoria, and Planktothrix. They are accountable for animal
poisoning, human gastroenteritis, dermal contact irritations, allergic response and primary liver and kidney damage in humans (W. W. Carmichael, 2001; Codd, 2000; Duy, Lam, Shaw, & Connell, 2000; I.R. Falconer & Humpage, 2005). The main toxins are microcystins, anatoxins, cylindrospermopsins and saxitoxins (Duy, et al., 2000).
The harmful cyanobacterial events due to the presence of cyanobacterial blooms and cyanotoxins have been found worldwide since the first report of animal deaths after livestock ingested water during a cyanobacterial bloom in Australia in 1878 (Codd, Lindsay, Young, Morrison, &
Metcalf, 2005). In May 2007, a harmful cyanobacterial bloom event occurred in a large area of China’s third largest freshwater lake-Taihu of Wuxi which threatened the supply of drinking water and fisheries-related food supplies for more than 8 million people (Cong, Shi-xin, Yi, & Fu-li, 2009; Liu, Chen, Li, Huang, & Shen, 2011). In Scotland, Ireland and New Zealand, dog deaths have occurred after eating fragments of anatoxin-a- producing cyanobacteria and drinking the water nearby (Codd, et al., 2005). A study has shown that anatoxin-a- and microcystin-containing cyanobacterial blooms have resulted in numerous cattle deaths in small lakes at alpine summer pastures in Switzerland (Mez et al., 1997). Although many reports of cyanobacteria poisonings involve the death of animals, some publications have proven that it could also be fatal to humans (Svrcek & Smith, 2004). In Brazil, 52 deaths of dialysis patients from water contaminated with cyanotoxins were reported (Jochimsen et al., 1998).
Cyanobacteria associated with the production of microcystins were detected in 539 of 677 (80%) raw water sources in 45 North American cities (W.W. Carmichael, 2000). Another study showed that the microcystins have been found in the majority of raw water samples from 33 American water supplies; but only 7% of samples had more than 1 μg/L of microcystin (Haddix, Hughley, & Lechevallier, 2007). In Canada, cyanobacteria and their toxins, especially microcystins, have been detected in multiple lakes, some of which are drinking water sources (Jones, et al., 1998). In Alberta, cyanotoxins have been found in 67% of samples of raw water from drinking water facilities, with a maximum total microcystin concentration of 14.8 μg/L (Kotak & Zurawell, 2007; Zurawell, 2002). In Québec, 78.2% of raw water samples collected in the supply of plants using high risk sources contained one or more species of toxic cyanobacteria in 2004; this percentage increased to 87% in 2006. In addition, the maximum concentration of microcystins (in all forms) measured in raw water was 5.35 μg/L (Carrière, et al., 2010; Robert, 2008).
1.3
Classification of toxins and principal toxins
At least a third of the 50 known genera of cyanobacteria can produce toxins as secondary metabolites (Yoo, Carmichael, Hoehn, & Hrudey, 1995). The toxins are generated in all cyanobacteria growth cycle and remain mostly in the cell (cell-bound toxin) until age or stress result in their release into the surrounding water to form dissolved toxin during cell lysis (Svrcek & Smith, 2004). Cyanotoxins usually fall into three groups based on their chemical structure: cyclic peptides, alkaloids, and lipopolysaccharides (LPS) (Chorus & Bartram, 1999). They can
also be classified into four classes according to the mechanisms of toxicity: hepatotoxins, neurotoxins, general cytoxins, and endotoxins (Newcombe, Cook, Brooke, Ho, & Slyman, 2003; Yoo, et al., 1995). The cyanotoxins produced by the specific species of cyanobacteria and their health effects are listed in Appendix 1.
Hepatotoxins
Hepatotoxins are natural products with molecular weight of 800-1,100 Daltons that demage the liver. They contain either five (nodularins) or seven (microcystins) amino acids, with two terminal amino acids being joined to form cyclic compounds. The most frequently detected cyanotoxins in harmful cyanobacteria blooms from fresh water is the microcystin family (Brookes, et al., 2008; Chorus & Bartram, 1999).
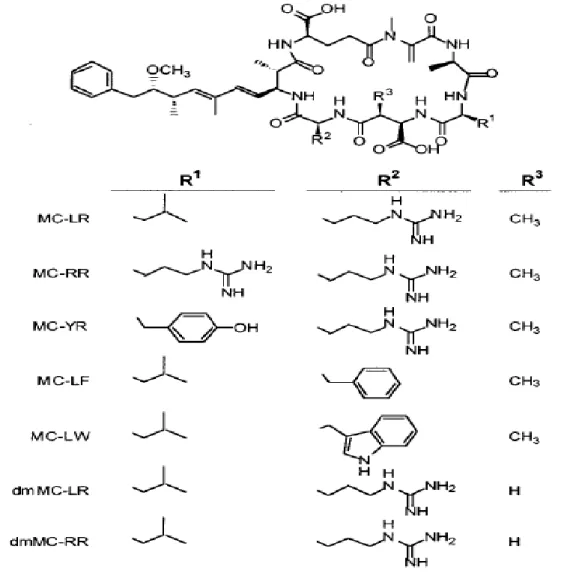
Microcystin
Figure 1-1 shows the chemical structures of different variants of microcystins. Structurally, microcystins (MCs) are monocyclic heptapeptide made from seven amino acids with medium molecular masses around 1,000 Daltons (Westrick, et al., 2010). The conserved toxic moiety is 3-amino-9-methoxy-2, 6, 8-trimethyl-10-phenyldeca-4, 6-dienoic acid (Adda) and the other mostly conserved unit is N-methyldehydroalanine (Mdha) (Chorus & Bartram, 1999; Westrick, et al., 2010). They consist of more than 60 reported variants; however, microcystin-LR (MC-LR) with the variable amino acids leucine (L) and arginine (R) is the most frequent and toxic MC, with an LD50 value of 50 µg/kg (E. M. Rodriguez, et al., 2008; Westrick, et al., 2010). MC-RR, MC-YR
and MC-LA also occur more frequently in freshwaters (de Figueiredo, et al., 2004). Based on animals studies of MC-LR toxicity, the World Health Organization (WHO) has set a provisional guideline value of 1.0 µg/L for MC-LR in drinking water (World Health Organization (WHO), 1998). This value has been adopted and used as a basis in many countries such as Brazil, New Zealand, and UK. Canadian Guideline for Drinking Water Quality for MC-LR is at the approval stage with a proposed value of 1.5 µg/L which was established by Health Canada (Health Canada, 2007). The Institut national de Santé publique du Québec also suggested a provisional value of 3.7 µg/L for anatoxin-a currently ((INSPQ), 2004).
Microcystins were first extracted from the genera of cyanobacteria Microcystis aeruginosa and have been found frequently in genera Anabaena, Anabaenopsis, Aphanicapsa, Hapalosiphon,
Microcystis, Nastoc, and Oscillatoria (Chorus & Bartram, 1999). Once absorbed by the
organism, microcystins primary target is liver where protein phosphatase is inhibited and phosphorylated proteins are accumulated; they result in the disruption of the hepatocyte skeletal structure and cell integrity leading to acute or chronic liver injury (Brookes, et al., 2008; Merel, Clément, Mourot, Fessard, & Thomas, 2010). The symptoms of human illness attributed to the microcystins are gastroenteritis and allergic or irritation reactions (Brookes, et al., 2008). In addition, microcystins have also been reported as potential tumor promoters in rats and mice (I. R. Falconer, 1991; Ho, et al., 2006). Thus, chronic exposure to even low concentrations of microcystins can result in the promotion of cancer in humans (de Figueiredo, et al., 2004).
Figure 1-1: Chemical structures of different variants of microcystin (MC), 3-desmethylmicrocystins (dmMC) (from (Fischer et al., 2001))
1.4
Measurement methods for cyanotoxins
In order to monitor cyanotoxins in water systems and assess their behavior during water treatment, some robust and sensitive analytical measurement methods are required and have been developed (B. Nicholson & Shaw, 2011). The common analytical methods available for cyanotoxin range from immunological or biochemical screening techniques based on enzyme-linked immunosorbent assays (ELISA) and enzyme activity (protein phosphatase inhibition assays, PPIA ) respectively, to quantitative chromatographic techniques based on high performance liquid chromatography (HPLC) with various detections (ultraviolet, UV; photo-diode array, PDA; mass spectrograph, MS or fluorescence detection) and more sophisticated liquid chromatography-mass spectrometry (LC-MS) (Newcombe, et al., 2010; B. C. Nicholson & Burch, 2001).
Capillary electrophoresis (CE) and 3-menthoxy-2-methyl-4-phenylbutyric acid (MMPB) method are less common analytical techniques and have been evaluated in some laboratories (B. Nicholson & Shaw, 2011; B. C. Nicholson & Burch, 2001). Animal bioassays (mouse tests) are also available for screening all toxic substances of cyanobacteria. A table comparing common methods of measuring cyanotoxins and general considerations for optimum measurement is presented in Appendix 2.
1.5 Treatment methods of cyanobacteria
As the final option to minimize the threat of cyanobacteria and cyanotoxins in water supplies, a number of physical, chemical and biological treatment technologies have been investigated in many reports. As mentioned previously, a normal cyanobacteria cell can contain high concentrations of toxin and/or taste and odour compounds confined within its wall (Chorus & Bartram, 1999; Newcombe, et al., 2010). In addition, cyanotoxins can be either found inside of cells (called intracellular/cell-bound cyanotoxins which can be released by cell lysis) or outside of cells (called extracellular/dissolved cyanotoxins) (Westrick, 2008). Especially under bloom conditions, a substantial proportion of cell-bound toxins would be released to the water column (Chorus & Bartram, 1999). Therefore, the efficiency of a treatment method depends on the form of the cyanobacteria (i.e. individual cells, filamentous etc), the total concentration of toxins, and whether it is dissolved or cell-bound. It is also important to consider whether the method causes
lysis of cells and oxidize dissolved toxins (Donati, et al., 1994; Hart, Fawell, & Croll, 1998; Svrcek & Smith, 2004).
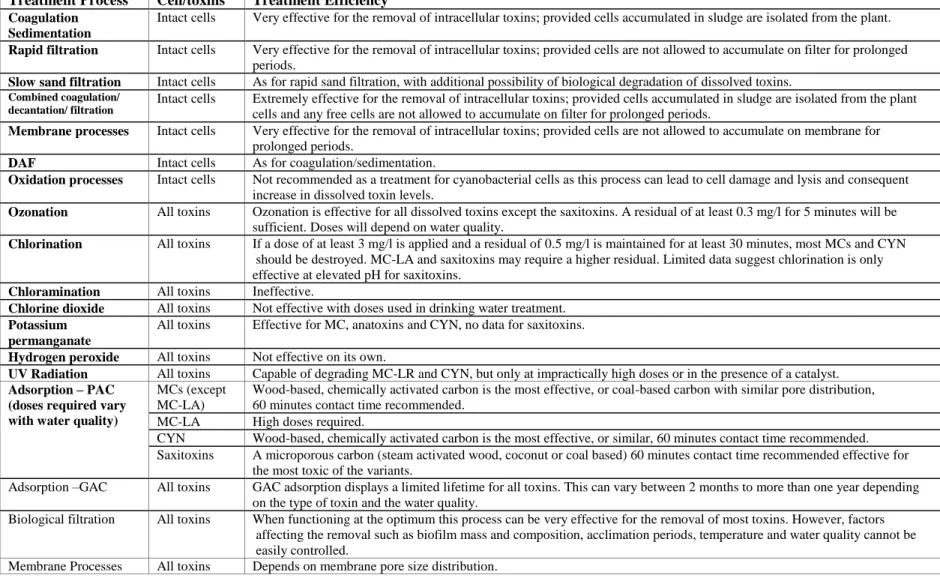
Table 1.1: Techniques for treatment of cyanobacterial cells and their toxins (adapted from (Brookes, et al., 2008; The Cooperative Research Centre for Water Quality and Treatment (Australia), 2007; Arasah Zamyadi, 2011)
Treatment Process Cell/toxins Treatment Efficiency Coagulation
Sedimentation
Intact cells Very effective for the removal of intracellular toxins; provided cells accumulated in sludge are isolated from the plant. Rapid filtration Intact cells Very effective for the removal of intracellular toxins; provided cells are not allowed to accumulate on filter for prolonged
periods.
Slow sand filtration Intact cells As for rapid sand filtration, with additional possibility of biological degradation of dissolved toxins.
Combined coagulation/ decantation/ filtration
Intact cells Extremely effective for the removal of intracellular toxins; provided cells accumulated in sludge are isolated from the plant cells and any free cells are not allowed to accumulate on filter for prolonged periods.
Membrane processes Intact cells Very effective for the removal of intracellular toxins; provided cells are not allowed to accumulate on membrane for prolonged periods.
DAF Intact cells As for coagulation/sedimentation.
Oxidation processes Intact cells Not recommended as a treatment for cyanobacterial cells as this process can lead to cell damage and lysis and consequent increase in dissolved toxin levels.
Ozonation All toxins Ozonation is effective for all dissolved toxins except the saxitoxins. A residual of at least 0.3 mg/l for 5 minutes will be sufficient. Doses will depend on water quality.
Chlorination All toxins If a dose of at least 3 mg/l is applied and a residual of 0.5 mg/l is maintained for at least 30 minutes, most MCs and CYN should be destroyed. MC-LA and saxitoxins may require a higher residual. Limited data suggest chlorination is only effective at elevated pH for saxitoxins.
Chloramination All toxins Ineffective.
Chlorine dioxide All toxins Not effective with doses used in drinking water treatment. Potassium
permanganate
All toxins Effective for MC, anatoxins and CYN, no data for saxitoxins. Hydrogen peroxide All toxins Not effective on its own.
UV Radiation All toxins Capable of degrading MC-LR and CYN, but only at impractically high doses or in the presence of a catalyst. Adsorption – PAC
(doses required vary with water quality)
MCs (except MC-LA)
Wood-based, chemically activated carbon is the most effective, or coal-based carbon with similar pore distribution, 60 minutes contact time recommended.
MC-LA High doses required.
CYN Wood-based, chemically activated carbon is the most effective, or similar, 60 minutes contact time recommended. Saxitoxins A microporous carbon (steam activated wood, coconut or coal based) 60 minutes contact time recommended effective for
the most toxic of the variants.
Adsorption –GAC All toxins GAC adsorption displays a limited lifetime for all toxins. This can vary between 2 months to more than one year depending on the type of toxin and the water quality.
Biological filtration All toxins When functioning at the optimum this process can be very effective for the removal of most toxins. However, factors affecting the removal such as biofilm mass and composition, acclimation periods, temperature and water quality cannot be easily controlled.
Membrane Processes All toxins Depends on membrane pore size distribution.
1.5.1 Conventional treatment
Conventional treatment for the removal of cyanobacteria and cyanotoxins consist of coagulation, flocculation, separation (sedimentation/flotation), and filtration processes (Svrcek & Smith, 2004). Many studies have reported that the application of conventional treatment is effective for the removal of cyanobacterial cells but ineffective for the removal of dissolved cyanotoxins (Chorus & Bartram, 1999; Chow, et al., 1999; Himberg, Keijola, Hiisvirta, Pyysalo, & Sivonen, 1989; Svrcek & Smith, 2004).
The specific performances of unit process of conventional treatment are shown in Appendix 3.
1.5.2 Chemical oxidation / Chlorination
Chemical oxidation processes in drinking water treatment can control colour and odour, reduce COD/BOD, remove both organic and oxdisable inorganic components, enhance coagulation/flocculation and iron or manganese oxidation (Chorus & Bartram, 1999). Many studies have reported that chemical oxidation is an effective method and a safe barrier against cyanobacteria and their toxins in order to decrease public health risk (Miao & Tao, 2009; E. Rodriguez, Majado, Meriluoto, & Acero, 2007). The oxidants investigated most commonly for cyanobacteria and cyanotoxin treatment are chlorine, chlorine dioxide, chloramine, ozone, and potassium permanganate (E. Rodriguez, Majado, et al., 2007). Meanwhile, the removal effects of these oxidants could be examined in post-oxidation and also in pre-oxidation (before cell removal).
High concentration cyanobacteria blooms in drinking water sources can cause serious problems in various stages of conventional water treatment, including poor coagulation/flocculation and separation, filter clogging, increased disinfectants demand, and unpleasant odors and tastes (Yun, Lim, Cho, & Park, 1997). Pre-oxidation is used for untreated water to reduce the biological growth of cyanobacteria in treatment plant and improve coagulation/flocculation and filtration processes (Chorus & Bartram, 1999; Petrusevski, van Breeman, & Alaerts, 1995). Nevertheless, it may also cause cell death or lysis to release toxins and odour/taste compounds. Therefore, in the presence of cyanobacteria cells, the dosage of oxidant in pre-treatment should be sufficient to meet the demand of the water including cells, and a residual required for oxidize both cell-bound
and dissolved toxins to non toxic materials (Chorus & Bartram, 1999; Miao & Tao, 2009; Newcombe, et al., 2010).
Chlorination
Chlorine is the chemical oxidant most frequently used for disinfection in water treatment in North America (Svrcek & Smith, 2004). The most reactive form of chlorine is hypochlorous acid (HOCl) which is in equilibrium with hypochlorite ion (OCl-) in solution. The chemical equation is given below:
HOCl <=> H+ + OCl
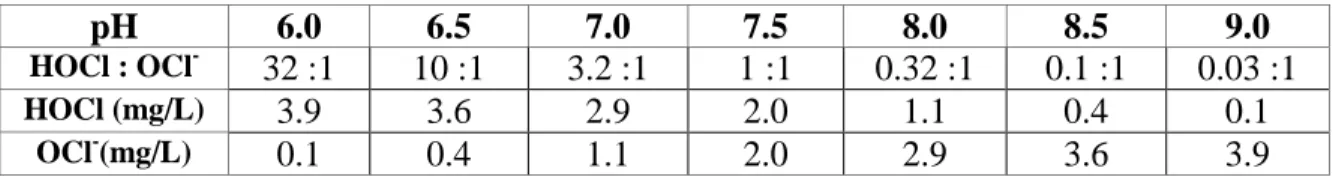
-The concentration of hypochlorous acid is dependent on the pH of water (Newcombe, et al., 2010). Table 1.2 shows the relative concentrations of the two major forms of chlorine over a moderate range of pH.
Table 1.2: Ratio of HOCl to OCl- and concentrations of the species at different pH. Initial concentration 5.4 mg/L as Cl2 (from (Newcombe, et al., 2010))
pH 6.0 6.5 7.0 7.5 8.0 8.5 9.0
HOCl : OCl- 32 :1 10 :1 3.2 :1 1 :1 0.32 :1 0.1 :1 0.03 :1
HOCl (mg/L) 3.9 3.6 2.9 2.0 1.1 0.4 0.1
OCl-(mg/L) 0.1 0.4 1.1 2.0 2.9 3.6 3.9
Early studies reported that chlorine was ineffective to destroy the microcystins, even at a substantial dosage of 5 mg/L (Himberg, et al., 1989). In these studies, chlorine may have been consumed by organic matter reported to be present, leaving no chlorine residual for the removal of microcystins; or chlorination may have carried out at a pH of relative low concentration of hypochlorous acid (Chorus & Bartram, 1999). Contrarily, some other studies demonstrated that chlorine has a potential capacity to remove cyanobacteria cells and some cyanotoxins under proper treatment conditions (Acero, Rodriguez, & Meriluoto, 2005; B. C. Nicholson, Rositano, & Burch, 1994; Tsuji et al., 1997). The post-oxidation during treatment, most often chlorination, is an essential barrier against dissolved and cell-bound cyanotoxins to prevent cells and toxins breakthrough (Pietsch, Bornmann, & Schmidt, 2002; A. Zamyadi et al., 2012). Direct chlorination of raw water or inter-chlorination is still very common in many North American water treatment plants. As known, there are many concerns regarding the pre-chlorination, especially in water containing significant cyanobacteria bloom, such as: cell damage and the
subsequent release of cell-bound cyanotoxins, increased chlorine demand, dissolved organic carbon (DOC) release and elevated harmful chlorination by-products (DBP) formation (Merel, Clément, Mourot, et al., 2010). However, it also may constitute a practical temporary treatment choice if it is proven to be efficient against both cell-bound and dissolved toxins, while still acceptable at short term in terms of other water quality parameters. Thus, it is very necessary to understand the conditions or limitations of post- and pre-chlorination of cyanobacteria cells and their toxins as used during drinking water treatment plant (DWTP) operation.
A study conducted by Nicholson et al. demonstrated that chlorine could be very effective to oxidize both microcystin and nodularin if a free chlorine residual of 0.5 mg/L were maintained after 30 min of contact time with pH value under 8 (B. C. Nicholson, et al., 1994). Other studies also showed that the efficiency of chlorination with cyanobacteria and their toxins depends on various experimental conditions (Merel, Clément, Mourot, et al., 2010; Newcombe & Nicholson, 2004; Xagoraraki et al., 2006).
For an efficient chlorination, the key parameters are the concentration of residual chlorine and the contact time. The appropriate degree of chlorination is estimated using the concept of concentration multiplied by time, chlorine exposure, or CT (Carrière, et al., 2010). The CT value is calculated by determining the area under a graph of chlorine concentration versus time (Ho, et al., 2006). The rates of cell lysis, MCs release, and MCs oxidation can present the degree of cell-bound and dissolved MCs chlorination under given water quality conditions (Daly, et al., 2007). The effect of pH on chlorination of cyanotoxins, especially for MCs, was commonly investigated, and a correlation on destruction efficiency was observed in many researches (Acero, et al., 2005; B. C. Nicholson, et al., 1994; E. Rodriguez et al., 2007; E. Rodriguez, Sordo, Metcalf, & Acero, 2007; Svrcek & Smith, 2004). The reaction between microcystins and HOCl mainly occurred in the range of pH 6 to 9; the reduction of toxin removal was examined with increasing pH above 8 because of the decreasing concentration of HOCl (Svrcek & Smith, 2004). Xagoraraki, et al., 2006 (Xagoraraki, et al., 2006) showed that microcystin-LR inactivation rate constant (k) by free chlorine was estimated to be the highest at 0.065±0.007 L/ (mg min) at pH 6 and the lowest at 0.005±0.001 L/ (mg min) pH 9 at 11 °C. Acero et al., 2005 (Acero, et al., 2005) also determined that the apparent second-order rate constant for the chlorination of microcystin-LR varied from 475 M-1s-1 at pH 4.8 to 9.8 M-1s-1 at pH 8.8. Therefore, chlorine is very efficient for oxidizing
dissolved MCs under various water quality conditions and the degradation of MCs is favoured at low pHs (Chorus & Bartram, 1999). For other cyanotoxins, cylindrospermopsin (CYN) degradation via chlorination with a free chlorine residual of 0.5 mg/L within a pH 6 to 9 could achieve > 99% (Senogles et al., 2000). A study found that the maximum apparent second-order rate constant for the reactivity of CYN with chlorine was 1265 M-1s-1 at pH 7 (E. Rodriguez, Onstad, et al., 2007). Saxitoxins (STX) are not as reactive with chlorine as microcystins (Newcombe, et al., 2010). A significant removal of STX by chlorine was shown only at high pH 8 to 9; STX degradation augmented from 20% to 98% when pH increased form 4 to 9 with a free chlorine residual of 0.5 mg/L after 30 min of contact time (Newcombe, et al., 2010; B. C. Nicholson et al., 2003).
Chlorination was also found to be efficient to oxidize M. aeruginosa cells and subsequently cell-bound MCs using elevated concentrations of laboratory cultured cells (3×10⁵–1×10⁶ cells/mL) in natural water (Daly, et al., 2007; Merel, Clément, Mourot, et al., 2010). In a recent study of Lin et al., 2009 (Lin et al., 2009), results of cell integrity of high concentration have shown that laboratory grown M.aeruginosa in nature water may be more resistant to cell demage by chlorination than Anabaena circinalis and the small M.aeruginosa colonies from natural blooms were more resistant than cell suspension of laboratory cultures. Finally, there is very limited information about the chlorination of the low concentration of dissolved and cell-bound MC-LReq from a natural bloom.
The predictable rapid cell rupture and subsequent release and oxidation of both dissolved and cell-bound cyanotoxins can be described by first-order apparent rate constant in most laboratory testing. A study showed that the rate constants of MCs oxidation calculated from spiked dissolved toxins in Myponga Reservoir Water are 2 to 24 times higher than those estimated from the chlorination of released cell-bound toxins from cell suspension (Daly, et al., 2007). More modest differences (1.2-1.5×) constant rates have been reported using lower cell densities of
Anabaena circinalis for cell bound saxitoxin and of M. aeruginosa for cell-bound MCs (A.
Zamyadi, Ho, Newcombe, Bustamante, & Prévost, 2012; A. Zamyadi et al., 2010). Due to limited study showing higher cyanobacteria cell resistance and poor oxidation of dissolved toxins in the presence of cell rupture, the efficiency of the oxidation of released cell-bound toxins from natural blooms has been more frently concerned (A. Zamyadi, MacLeod, et al., 2012). Besides, the knowledge of M. aeruginosa cellular chlorine demand which is required for optimal operation
of chlorination in DWTP is still undetermined. This information is important to ensure that sufficient chlorine capacity is present during peak cell concentration events.
The chlorination of drinking water can produce trihalomethanes (THMs) and other chlorinated by-products. Cyanobacteria cell and their excreted metabolic products may potentially contribute to the DBP formation (Bond, Henriet, Goslan, Parsons, & Jefferson, 2009; Huang et al., 2009; J. D. Plummer & Edzwald, 2001). Release of cell-bound compounds due to autolysis of cyanobacteria cells is classified as extracellular organic matter (EOM) and due to compromised lysis is categorised as internal organic matter (IOM) (Huang, et al., 2009). Both EOM and IOM could promote THMs and haloacetic acids (HAAs) production, due to the chlorination of released compouds (Bond, et al., 2009; Huang, et al., 2009). Some studies have reported the significant DBP formation (e.g. total THM yields from 67 to 269 µg/L) in connection to reactive carbon associated with high cell numbers and EOM (Huang, et al., 2009; A. Zamyadi, Ho, et al., 2012). However, chlorination of approximately 46,000 cells/mL of Anabaena circinalis in natural water (complete cell damage and below detection limit oxidation of produced saxitoxins) with a CT of 50.3 mg.min/L only increased 9 µg/L of total THM (TTHM) and 3 µg/L of HAA9 compared to the control assay (chlorination of natural water without cyanobacteria cells)(A. Zamyadi, et al., 2010).
The DBP formation potentials of IOM and EOM in chlorination depend on the various conditions especially chlorine doses, growth phase, species and culture conditions (Huang, et al., 2009).
CHAPTER 2
MATERIALS AND METHODS
2.1 Materials / Chemicals and Reagents
A toxic strain of M. aeruginosa, isolated from Pretzlaff Pond, Alberta, Canada, was cultured in the laboratory in artificial seawater medium (ASM-1) according to the method of Gorham, McLachlan, Hammer, & Kim, 1964 (Gorham, McLachlan, Hammer, & Kim, 1964). Distilled water (20 L) was fortified with nutrients according to the ASM-1 preparation, sterilized at 120oC, and then pH adjusted using NaOH 1M solution, inoculated with an ASM-1 grown culture in stationary phase. The culture was incubated at 26oC under 6 hours rotating light-darkness flux at
light intensity of 70 µmol s-1 m-2. All chemicals and reagents used were of the purest available quality to analytical grade in laboratory from various suppliers. Solutions of chlorine, phosphate buffers, quench solution and analytical reagents were prepared with ultrapure water.
2.2 Water Source
Natural water and ultrapure water were both used for chlorination experiments with the laboratory cultured M. aeruginosa. The experimental plan also included chlorination of Missisquoi Bay bloom water samples prior to any treatment (without filtration).
MIR Water: Natural water was sourced from Mille-îles River (MIR) in Laval, Quebec, Canada.
Samples were taken from the inlet of St-Rose drinking water treatment plant (DWTP) in Laval prior to any treatment on June 26, 2009. Untreated MIR water was filtered over 0.45 µm filters (HA 14250, Millipore) to remove suspended materials and then stored at 4 oC. The water had a dissolved organic carbon (DOC) of 6.3 mg/L as C, N-NH3 of 112.4 µg/L as N, true color of 43
CU (Color Units), and UV absorbance at 254 nm of 0.191 cm-1, pH of 7.4 and an alkalinity of 19
mg/L as CaCO3. True color and UV were measured on spectrophotometer (Milton Roy 1001
Plus). Before the chlorination experiments, the temperature of filtered MIR water should be adjusted from 4 oC to 20±2 oC (ambient temperature).
Ultrapure water: Ultrapure Milli-Q water (Millipore Pty Ltd, USA, 18.2 MΩ.cm @25 oC, TOC
of 1 µg/L) was used for selected experiments.
Missisquoi Bay bloom water samples: Environmental cyanobacterial bloom samples were
proximity of the water intake. In this water, the dissolved organic carbon (DOC) was 5.4 mg/L as C and the ambient pH was 7.8. The samples at cell number of approximately 5.7 × 10⁵ (±4%) cells/mL incorporated seven different cyanobacteria species dominated by Microcystis sp (A. Zamyadi, MacLeod, et al., 2012).
Before all DOC analyses, samples were filtered through pre-rinsed (1 L ultrapure water) 0.45 µm cellulose nitrate Supor®-450 membrane filters (PALL Life Sciences, USA). DOC measurements were measured using a 5310C total organic carbon analyzer (Sievers Instruments Inc., USA). pH values were measured using a Fisher Scientific pH meter (Accumet, Fisher Scientific Instruments, USA) which was calibrated with pH 4, 7 and 10 standard buffers (Fisher, USA).
2.3 Chlorination experiments
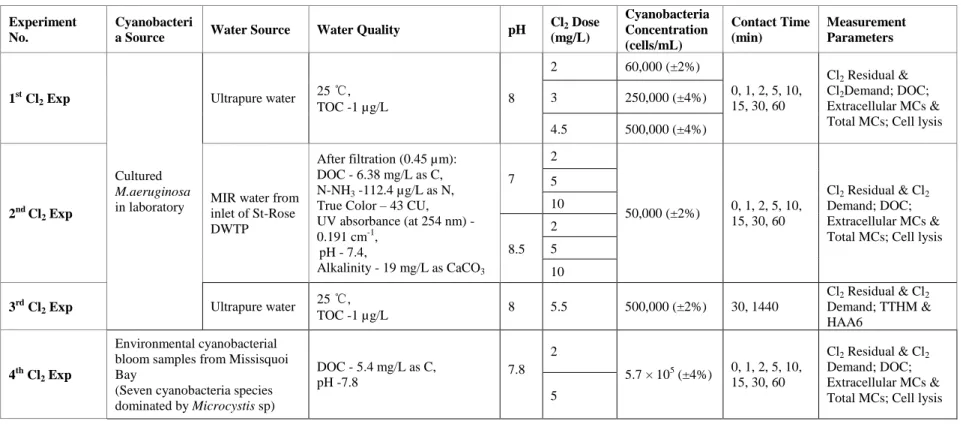
In this study, the chlorination experiments were conducted in different series with various experimental conditions. Table 2.1 shows the summary of various chlorination experiments conducted in this study. The first set of chlorination experiments (1st to 3rd Cl2 Exp) were
conducted using cultured M. aeruginosa. The second set of chlorination experiments were conducted directly on (4th Cl2 Exp) natural cyanobacteria bloom samples from Missisquoi Bay.
Table 2.1: The summary of various chlorination experiments conducted in this study
Experiment No.
Cyanobacteri
a Source Water Source Water Quality pH
Cl2 Dose (mg/L) Cyanobacteria Concentration (cells/mL) Contact Time (min) Measurement Parameters 1st Cl2 Exp Cultured M.aeruginosa in laboratory Ultrapure water 25 ℃, TOC -1 µg/L 8 2 60,000 (±2%) 0, 1, 2, 5, 10, 15, 30, 60 Cl2 Residual & Cl2Demand; DOC; Extracellular MCs & Total MCs; Cell lysis
3 250,000 (±4%)
4.5 500,000 (±4%)
2nd Cl2 Exp
MIR water from inlet of St-Rose DWTP
After filtration (0.45 µm): DOC - 6.38 mg/L as C, N-NH3 -112.4 µg/L as N,
True Color – 43 CU, UV absorbance (at 254 nm) - 0.191 cm-1, pH - 7.4, Alkalinity - 19 mg/L as CaCO3 7 2 50,000 (±2%) 0, 1, 2, 5, 10, 15, 30, 60 Cl2 Residual & Cl2 Demand; DOC; Extracellular MCs & Total MCs; Cell lysis 5 10 8.5 2 5 10 3rd Cl2 Exp Ultrapure water
25 ℃, TOC -1 µg/L 8 5.5 500,000 (±2%) 30, 1440 Cl2 Residual & Cl2 Demand; TTHM & HAA6 4th Cl2 Exp Environmental cyanobacterial bloom samples from Missisquoi Bay
(Seven cyanobacteria species dominated by Microcystis sp) DOC - 5.4 mg/L as C, pH -7.8 7.8 2 5.7 × 10⁵ (±4%) 0, 1, 2, 5, 10, 15, 30, 60 Cl2 Residual & Cl2 Demand; DOC; Extracellular MCs & Total MCs; Cell lysis 5
Chlorine stock concentrations and free chlorine residuals were determined using the DPD-FAS titration method (4500Cl-F. DPD Ferrous Titrimetric Method) described in Standard Methods (American Public Health Association (APHA), American Water Works Association (AWWA), & Water Environment Federation (WEF), 2005). Four chlorination experiments were conducted separately on: (1st Cl2 Exp) M. aeruginosa suspensions in ultrapure water; (2nd Cl2 Exp) M. aeruginosa suspensions in MIR water; (3rd Cl2 Exp) cell-bound M. aeruginosa cellular material
in ultrapure water; and (4th Cl2 Exp) natural cyanobacteria bloom samples from Missisquoi Bay.
Each chlorination experiment was preceded by a chlorine decay experiment. For chlorine decay experiments, water samples were dosed with the desired chlorine concentration and triplicate samples were taken at specified contact times for free chlorine residual mesurements using the titration method. All chlorination experiments were conducted in triplicate in brown amber bottles at room temperature (20 ± 2oC).
Cultured M. aeruginosa samples were taken for preservation in Lugol’s iodine solution before the enumeration of cells using a compound microscope (Nikon, Labophot-2, Phase contrast) in a Sedgewick-Rafter counting. Required volume of stationary phase culture to be spiked in ultrapure and MIR water to obtain the desired cell suspension was adjusted based on the culture cell number. The number of cells in water samples after inoculation was confirmed by microscopic enumeration. Control (non-chlorinated) water samples showed no sign of cell integrity loss due to direct addition of cells to ultrapure and MIR water. Detection of cells auto-fluorescence using the fluorescence microscopy method was used to assess the cells integrity. All chlorination experiments regardless of water quality parameters were conducted with a chlorine residual after 60 minutes of contact.
1st Cl2 Exp: These experiments were conducted in ultrapure water buffered at pH 8 with a 0.01
M phosphate buffer (KH2PO4/NaH2PO4) (American Public Health Association (APHA), et al.,
2005). Chlorine was added from the chlorine stock solution to obtain Cl2 doses of 2, 3 and 4.5
mg/L for M. aeruginosa suspensions of 60,000 (±2%), 250,000 (±4%) and 500,000 (±4%) cells/mL, respectively. Samples were quenched at various contact times (0, 1, 2, 5, 10, 15, 30 and 60 min) with sodium thiosulphate at a stoichiometric ratio specified in Standard Methods (American Public Health Association (APHA), et al., 2005). A portion of quenched samples (15 mL × 2) were taken through filteration for DOC measurement. To determine the cell lysis due to chlorination, total cell counts were conducted in triplicated on 2 mL samples after preservation in
Lugol’s iodine (Wetzel & Likens, 2000). Remaining quenched water samples were divided into two subsamples of 250 mL: the first subsample was immediately filtered through 0.45 µm filter and then analyzed for extracellular MCs; the second subsample was taken to three freeze–thaw cycles before the filtration to analyze for total MCs (both the cell-bound and extracellular compounds). For all MCs analysis, confidence limits were calculated using the standard deviations of triplicate measurements. For all experiments, the extracellular concentrations of MCs were always within or below the confidence limit of total concentration. The differences between total and extracellular levels of MCs were estimated as cell-bound.
2nd Cl2 Exp: These experiments were conducted in buffered MIR water with pH 7 and 8.5.
Chlorine was added from the chlorine stock solution to achieve the Cl2 doses of 2, 5 and 10 mg/L
for M. aeruginosa suspension of 50,000 (±2%) cells/mL. Similar to “1st Cl2 Exp” quenched
samples were taken for DOC, extracellular MCs and total MCs measurements and cell lysis determination. . Cell densities (50,000 cells/mL corresponding to 0.12 mg/L DOC) were constant (±2%) and background MIR water DOC varied by less than 10%.
3rd Cl2 Exp: These experiments were conducted on M. aeruginosa suspension of 500,000 (±2%)
cells/mL in ultrapure water buffered at pH 8. Cultured cells were filtered and re-suspended in ultrapure water to eliminate the contribution of EOM. No sign of cell integrity loss was observed due to separation of cells from the culture media (data not shown). The M. aeruginosa suspension was subjected to three freeze–thaw cycles to release intracellular compounds before chlorination (McQuaid, et al., 2011). Chlorine was added from the chlorine stock solution to obtain the Cl2
dose of 5.5 mg/L. Residual chlorine concentrations were determined after 30 and 1440 minutes of contact times and then samples were quenched with sodium thiosulphate. Quenched samples were taken for DOC and DBP measurements.
4th Cl2 Exp: These experiments were conducted in Missisquoi Bay bloom water samples with 5.7
× 105 (±4%) cells/mL at ambient pH 7.8. Chlorine was added from the chlorine stock solution to obtain the Cl2 doses of 2 and 5 mg/L. Similar to “1st Cl2 Exp” quenched samples were taken for
2.4 Taxonomic counts with species identification
Taxonomic counts with species identification were performed using inverse microscopy (Lund, Kipling, & Le Cren, 1958; Wetzel & Likens, 2000) by the Centre d’Expertise en Analyse Environmentale du Québec (CEAEQ) at MDDEP. Temperature, pH, turbidity, as well as the initial and residual chlorine dosage values were collected from the records of the DWTP for the time period of concern.
2.5 Analysis of MCs and DBPs
A commercial Abraxis Microcystins ADDA ELISA Plate (an enzyme-linked immunosorbent assay – Abraxis LLC, Pennsylvania, USA) was used for MCs measurements. The analyses of MCs concentrations were measured as μg/L of MC-LR equivalent (MC-LR eq.). The detection limit for this assay is 0.1 µg/L as MC-LR.
DBP analyses were conducted by the laboratory of NSERC Industrial Chair on Drinking Water at Ecole Polytechnique de Montreal (Canada) using modified United States Environmental Protection Agency (USEPA) method 501.2 as described by Koch, Crofts, Schimpff, & Davis, 1988 (Koch, Crofts, Schimpff, & Davis, 1988) for THM analysis and USEPA method 552.2 for HAA. These samples were analyzed for four THMs (bromoform, chloroform, bromodichloromethane, and dibromochloromethane) as total THM (TTHM) and six HAA (bromoacetic acid, bromochloroacetic acid, chloroacetic acid, dibromoacetic acid, dichloroacetic acid, and trichloroacetic acid) as HAA6. They were measured using a Varian CP-3800 Gas Chromatograph (GC-ZCDs) with an electron capture detector (GC/ECD).
2.6 Data analysis
Chlorine exposure, CT, which is simplified by multiplying the residual concentration of chlorine by the exposure time as intermediate chlorine concentrations are not known (Equation 1) (Carrière, et al., 2010). The CT value is calculated by determining the area under a graph of chlorine concentration versus time (Ho, et al., 2006).
CT = Cl 0t tdt Equation 1
Where CT equals the chlorine exposure; t equals contact time; [Cl] t equals the chlorine residual
The first-order rate constans (kCl2) for chlorine decay were determined using Equation 2.
Cl t
Cl 0 = - kCl2t Equation 2
Where Cl t equals the concentration of free chlorine residual at specified contact time t;
Cl 0 equals the concentration of free chlorine at contact time = 0; kCl2 equals the first order
constants for chlorine decay; t equals contact time.
Reactions between chlorine and the M. aeruginosa cells and MCs are of second order, can also be described as first order to CT (Daly, et al., 2007; Lin, et al., 2009; A. Zamyadi, MacLeod, et al., 2012). In this study, cell lysis is defined by the reduction of cells resulting from sufficient cell damage to render undetectable under the microscope in a preserved sample. Equation 3 was used to calculate the toxin degradation or cell lysis apparent rate constants for these chlorination experiments (Daly, et al., 2007).
k CT X X Ln CT 0 Equation 3where CT equals the chlorine exposure; XCT equals the number of lysed cells or MC-LR eq.
concentration after a given chlorine exposure; X0 equals the number of lysed cells or MC-LR eq.
concentration at CT=0; and k equals the rate at which M. aeruginosa cells (klysis) or MC-LR eq
CHAPTER 3
RESULTS AND DISCUSSION
Results presented in this chapter include results that were included in the publication submitted to Water Research “Chlorination of Microcystis aeruginosa: Toxin release and oxidation, cellular chlorine demand and disinfection by-products formation” by authors Arash Zamyadi, Yan Fan, Rob I. Daly and Michèle Prévost. This publication uses the results produced by this experimental work. The results of this study are also included in a modelling effect which is not in the fram work of this thesis. The importance of my contribution is recognized by the fact that I am positioned as one of the authors. The article which has been accepted for publication in Water Research is presented in Appendix 4.
Also included in this chapter are results used for the publication Zamyadi et al 2012 (A. Zamyadi, MacLeod, et al., 2012). My results are specifically presented in the figures 4, 5, 6 and 7 in which I am a co-author of this publication “Toxic cyanobacterial breakthrough and accumulation in a drinking water plant: a monitoring and treatment challenge” which is presented in Appendix 5.
3.1 Impact of cyanobacterial celluler compounds and water matrix on
chlorine demand
Free chlorine decay and cell lysis experiments were performed: (1) using cultured M. aeruginosa spiked in ultrapure water (60,000±2%, 250,000±4% and 500,000±4% cells/mL with 2, 3 and 4.5 mg/L of Cl2 at pH 8, respectively) and natural MIR water (50,000±5% cells/mL with 2, 5 and 10
mg/L of Cl2 at both pH 7 and 8.5); (2) using the Missisquoi Bay (MB) bloom water samples
(approximately 5.7×10⁵ (±4%) cells/mL with 2 and 5 mg/L of Cl2 at ambient pH 7.8, pH
augmented to 8.1 and 8.3 after chlorination with 2 and 5 mg/L Cl2 respectively, and remained
constant for the rest of the experiment) (Figure 3-1). Standard deviation of these cell enumerations (triplicate enumeration/sample) fit within the confidence limit of cell count method (Hurst, 2007; Laslett, Clark, & Jones, 1997; Lund, et al., 1958). Figure 3-1 presents the results of chlorine demand by time in these experiments. Chlorine demand in ultrapure water is obviously related to the M. aeruginosa cell numbers and the chlorine dose (Figure 3-1a). For the experiments with the same concentration of the M. aeruginosa cells in MIR water, chlorine demand in the absence of cells is lower than in the presence of cells with similar trends for both pH 7 and 8.5 (Figures 1b & 1c). In the MB bloom water samples at ambient pH, chlorine demand is directly related to the chlorine dose (Figure 3-1d). With the low chlorine dose of 2 mg/L, the MIR water (with and without the M. aeruginosa cells) consumed all chlorine after 30 minutes for both pH values (Figures 1b & 1c); the same result was observed in MB bloom water samples after 60 minutes (Figure 3-1d).
Figure 3-1: Chlorine demand of M. aeruginosa suspensions in (a) ultrapure water with 60,000, 250,000 and 500,000 cells/mL under 2, 3 and 4.5 mg/L Cl2 respectively at pH 8, and 50,000
cell/mL in MIR water under 2, 5 and 10 mg/L Cl2 (b) at pH 7, (c) pH 8.5, and (d) chlorine
demand in Missisquoi Bay (MB) bloom water samples with 5.7×10⁵ (±4%) cells/mL at ambient pH (pH ambient before chlorination was 7.8; pH augmented to 8.1 and 8.3 after chlorination with 2 and 5 mg/L Cl2 respectively, and remained constant for the rest of the experiment)
0.0 0.5 1.0 1.5 2.0 2.5 0 20 40 60 80 C h lo ri n e D e m a n d ( m g /L ) Time(min) 2mg/L-50 000cells/mL 3mg/L-250 000cells/mL 4.5mg/L-500 000cells/mL 0 1 2 3 4 5 0 20 40 60 C h lo ri n e D e m a n d ( m g /L ) Time (min) 2mg/L 2mg/L without cells 5mg/L 5mg/L without cells 10mg/L 10mg/L without cells 0 1 2 3 4 5 0 20 40 60 C h lo ri n e D e m a n d ( m g /L ) Time (min) 2mg/L 2mg/L without cells 5mg/L 5mg/L without cells 10mg/L 10mg/L without cells