Any correspondence concerning this service should be sent
to the repository administrator:
[email protected]
This is an author’s version published in:
http://oatao.univ-toulouse.fr/26643
To cite this version: Rochet, C
hristine and Veron, Muriel and
Rauch, E
dgar.F. and Lowe, Terry C. and Arfaei, Babak and
Laurino, A
drian and Harouard, Jean-Paul and Blanc, Christine
Influence of equal-channel angular pressing on the
microstructure and corrosion behaviour of a 6xxx aluminium
alloy for automotive conductors. (2020) Corrosion Science, 166.
108453. ISSN 0010938X
Official URL
DOI :
https://doi.org/10.1016/J.CORSCI.2020.108453
Open Archive Toulouse Archive Ouverte
OATAO is an open access repository that collects the work of Toulouse
researchers and makes it freely available over the web where possible
Influence of equal-channel angular pressing on the microstructure and
corrosion behaviour of a 6xxx aluminium alloy for automotive conductors
C. Rochet
a,
h,
M. Veron
c, E.F. Rauch
c, T.C. Lowe
d, B. Arfaei
e, A. Laurino
h,
J.P. Harouard\
C. Blanc
a'
*
a CIRIMAT, Université de Toulouse, CNRS, INPT-ENSIACET, 4 allée Emile Manso, CS 44362, 31030, Toulouse cedex 04, France b LEONI WIRING SYSTEMS FRANCE, 5 Avenue de Newton, 78180, Montigny-le-Bretvnneux, France
c Université Grenoble Alpes, CNRS, Grenoble INP, SIMAP, 38000, Grenoble, France
ct Colorado School of Mines, Dept. of Metalhugi.cal. œui. Materials Engineering, Gal.den, CO, 80401, USA "Ford Motor Company, Research and Advanced Engineering, Palo Alto, GA, 95134, USA
AB STR A CT Keywords: A. Aluminium A. Intermetallics B. SEM B. TEM C. Pitting corrosion C. Interfaces
An Al-Mg-Si aluminium alloy was shaped by using a two-pass equal-channel angular pressing (ECAP) process. This led to fragmentation of the coarse Fe-rich intermetallics (IMCs), a decrease in grain size and an increase in the high angle grain boundary (HAGB) density, with overconcentration of HAGBs around the IMCs. Corrosion tests in NaCl solution showed that, before and after ECAP, only pitting corrosion occurred. However, for ECAP samples, pits were more numerous due to the fragmentation of the IMCs; they were also larger and less deep, their propagation being strongly influenced by the presence of very small grains around the IMCs.
1. Introduction
The automotive industry is facing increasing ecological and eco nomical challenges. Reducing greenhouse gas emissions and fossil fuel dependence has become a priority for car manufacturers. In this con text, new materials are to be used in order to reduce both weight and cost of automotive components. Wires are currently made of copper and represent almost 50 kg of the full vehicles mass. The replacement of copper with aluminium alloys could enable car manufacturers to reduce the cost and the specific mass of the wires by 50 %.
However, the use of aluminium alloys for wires leads to new tech nological constraints emerging from the complexity of the automotive environment. Indeed, the combination of aggressive media (de-king road sait, coolant, and windshield washer fluid), varying temperatures and vibrations induces different types of wiring harness corrosion da mage.
For these reasons, automotive wires require a combination of high mechanical strength, high conductivity and high corrosion resistance. Al-Mg-Si alloys match these requirements and are already used for automotive wiring applications [1,2]. The conventional forming pro cess of aluminium wires consists in altemated steps of deformation (drawing) and thermal treatments. Unfortunately, aluminium alloys are Jess conductive than copper, and aluminium wires require larger
sections to carry the same amperage as copper wires. Severe plastic defonnation (SPD) is a potential route to bypass these limitations.
Indeed, SPD processes were developed years ago as a viable way to improve mechanical and fonning properties of metallic alloys through grain refinement [3]. Among those, Equal-Channel Angular Pressing (ECAP) is now a very common process to obtain Ultra-Fine Grain (UFG) microstructures with highly enhanced mechanical properties [ 4-10]. ECAP consists of pressing a bar through a die with a given angle. It applies high strain by shear defonnation without any change in cross section of the material [11]. Many studies focus on the influence of SPD (and ECAP) on the microstructure of aluminium alloys (AA), e.g. Al-Mg Si alloys [ 4,12-14]. Khelfa et al. observed a 97 % decrease in the grain size after only one ECAP pass in AA 6060 T6 [15]. Sitdikov et al. showed the evolution of the texture during ECAP processing in Al-Mg Sc alloy [16]. It is now clear that SPD strongly modifies basic micro structural parameters such as grain size and morphology, texture and the nature of boundaries. Furthermore, intennetallic coarse particles (IMCs) can also be affected by SPD processes shown to be effective in reducing, by fragmentation, the !MC size [17]. Finally, another inter esting feature of ECAP is the possibility to combine high strain and heat treatments to enhance precipitation kinetics in order to maximise me chanical and electrical properties of Al-Mg-Si alloys. For example, Murashkin et al. managed to obtain B' hardening precipitates during
• Corresponding author at: CIRIMAT, Université de Toulouse, CNRS, INP-ENSIACET, 4 allée EmileMonso -BP 44362, 31030, Toulouse cedex 4, France. E-mail aMress: [email protected] (C. Blanc).
C. Rochet, et al.
ECAP at 130 °C in M 6101 [4]. They noticed an increase in both me
chanical strength and electrical conductivity of the samples compared to conventional thermo-mechanical treatrnents of Al-Mg-Si alloys.
These microstructural changes could have a strong influence on the corrosion behaviour of aluminium alloys processed by SPD, and by ECAP in particular. Indeed, it is well known that the corrosion beha viour of aluminium alloys is strongly related to the precipitates present in the material. The role of intergranular B-Mg2Si precipitates possibly formed during aging of Al-Mg-Si alloys has been studied in the litera ture [18-23]. These precipitates are associated with intergranular corrosion, due to their differences in reactivity as compared to the surrounding matrix and/or the precipitate free zone. However, many studies have also shown that Fe-rich intermetallic coarse (!MC) parti des formed during the alloy solidification play a key role in the cor rosion mechanisms of Fe-containing aluminium alloys by acting as cathodes with respect to the surrounding matrix and therefore as pit initiation sites [23--25]. Considering now the influence of ECAP on the corrosion behaviour, different srudies have shown an increase in the corrosion rate after ECAP associated with the activity of intermetallic particles affected by shear deformation [12,26]. The severity of corro sion for samples after SPD processes could be related to the multi plication of pit initiation sites only due to !MC fragmentation, sug gesting an influence of ECAP on pit initiation. But, it could be also explained by considering more complicated effects, e.g. local de formation of the matrix around the IMCs. Furthermore, many studies have also shown a relationship between grain size and corrosion be haviour; Ralston et al. proposed a review of the pertinent literature combined with their own work to analyse this relationship [27]. They showed that two cases have to be considered to understand the effect of the grain size on the corrosion rate: the first one corresponds to mate rials that exhibit active corrosion, whereas the second case corresponds to materials with low to passive-dissolution rates. Such a differentiation should help explain the controversy that exists when dealing with the influence of ECAP on the corrosion behaviour of aluminium alloys, ECAP being found to both increase and decrease the corrosion rate [12,26-31]. Moreover, the complexity of establishing a relationship between the corrosion behaviour and the grain size could also be ex plained by considering the diversity of the interfaces, i.e. their level of misorientation. For example, the susceptibility to intergranular corro sion of aluminium in HCI was found to be strongly related to the grain boundary misorientation distribution [32]. In any event, these features of the microstructure are to be linked to the corrosion propagation, suggesting that ECAP should influence the corrosion in-depth propa gation.
Therefore, it remains of great interest to evaluate the extent to which ECAP can improve mechanical and electrical properties of Al Mg-Si alloys without decreasing their corrosion resistance. Therefore, the present study aims to analyse the influence of two ECAP-based forming processes on the microstructure and the corrosion behaviour of an Al-Mg-Si aluminium alloy. To do so, the critical microstructural parameters modified by ECAP were studied. Close attention was paid to the size and distribution of IMCs along with the presence of j3-Mg2Si type intragranular and intergranular precipitates before and after ECAP. The grains structure, the texture and the nature of boundaries were also considered as key parameters in this study. Such an approach was enabled by performing scanning and transmission electron micro scopy and electron backscatter diffraction. The relationship between these microstructural changes and the corrosion susceptibility of the alloy was then investigated by analysing the corrosion damage for samples before and after ECAP process. Corrosion tests were performed in an aggressive medium, i.e. a chloride-containing environment, and under polarisation for a fixed current density, so that corrosion pro pagation was the main focus of this study, although corrosion initiation was also important.
2. Material and methods 2.1. Materials
The material studied was an Al-Mg-Si aluminium alloy provided as extruded rods (9.5 mm in diameter) with the following chemical com position (wt. %, Al balance): Mg 0.57, Si 0.37, Fe 0.10, Mn 0.04, Cu 0.01, others 0.10. The as-received condition was considered as the re ference state in the following.
The as-received samples underwent two different ECAP processes referred as ECAP-RR and ECAP-RH. ECAP was performed using an ECAP-Conform machine with a 120° die angle [33].
1 ECAP-RR consisted of two passes at room temperature with a dis placement rate of 2.04 mm/s (e = 1.14) and a rotation of 90° be
tween passes [34 J.
2 ECAP-RH consisted of one pass at room temperature and one pass at 135-155 °C with the same displacement rate for both passes of
2.04mm/s (e = 1.14) and a rotation of 90° between passes.
Two types of samples were studied: transverse and longitudinal sections referred as TS and LS. Ail samples were ground with SiC abrasive paper 1200 and 2400 and then polished with diamond paste down to ¼ µm. Severa! steps of ultrasonic cleaning using demineralised water were added. As said in the introduction, it should be pointed out here that the influence of ECAP on the corrosion behaviour of the alloy is studied in this work considering the corrosion propagation that oc curs in the body of a rod. The presence of an altered surface layer, linked to the forming process or the polishing step during sample pre paration, could modify the corrosion initiation through the surface developed on a wire strand, but this is not the focus of this study.
2.2. Experimental methods and techniques 2.2.1. Analysis of the microstructure
An optical microscope (OM, MA200 Nikon) was used to characterise the global distribution and morphology of IMCs. Before observations, samples were ground using SiC abrasive paper down to 2400, then polished with diamond paste down to 0.25 µm and finally using col loidal silica (OPS) for 30 s. A Scanning Electron Microscope (SEM, Quanta 450 by FEI) combined with Energy Dispersive X-ray Spectroscopy (EDS Bruker) was also used in order to determine the chemical composition, the surface density and the size distribution of IMCs. For the surface area covered by the IMCs, an image processing using ImageJ software was applied on SEM images obtained using backscattered electrons. For each sample, a cumulated average of the fraction of surface area was calculated each time a new image was post processed until a stabilisation of the average was observed, which was obtained after the analyses of about 25-30 images, depending on the sample. Analysis of the crystallographic structure of the dispersoids and IMCs was performed using Transmission Electron Microscopy (TEM) with a Field-Emission Gun operating at 200 kV (FEG-TEM, JEOL JEM 2100 F, Raimond Castaing Microanalysis Center, Toulouse, France). TEM was also useful to analyse the nature and distribution of fine in tragranular and intergranular precipitates. For these last observations, samples were ground with SiC abrasive paper 1200, 2400 and 4000 down to 80 µm, eut in dises of 3 mm diameter and electropolished at -15 °C in TenuPol-5 with 900 mL of CH3OH and 300 mL of HNO3•
Electron Back-Scatter Diffraction (EBSD) analyses were also per formed for ail samples in order to determine the grain size, the global texture and the nature of boundaries. For this analysis, samples were prepared as detailed above with the addition of a 90 s polishing step with colloidal silica. EBSD patterns were collected using an Oxford Instruments HKL EBSD System (Nordlys NanoEBSD detector) and then analysed using ATEX software [35]. The EBSD detector was mounted on a JEOL JSM 7100 F SEM with a Field-Emission Gun operating at 20 kV.
EBSD data were also post-processed using the conunercial software package Oxford Channel 5. Post-processing was performed according to ASTM Standard E2627. Large fields of view of 450 x 600 µm were studied using a 0.5 µm step to characterise the global texture of the samples. Small fields of view of 120 X 90 µm were also analysed with a 0.07 µm step size in order to obtain more accurate data for grain size and interface densities. Grains boundaries and sub-grain boundaries were defined as a local interface possessing a misorientation larger than 2°. High Angle Grain Boundaries (HAGBs) and Low Angle Grain
Boundaries (lAGBs) were distinguished as having a misorientation larger than 10°, or between 2 and 10°, respectively. Only grains larger
than 200 nm were taken into account.
Finally, an analysis of the grain structure and the local deformations surrounding IMCs was performed for ail samples using Automated Crystallographic Orientation Mapping (ACOM) in SiMaP (Grenoble) [36]. The analysis was performed in a Transmission Electron Micro scope with a Field-Emission Gun operating at 200 kV (FEG-TEM, JEOL JEM 2100 F). Each map was acquired using a 20 nm step size and a precession angle of 1.2°. The samples used were identical to those
which were used for TEM analysis. As for EBSD analysis, a 10° mis
orientation criteria was used to classify the boundaries, i.e. HAGBs and lAGBs.
2.2.2. Mechanical testing
To better understand the influence of ECAP on the microstructure of the alloy, micro-hardness measurements were performed using a Vickers micro-hardness indenter (Omnimet 2100 by BUEHLER) with a 100 g Joad. ISO Standard 6507 was followed to perform these tests. Measurements were performed side to side for each sample. The gap g between each indent was chosen in agreement with the following cri teria (g > 2.5d) where d was the diameter of an indent (around 70 µm).
Furthermore, tensile tests were performed using an MTS testing ma chine equipped with a 5 kN Joad cell. Cylindrical tensile samples, with a gauge length of 24 mm and a 4 nun diameter, were used. Tests were ail performed at a constant strain rate of 10-3 s·' using a 20 mm ex tensometer in order to record sample deformation during testing. For reproducibility, at least three tensile samples were tested for each condition.
2.2.3. Characterisation of the corrosion behaviour
The corrosion behaviour of the alloy was first studied by plotting polarisation curves using a three-electrode cell with a platinum and a saturated calomel electrode acting as counter and reference electrodes, respectively. Ail electrochemical measurements were performed by using a VSP-128 Biologie Potentiostat. Chloride-containing solutions are the reference electrolyte used for industrial tests; they are the most representative of the automotive environment, e.g. de-king salts. Clearly, other pollutants can be found but it was not the aim of this paper to study the influence of these chemical species. Therefore, ail corrosion experiments were performed in a quite aggressive electrolyte, i.e. a 0.5 M NaCI solution. Potentiodynamic polarisation curves were plotted after 60 min at the open-circuit potential (OCP) in NaCI solu tion. Cathodic and anodic parts were acquired separately, from OCP
+ 5 m V and OCP - 5 m V for cathodic and anodic parts, respectively. The potential sweep rate was 250 m V h -1• Each measurement described below was reproduced at least 5 times to ensure the reproducibility of results.
Then, the corrosion morphology obtained after the polarisation tests was analysed using OM (MA200 Nikon) and SEM (Quanta 450 by FEI). An accurate analysis of the pit propagation was also performed by using a confocal microscope (Sensofar S Neox): in that case, samples were maintained at OCP for 5 min and then polarised under a fixed current density (100 µA cm-2, 1 mA cm-2 and 7 mA cm-2) for 10 min in order to compare the corrosion propagation for a similar charge passed for the different microstructures. It could be noted here that those tests under polarisation could be considered as representative of the
in-service conditions considering the current flow seen by the cables. The pit density, average pit depth and the corroded surface ratio were de termined using a confocal microscope along with Gwyddion analysis software. A quantitative analysis was performed on two different samples for each condition. Approximately 900 pits were analysed for each condition.
In the end, in order to investigate the influence of local deformation of the matrix surrounding IMCs in corrosion propagation mechanisms, a Transmission Kikuchi Diffraction (TKD) analysis was performed for the longitudinal section of the as-received condition only. The samples were TEM slices obtained with the preparation method used for TEM analysis. TKD analysis consisted in the acquisition of small scale or ientation maps (12 µm x 6 µm) with a step size of 40 nm. Observations of a selected zone were performed before inunersion, after a 12 -h im mersion in 3 M NaCI and after a 24 -h inunersion in 3 M NaCI. Post processing of the images was performed using the same method as described in 2.2.1.
3. Results and discussion
3.1. Influence of ECAP on the microstrucrure of the Al-Mg-Si alloy 3.1.1. Grain morphology and narure of the boundaries
The orientation maps obtained for the transverse and longitudinal sections of as-received, ECAP-RR and ECAP-RH samples are given in
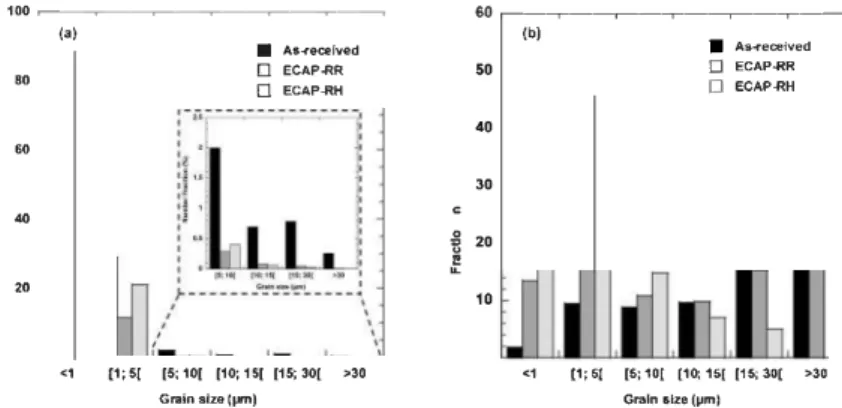
Fig. 1. ln these maps, the colour code refers to the crystallographic orientation of each grain along the extrusion direction (Z and X for the transverse and the longitudinal sections, respectively). Firstly, for ail samples, grains were strongly elongated along the forming direction, due to the extrusion process, with the formation and arrangement of dislocations into dislocation walls aligned along the forming direction, i.e. in the longitudinal section [37,38]. This may introduce difficulties in analysing the grain structure. Thus, only transverse sections will be discussed in the following. Fig. 1 shows that grain refinement occurred during ECAP-RR and ECAP-RH processes. Based on observations of the orientation maps (Figs. ld, e, g and h), the grain size was smaller for ECAP-RR compared to ECAP-RH. Additionally, Fig. 2a shows that the proportion of grains (calculated considering the number of grains) with an average diameter under 1 µm was increased by 31 % and 17 % for ECAP-RR and ECAP-RH, respectively, compared to the as received sample. On the contrary, the proportion of grains with an average diameter comprised between 5 and 10 µm was decreased by 85 % and 80 % for ECAP-RR and ECAP-RH samples, respectively. Overall, these first observations suggested a more efficient refining process during ECAP-RR when compared to ECAP-RH. However, both as-received and ECAP-RR samples showed a heterogeneous grain structure in compar ison with ECAP-RH samples, for whiclt more than 50 % of the surface was occupied by grains ranging from 1 to 5 µm in diameter (Fig. 2b). The complexity of the microstructures was clearly seen in Figs. 1f and i that correspond to band contrast images with identification of the grain boundaries for ECAR-RR and ECAP-RH samples, respectively. For ECAP-RR sample, small grains were observed, but also some larger grains, whereas, for ECAP-RH sample, the microstructure was more homogeneous with large surface areas covered by very small grains. Therefore, it appeared that the determination of the grain size for such heterogeneous structures could not be limited to the calculation of average grain size taking into account the number of grains with a given diameter. The surface occupied by large and small grains had to be taken into account in order to give an accurate estimation of the average grain size. Following this method, area weighted average grain size was calculated for ail the samples; it decreased from 24 µm for the as-received sample to 16 µm for the ECAP-RR sample and finally 4 µm
for the ECAP-RH sample, which showed a higher refinement efficiency for the ECAP-RH process. Assuming that these last values were the re levant ones, the alternative conclusions about grain size based on qualitative interpretation of Fig. ld, e, g and h could be explained by
C. Rochet, et al.
■
ii
-
•
i••
••
-
-
·�·:
.,.
�
�-' . -.
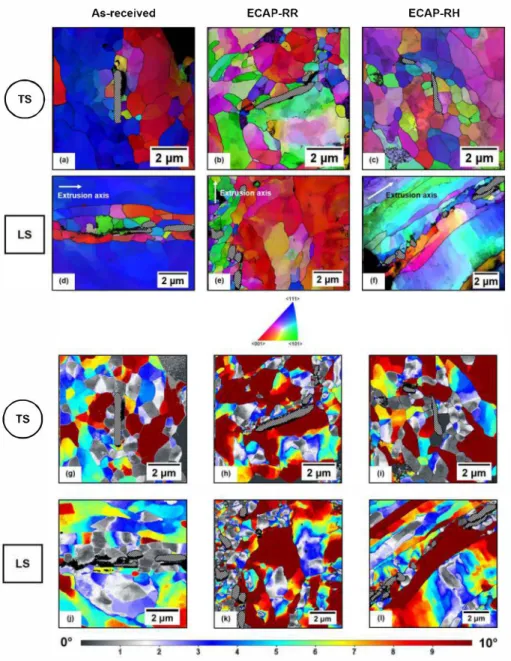
Grain size = 24 µm Grain size = 16 µm Grain size = 4 µmFig. 1. Orientation maps (parallel to the forming axis) of the as-received (a, b), ECAP-RR (d, e) and ECAP-RH (g, h) samples. Figs. a, d and g show the transverse sections and Figs. b, e and h are for longitudinal sections. Figs. c, f and i represent band contrast images with grain boundaries drawn in black for as-received, ECAP RR and ECAP-RH samples respectively (area weighted grain size is reported below each image).
the colour code used to identify crystallographic orientations and not grain boundaries. Comparison of our results to the literature high lighted the importance of the methodology used to calculate the average grain size. Indeed, in agreement with our results, many srudies
l
C!
100 �-�--�-�--�-�-� (a) BO 60 40 20 <1■
As--<ecetved [] ECAP-RR 0 ECAP--RH (1;5[ (5; 10[ (10; 15[ (15; 30[ >30 Grain sizo (µm)showed a grain refinement during SPD that resulted from both dynamic recovery and continuous dynamic recrystallisation (CDRX) [39-42].
CDRX generally happened during high temperature deformation; during low temperature ECAP, grain refinement was only attributed to
C
�
�
60 �-�--�-�-��-�-� (b) 50 40 30 20 10 <1■
As..-ecelved□
ECAP-RR□
ECAP-RH (1; 5( [S; 10( (10, 15( (15; 30( >30 Grain slz:e (µm)Fig. 2. Grain size distribution of as-received, ECAP-RR and ECAP-RH samples (a) number fraction and (b) area fraction. Analyses were performed for the transverse sections (TS).
5.0
100
■
□
LAGBsHAGBs
■
Ali boundarle& L.AGBs,,.
(b)0
..•
80�
�
�
3.0 'li .!!�
60 64.6 (a)f
_g 'C 47.1 2.0�
◄OJ
'-:J HAGBs U7 U◄ 1,9',�.I
-1.n,
...
n
1.17,_
20 1.0 D.Dl
·
·
·
1
1
1As-reoeived ECAP-RR ECAP-RH As-received ECAP-RR ECAP-RH
Fig. 3. (a) Relative fraction of HAGBs and LAGBs; (b) total length of al! boundaries, HAGBs and LAGBs. Analyses were performed for the as-received, ECAP-RR and ECAP-RH samples for the transverse sections (TS). The values were calculated for analysed zones of 120 x 90 µm2•
the subdivision of coarser grains and the distortion of smaller ones [43,44]. Previous reports have shown that a higher processing tem perature leads to larger grains when compared to low temperature deformation [45-49]. For example, Goloborodko et al. processed sam ples up to strains of 12 % at temperatures ranging from 250 "C to 400 "C and showed an increase in the grain size associated with increasing processing temperature [ 47]. The apparent discrepancy with our results could be explained considering first the methodology used to calculate the average grain size. Moreover, it shotùd also be pointed out that both strain and temperature used in Goloborodko's work were higher !han those used in our ECAP processes; therefore, the recrystallisation pro cess could have been combined with a coarsening of the recrystallised grains for the highest temperatures. More generally, it should be no ticed that, in the present study, the effect of ECAP on the grain size was very low when compared to the results of the literature [4]. This might be due to the initially fine grain structure of the as-received sample.
Fig. 3a shows the relative fraction of HAGBs and LAGBs for each sample. Due to the high elongation of grains in the longitudinal section, it was difficult to determine the density ofboundaries for these sections. Therefore, only restùts for the transverse sections are discussed. Results showed that the relative fraction of HAGBs was increased by 80 % and 147 % for ECAP-RR and ECAP-RH samples, respectively. Those results were consistent with previous conclusions, i.e. a decrease in the grain size with ECAP and a smaller average grain size for ECAP-RH samples. Indeed, as stated in the literature, grain refinement during ECAP was commonly linked to the formation of HAGBs due to recrystallisation processes [15,28,45]. To confirm these restùts and avoid the problems due to the identification of grains, the total length of boundaries was calculated for each sample (Fig. 3b). An increase in the total length of boundaries was observed after ECAP, in particular after ECAP-RH. Furthermore, for ECAP-RR and ECAP-RH samples, the length of both HABGs and LAGBs increased compared to the as-received sample, with a very strong increase in the total length of HAGBs for ECAP-RH sample. Those restùts clearly showed that the increase of processing temperature during ECAP-RH enabled a homogeneous recrystallisation phenomenon leading to small recrystallised grains; the temperature was not high enough to lead to a coarsening of the recrystallised grains. After ECAP-RR, because of the lower temperature during the de formation process, a more heterogeneous microstructure was obtained due to an incomplete recrystallisation process; it combined large and small grains, the smallest ones being formed either by a recrystallisation process or by the subdivision of larger grains during deformation. 3.1.2. Texture analysis
Pole figures obtained for the transverse and longitudinal planes of the as-received ECAP-RR and ECAP-RH samples are shown in Fig. 4. These demonstrate, in agreement with Fig. 1, a strong effect of ECAP
processes on the global texture of the alloy. The as-received sample exhibited two fiber texture components parallel to the extrusion axis, which are typical for this type of forming process [50-52]. The major component was the < 111 > direction and the minor one was the < 100 > direction, which is the typical case for high stacking fatùt energy fcc materials such as aluminium [53,54]. After ECAP-RR, a strong change in the texture was observed, characterised by a randomisation of the texture of the alloy highlighted by a "blurring" of the pole figures and a decrease in the maximum texture intensity from 15 times-random for the as-received sample to 4 times-random for the ECAP-RR sample. On the contrary, the ECAP-RH sample exhibited a texture which was quite similar to the as-received sample. Besides, the maximum texture intensity was higher for the ECAP-RH sample !han for the ECAP-RR sample. Texture development during ECAP is strongly dependent on the processing parameters such as the die angle and the number of passes. Therefore, it becomes very difficult to predict and interpret the changes in texture after several passes [55]. However, some authors have ob served a texture weakening after the first passes of deformation [14,55,56]. Ciemiorek et al. noticed a texture randomisation during incremental ECAP for an aluminium alloy [14]. According to this study, this was related to the activation of shearing planes and the rotation of grains due to high deformation. In the present study, the major direc tion for the ECAP-RR sample was < 110 > , which is typical for a simple shear [14,16,57]. The texture observed for the ECAP-RH sample could be explained considering a more efficient CDRX process in the final stage of deformation, which restùted in grain orientations doser to what we can expect from the extrusion process. This was consistent with the conclusions drawn from the grain structure analysis. Fur thermore, the heterogeneity of the texture distribution for ECAP-RR sample could contribute to explain the deceptive appearance of small grain size (Fig. ld) discussed above. To conclude here, the results showed that the second pass in the ECAP process had a major influence on texture modifications, and more globally on microstructural changes.
3.1.3. Influence of ECAP on the precipitaJion states
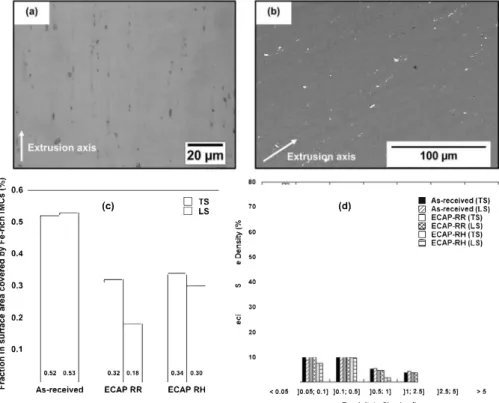
Firstly, attention was paid to the influence of ECAP on the dis tribution and size of IMCs, considering, as explained in the introduc tion, that IMCs are preferential pit initiation sites for Al-Mg-Si alloys. OM and SEM observations showed IMCs of different sizes in ail samples: they were aligned along the extrusion axis due to the forming process of the rods (Fig. Sa and Sb) [24]. Most of !hem were identified as Fe-rich IMCs using EDS analyses. Additional observations by TEM (Fig. 6a) allowed typical IMCs to be observed; EDX analyses confirmed that most of the IMCs contained Al, Fe, Mg and Si in various amounts. Moreover, the diffraction pattern of an Al-Fe-Si !MC, shown in Fig. 6a, corre sponded to the Al9Fe2Si2 compound characterised by an orthorhombic
C. Rochet, et al. "O
..
>-�
u xo 2.
6 8 10Fig. 4. Pole figures of as-received, ECAP-RR and ECAP-RH samples for the transverse and longitudinal sections. crystal structure (a= b =0.615nm, c =2.0Bnm) [24]. It should be
pointed out that many other phases have been identified in the litera ture in 6xxx aluminium alloys [2,58,59]. In the present work, whereas most of the IMCs were identified as Al9Fe2Si2 compounds, some very
rare IMCs were found to be of the Al-Mg-Si type, which have already
� 0.6 U) ü � � 0.5 ;, u. � 0.4 "O �
..
> 8 0.3..
�..
1l 0.2 � :, U) .!: 0.1 r:: 0 � (!? u. --0.62 0.53 As-received (c)-,_
0.32 0.18 ECAP RR□
TS□
LSê
i':'ê
�..
-
-"'
·2
0.34 0.30 ECAP RH 70 60 50 40 30 20 10been observed in the literature for this type of alloy [60]. However, attention was paid to Fe-rich IMCs only. Observations showed that the structure and the global morphology of IMCs were identical after ECAP RR and ECAP-RH. The fraction of surface area covered by Fe-rich IMCs was then calculated; for each sample, a similar image processing was
(d) ■ As-recelved (TS) � As-received (LS) 0 ECAP-RR (TS) i8l ECAP-RR (LS) 0 ECAP-RH (TS) E;I ECAP-RH (LS) < 0.05 ]0.05; 0.1] ]0.1; 0.5] ]0.5; 1] ]1; 2.5] ]2.5; 5] >O Preclpltate Slze (pm')
Fig. 5. (a) and (b) SEM observations of the longitudinal section ofECAP-RR and ECAP-RH samples, respectively. The arrows show the extrusion axis. (c) Fraction in surface area covered by IMCs and (d) IMCs size distribution for the as-received, ECAP-RR and ECAP-RH samples.
Fig. 6. TEM observation of (a) an Al-Fe-Si IMC on the surface of an as-received sample (the corresponding diffraction pattern is also reported), (b) the grain structure in ECAP-RH condition and (c) dislocation arrays in an ECAP-RH sample.
m in
2
1-300 R =253MPa --As-received 250 , ':! - - ECAP-RR J - - - · · · · -ECAP-RHr
= 238MPa 200 150 100 50 0 (a) -50 0 5 10 15 True Strain (%) (b) R,o_, (MPa) Rm (MPa) A._(MPa) As-received 175 218 13.9 ECAP-RR 243 253 11.4 ECAP-RH 222 238 13.2Fig. 7. (a) True stress-strain curves and (b) main mechanical parameters ex tracted from curves shown in (a).
performed by considering different values of the threshold fixed to identify a Fe-rich !MC. Three sets of analyses were performed: the fraction of surface area covered by Fe-rich IMCs was therefore calcu lated by considering only IMCs with a minimum surface area of 0.001 µm2, 0.005 µm2, and 0.01 µm2• Results showed that there were
not significant differences between the different sets of analyses, and that a threshold equal to 0.01 µm2 was a good compromise. Fig. 5c
shows a decrease in the surface area covered by IMCs after ECAP-RR and ECAP-RH. Additionally, Fig. 5d shows that the distribution of the IMCs size was affected by ECAP, in particular for the ECAP-RH process, which led to a higher proportion of small IMCs. This result could be explained by considering the breakdown of IMCs during ECAP. This has already been reported in the literature and explained by the high shearing stress applied to IMCs during ECAP [12,61]. Clearly, the de crease in size of the IMCs could also explain the decrease in the fraction of surface area covered by the IMCs (Fig. 5c), the smallest IMCs being not taken into account in the calculation. Results also showed that the same surface area covered by the IMCs was measured for both ECAP-RR and RH samples (Fig. 5c), whereas only the size distribution plotted for the ECAP-RH sample was modified compared to the as-received sample.
Accordingly, the results described above showed that the ECAP processes had an influence on the size and distribution of IMCs which could modify the pitting corrosion behaviour of the alloy by multi plying the potential pit initiation sites. However, it is also true that J3-Mg2Si type intergranular and intragranular (hardening) precipitates can play a key role concerning the corrosion behaviour of Al-Mg-Si alloys. Thus, TEM observations were then focused on these types of pre cipitates. Those observations did not reveal any intragranular or in tergranular precipitation (Fig. 6b). This result seemed relevant for the as-received and ECAP-RR samples, whereas those precipitates could have been expected for the ECAP-RH sample for which the deformation at 150 'C was expected to lead to the formation of j3"/j3' strengthening precipitates. Two hypotheses could thus be proposed:
- The as-received sample was not in a solution-treated state. This was strongly suggested by the fine and highly deformed microstructure observed. It is well known that static or dynamic precipitation hardening is linked to the supersaturation in alloying elements and high vacancy concentration resulting from quenching of the solution heat treated state, those vacancies serving as nucleation sites for GP zones [62]. In the present work, it was very unlikely that the as received sample was supersaturated preventing any precipitation hardening (static or dynamic).
- Another reason could be that the ECAP-RH conditions did not pro mote precipitation strengthening. Indeed, Hirosawa et al. showed that the temperature during ECAP is of major importance due to the large amount of dislocations and grain boundaries in highly de formed state which act as heterogeneous nucleation sites for stable phases and reduce the precipitation of strengthening phases. This phenomenon is called competitive precipitation [63]. One could easily assume that such phenomenon could also occur during ECAP RH. TEM observations showed large dislocation arrays for ECAP samples (Fig. 6c). These features were most likely introduced by the high amount of deformation induced during ECAP [5,9,12,38]. 3.2. Influence of ECAP on the mechanical properties of the Al-Mg-Si alloy
For ail samples, results of Vickers micro-hardness measurements were quite similar in both transverse and longitudinal sections. For the as-received sample, the average micro-hardness value was around 62 ± 3 HV, which was consistent with previous studies on aluminium alloys with similar forming conditions [2,64]. After the ECAP-RR and ECAP-RH processes, the average micro-hardness was increased to 85 ± 3 HV and 78 ± 3 HV, respectively, highlighting the strength ening effect of ECAP. According to Hall-Petch's Law, higher micro hardness values could be expected for the ECAP-RH sample, con sidering the fraction of surface area covered with small grains (Fig. 2) [13,65]. However, some authors have criticised the validity of Hall Petch's Law for ultra-fine grained microstructures [66,67]. In addition,
C. Rochet, et al. 10' 10' 10' 10• 10' 10' 10' 10• --As-receivecl - -ECAP-RR •••·•ECAP-RH
-
--
-
-
�
-
'
--0.84 --0.8 --As-received - -ECAP-RR • · •• · ECAP-RH'
' '
-0.76 ':-.-.-.-.-,.,-."':'."'P.-,---·---- ---0.84 --0.8 --0.76(a)
--0.72(c}
·
;,
· 17
'1 : 1 : 1 : 1 --0.72 10' 10' 10' 10' 10•(b)
,-:.,
...
,,
• I • 1 1 1 -0.75(d)
-0.75,:
-
�
-
�
-
-
-
·
,,
.
.,
.
,
-·
t::
··
.,
_
.---,
J.'•, • • ·•· r.
--As-received - -ECAP-RR • · • · · ECAP-RH --0.7 --0.65 --0.6 -0.55 --As-received - -ECAP-RR · •ECAP-RH --0.7 --0.65 -0.6 --0.55Fig. 8. Polarisation curves (250 mV h-1) of as-received, ECAP-RR and ECAP-RH samples in 0.5 M NaCl for (a) and (b) the transverse section and (c) and (d) the longihldinal section. (a) and (c) correspond to the cathodic domain whereas (b) and (d) are for the anodic domain. For each curve, OM observations of ECAP-RR sample at the end of the polarisation are given: the arrow in the OM observation of Fig. d indicates the extrusion axis.
Fig. 9. SEM observation of a Fe-rich !MC after 10 min at OCP in 0.5 M NaCl for the as-received condition.
a higher density of LAGBs was measured for the ECAP-RR sample (Fig. 3a), which could indicate a higher amount of stored deformation inside grains, in agreement with previous conclusions conceming the incomplete recrystallisation process for the ECAP-RR sample compared
to the ECAP-RH sample [45]. Therefore, the increase in processing temperature for ECAP-RH, leading to a complete recrystallisation pro cess, would induce a decrease in the deformation stored in grains (dislocations), and consequently a slight softening of the alloy. This particular effect of high temperature processing during SPD has already been observed in other studies [53,68].
The results of tensile tests (Fig. 7) were in good agreement with micro-hardness measurements, showing an increase in Rpo.2 and Rm
along with a decrease in the ductility for both ECAP-RR and ECAP-RH conditions. Moreover, ECAP-RR showed a lower elongation to fracture, and higher Rpo.2 and Rm values than ECAP-RH in agreement with pre
vious conclusions.
Therefore, results shown in this part showed that ECAP led to a slight improvement of the mechanical properties of the Al-Mg-Si alloy. Corrosion tests were then performed to evaluate the impact of ECAP on the corrosion properties of the alloy.
3.3. Influence of ECAP on the corrosion behaviour of the Al-Mg-Si alloy 3.3.1. Inff.uence of ECAP on the electrochemical response of the Al-Mg-Si alloy
First, polarisation curves were plotted for the as-received, ECAP-RR and ECAP-RH samples after 1 h at OCP in 0.5 M NaCl; they are reported in Fig. 8. The global shape of the curves was very similar for ail samples.
'
f
..
� .,
.,
.,
100 µAcm·2 l•l As-recelved ECAP-RR ECAP-RH,-'-,
r---'---TS··
\:
1y
·
�)
11/1
·,
1!: :
•' !11 1�
:
:�
LS Lsll TS �s TSini-1•
'
'
a.,
�
�
_
,,
1 mAcm-2 lb)As-recelved ECAP-RR ECAP-RH
,--'--,
r---'---·
11l
:· ·
:, ;,/r
11 : 11,A:
v �,1 , 1 1 � 1 1, 11 11 ! ,,( � LS L� LS TS TSmmit
TS 7mAcm·2 20�---� 0'
a1
·
"
.,o -30 l<lAs-recelved ECAP-RR ECAP-RH
�
1 1'r
1 1r···
1 1 I 1 1 1 1 1 • • 1 1 1 \/ : : :l�� I 1/:,!
: 1�
s \1 LS LS TS TSmill
TSFig. 10. 2D profiles obtained by confocal microscopy for pils grown after polarisation during 10 min in 0.5 M NaCl at a fixed current density (a) 100 µA cm-2, (b) 1 mA cm-2 and (c) 7 mA cm-2 for the as-received, ECAP-RR and ECAP-RH samples in both transverse and longitudinal sections. The lateral scale is reported for each
graph.
TS
LS
(a) 2µm (b) Cl>"ëii
Cl> .JOµmh❖•fi41
(c) (d) 2µm 4µm0::
0::
ri.
<I:
u
w
-271.1m -191.JmiuHÜ
(e) (f) Jµm Jµm0::
ri.
<I:
u
w
-241.Jm -161.Jmil❖IÜ
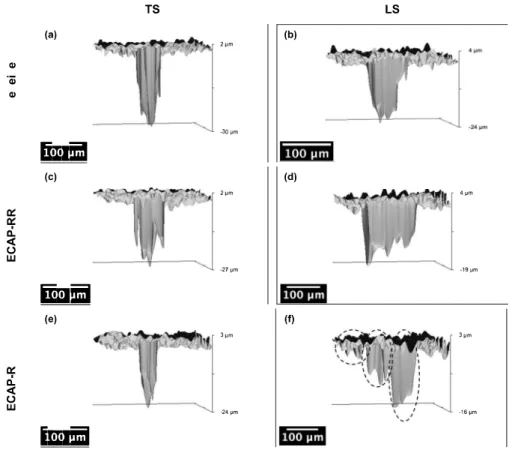
Fig. 11. 3D profiles obtained by confocal microscopy for pits grown after polarisation during lOmin in 0.5 M NaCl at a current density of 7 mA cm-2 for the as received (a, b), ECAP-RR (c, d) and ECAP-RH (e, 0 samples. Figs. a, c and e are for the transverse section and Figs. b, d and f show the longitudinal section. Black
circles in Fig. f highlight coalescing pits. The lateral scale is reported for each graph. Firstly, the cathodic domain (Figs. Ba and c) was characterised by a large current plateau associated with the reduction of dissolved oxygen. Tuen, the anodic domain (Figs. Bb and d) was characterised by a rapid increase in the current density indicating that the alloy was susceptible to localised corrosion at its corrosion potential. Whatever the section (transverse or longitudinal), Ecorr values were quite similar for al! samples and comprised between -0.72 V/SCE and -0.74 V/SCE. Taking into account that the cathodic process was diffusion controlled, the
corrosion current density was considered to be equal to the
diffusion-limited current and estimated from the cathodic current densities re corded on the plateau. Values of 2.2 ± 0.2 (1.4 ± 0.7) 10-3 mA cm·2, 1.5 ± 0.5 (1.5 ± 0.4) 10-3 mA cm·2 and 1.5 ± 0.5 (1.6 ± 0.7) 10-3 mA cm·2 were estimated for the as-received sample, ECAP-RR and ECAP-RH samples, respectively in the transverse (longitudinal) section. Results showed that the standard deviation calculated for each para meter on the basis of at least 5 measurements was quite high when compared to the gap measured between each value. This might be a
C. Rochet, et al.
30
1
As•Recelved (TS)As-recelved (LS)
25 ECAP-RR (TS)
ê
[[Il□
ECAP-RR (LS) ECAP•RH (TS)a
§ ECAP·RH (LS) 20(a)
15 0=
10 100 µA cm" 1 mA cm' 7mAcm' 141
As-recelved (TS) 12■
As-recelved (LS) ECAP•RR (TS)�
ECAP·RR (LS) ECAP-RH (TS) 0 10 § ECAP-RH (LS)�
(b)
..,
4"
2 0 100µA cm-2 1 mA cm-2 7 mA cm-2 110'!
As-recelved (TS) As-recelved (LS) 810' ECAP-RR (TS)"'1::
�
tl;i:lD
ECAP•RR (LS) ECAP-RH (TS)§ ECAP-RH (LS) 6103
(c)
4103 0 2 10' 100 µA cm-2 1 mA cm-2 7mAcm-2Fig. 12. (a) Depth, (b) corroded surface ratio and (c) density of corrosion pits formed for the as-received, ECAP-RR and ECAP-RH samples after polarisation during l0min in 0.5M NaCl at a fixed current density of I00µA cm-2, 1 mA cm-2 and 7mA cm-2•
for the as-received and ECAP-RR conditions, as pointed out in previous paragraphs. Nevertheless, taking into account these high standard de viations for the corrosion parameters, il was concluded that the polar isation curves did not indicate a significant influence of ECAP on the
corrosion behaviour of the Al-Mg-Si alloy.
OM observations of ECAP-RR sample after polarisation tests in the anodic domain showed that the sample surface was covered with large pits elongated along the forming axis (Fig. 8). This was most likely due to the alignment of IMCs (Fig. 5) and the elongation of grains in this particular direction (Fig. 1). Similar observations were done for both the as-received and ECAP-RH samples. No intergranular corrosion was observed, even for the ECAP-RH sample, which was supported and in agreement with the previous TEM observations (Fig. 6) [19,21,69]. Furthermore, OM observations of the samples after immersion at the OCP showed that corrosion pits initiated on the IMCs zone. After only 10 min at the OCP (Fig. 9), SEM observations showed that Fe-rich IMCs acted as cathodes with respect to the matrix, therefore enhancing the preferential dissolution of the latter in NaCI solution. Such a behaviour has been largely reported in the literature and explained referring to differences in composition between IMCs and the surrounding matrix [23,24,70,71]. In that sense, considering only those OM and SEM ob servations, no modification of the corrosion mechanisms at the OCP and after polarisation in the anodic domain was apparent after ECAP by comparison to the as-received sample, which agreed with the literature [28,72]. Nevertheless, as explained in the introduction, the micro structural features described in part 3.1. were to be linked mostly to the propagation of the corrosion. Therefore, a detailed analysis of the pit propagation was then performed.
3. 3.2. Influence of ECAP on the pit propagation in the Al-Mg-Si alloy To study the pit propagation, samples were polarised in the anodic domain at a fixed current density for 10 min in order to have a similar charge passed for ail the samples. Three sets of experiments were per formed corresponding to three current density values, i.e. 100 µA cm -2, 1 mA cm -2 and 7 mA cm -2, in order to analyse the evolution of the pit morphology when they propagated. A confocal microscope was then used to analyse accurately the morphology of the pits grown. Fig. 10 shows representative 2D profiles obtained by confocal microscopy for the as-received, ECAP-RR and ECAP-RH samples, for bath transverse and longitudinal sections, for the three values of current density. First, results clearly showed, as expected, that the higher the current density, the deeper and the larger the pits, whatever the samples. But, the main result concemed the influence of ECAP on the evolution of the pit morphology when the current density increased, i.e. the influence of ECAP on the pit propagation. Indeed, Fig. 1 0a showed that bath the depth and width of the pits were similar for ail samples, and whatever the section, for a low current density, i.e. 100 µA cm-2• However, Fig. 10b and c clearly showed that, when the current density increased, i.e. when the pits propagated, a differentiation in the pit morphology was observed depending on the samples and the sections. The pils formed on ECAP samples seemed to gradually grow slower in depth compared to those formed on the as-received sample, for bath trans verse and longirudinal sections. Moreover, in the longirudinal section, the pils gradually became larger for ECAP samples as compared to the as-received sample. To complete those experimental results, re presentative 3D-profiles of pits grown for a current density of 7 mA cm-2 were plotted for ail samples and both sections (Fig. 11). Com parison of Fig. 11 a, c and e for one part, and Fig. 11 b, d and f for the other part, clearly showed that pits formed on ECAP samples were Jess deep, but larger than those formed on the as-received sample. The difference in width was even more marked for the longitudinal section. Therefore, those first analyses suggested that ECAP strongly im pacted the pit propagation. In order to propose a consolidated de scription of the influence of ECAP on the pit propagation, a statistical analysis was performed: for each condition (i.e., a section and a current density value), two samples were analysed and ail the pits observed on those two samples were analysed by confocal microscopy. Then, average values of the pit depth, corroded surface ratio and pit density were calculated (Fig. 12): each average value was calculated from the analysis of about 900 pits. It should be noted here that the pit width was
statistically analysed by considering the corroded surface ratio: indeed, surface observations (Fig. 8) clearly showed that the pit did not have a round shape so that it was difficult to define properly the pit width. Therefore, another parameter was considered, i.e. the pit density, which corresponded to the number of pits per cm2• The combined analysis of
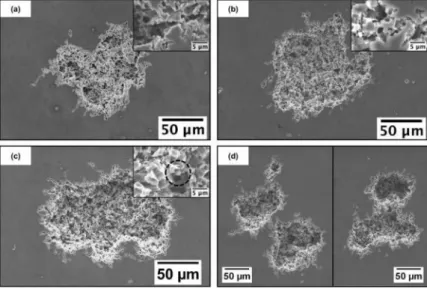
those two parameters, i.e. the corroded surface ratio and the pit density, allowed the pit width to be evaluated, and therefore the global lateral propagation of the pit to be described. Fig. 12a confirmed the first hypothesis based on the analysis of representative 2D and 3D profiles: the pit depth was quite similar for ail samples for small pits, but, when the pits propagated, pits became Jess deep for ECAP samples as com pared to the as-received sample. Fig. 12b showed that the corroded surface ratio became even higher for the ECAP samples as compared to the as-received sample, when the current density increased; this was even more marked for the longitudinal section as compared to the transverse section, as previously observed (Fig. 11). Moreover, Fig. 12c showed that, when the current density increased, the pit density in creased for ail samples, as expected; moreover, the pit densities values were quite similar for ail samples for a low current density (100 µA cm-2), but became higher for ECAP samples as compared to the as received sample when the current density increased. Considering ail the results, i.e. both representative 2D/3D profiles (Figs. 10 and 11) and the statistical analysis of the pit morphology (Fig. 12), it could be con cluded that ECAP promoted a lateral pit propagation, enhancing also the pit propagation in the forming direction. Furthermore, the increase in corroded surface area for ECAP samples could be explained by considering both an increase in pit width (Figs. 10 and 11) and in pit density (Fig. 12c). Concerning the increase in pit density for ECAP samples, as compared to the as-received sample, this could be related to the fragmentation of the Fe-rich IMCs, as shown by Fig. 5. ECAP led to a multiplication of the pit initiation sites due to the fragmentation of the Fe-rich IMCs. When the current density was increased, more Fe-rich IMCs became pit initiation sites for ECAP samples, which participated in the lateral propagation of the corrosion rather than in-depth propa gation. However, it should be noted here that the pit density parameter was rather difficult to estimate due to the pit propagation mechanism itself. Indeed, Fig. 13 shows SEM observations of pits grown on both as received, ECAP-RR and ECAP-RH samples polarised with a current density of7 mA cm-2 for 10 min. Ali samples exhibited large active pits
initiating at Fe-rich IMCs (circle in Fig. 13c), and corrosion filaments were observed ail around the pits indicating pit propagation along grain
Fig. 13. SEM observations of corrosion pits after polarisation during lOmin at 7m.A cm-2 in 0.5 M NaCI for (a) the as-received, (b) ECAP RR and (c) ECAP-RH samples. High magnifi cation images are also reported in the right hand corner of each micrograph . Fig. d shows two examples of coalescing pits formed for an ECAP-RH sample after polarisation during lOmin in O.SM NaCl at 7m.A cm-2•
boundaries that intersected the growing pits in the surrounding matrix of IMCs. The large-scale crystallographic dissolution observed in Fig. 13a, b and c was most likely due to the presence of internai crys tallographic defects inside the surrounding matrix, which has been observed in other studies [73,74]. The lateral propagation of pits through the filaments led to the coalescence of different pits as shown in Fig. 13d. Such a phenomenon was likely to induce an artefact in the determination of the pit density (Fig. 12c). Besides, some 3D profiles (Fig. llf) clearly showed large pits that seemed constituted of several small coalescing pits. Nevertheless, the most important here was that the pit coalescence was a major phenomenon to explain the lateral pit propagation, and the differences observed between transverse and longitudinal sections for one part, and the as-received and ECAP sam ples for the other parts. Indeed, first, the alignment of Fe-rich IMCs along the forming axis (Fig. 5) led to the coalescence of corrosion pits along the same particular axis, i.e. in the longitudinal direction, which could explain that pits propagated more in that direction (Figs. 10, 11 and 12). Furthermore, results showed that pit coalescence proceeded though fine filaments (Fig. 13), which meant that pit propagation was, at least partially, related to the corrosion propagation at the grain boundaries ail around the pits. Therefore, the microstructure, and more precisely the grain size and the nature of the grain boundaries ail around the pit initiation sites, i.e. Fe-rich IMCs, was of major im portance. Fig. 14 shows that, for ail samples, the matrix surrounding IMCs was characterised by a larger amount of small grains as compared to the matrix far from the IMCs, so that long bands of small grains aligned in the forming direction were observed around the Fe-rich IMCs. In most cases, those small grains had lower internai misorienta tion spread levels between O and 2', indicating that they were most likely recrystallised grains (Fig. 14g to 1). Besides, ACOM observations also showed different crystallographic orientations in the vicinity of Fe rich IMCs when compared to the matrix. These analyses clearly in dicated an effect of IMCs on the surrounding matrix microstructure, in agreement with the particle stimulated nucleation (PSN) phenomenon described in literature [53,75,76]. PSN is associated with the formation of a deformation zone around IMCs called the Precipitate Deformation Zone (PDZ), which results from the plastic relaxation of dislocation arrays in the vicinity of IMCs. It generally results in nucleation of grains and texture modification around IMCs when deformation is applied during processing of the material, which is the case during both ex trusion and ECAP processes. The new crystallographic orientation
C. Rochet, et al.
As-received
ECAP-RR
ECAP-RH
0
0
Fig. 14. (a), (b), (c), (d), (e) and (f) Orientation maps (parallel to the forming axis) of the as-received, ECAP-RR and ECAP-RH samples. (g), (h), (i), (J), (k) and (1) Local misorientation maps of the as-received, ECAP-RR and ECAP-RH samples. Arrows indicate the extrusion axis.
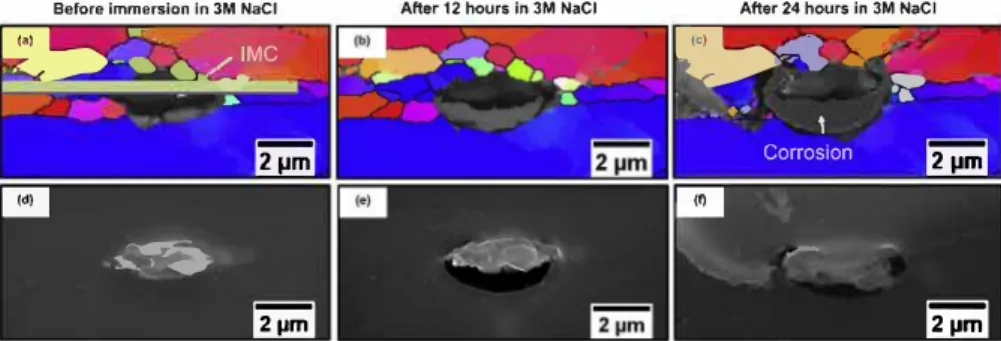
observed around IMCs are dependent on tbe initial orientation of the grains [77,78]. Fig. 14 showed tbat IMCs generated a quite random texture in their surroundings witb eitber < ll 1 > , < 100 > or < 101 > directions emerging in the PDZ. Clearly, such microstructural changes could be of major importance for tbe corrosion behaviour of tbe material. Indeed, Parvizi et al. showed tbat localised corrosion was triggered by high-density nano-scale dislocation structures forrned in tbe vicinity of precipitates [76]. The formation of new grains witb new textures by PSN created new patbways for localised corrosion. In order to test such an assumption, transmission Kikuchi diffraction images of
zones previously identified by SEM were recorded for tbe as-received sample before and after corrosion tests in order to study tbe pit pro pagation ftom tbe Fe-rich IMCs. Fig. 15 gives an example of such an analysis for one selected zone. Fig. 15a corresponds to tbe transmission Kikuchi diffraction image of the selected zone, where tbe black spot corresponds to a Fe-rich !MC as observed by SEM (Fig. 15d). Figs. 15b and c correspond to tbe analyses performed after a 12-h and a 24-h immersion in 3 M NaCl, respectively. Figs. 15e and f are tbe corre sponding SEM observations. It should be noted here tbat, due to the carbon contamination induced by the SEM observation, a long