O
pen
A
rchive
T
oulouse
A
rchive
O
uverte
(OATAO)
OATAO is an open access repository that collects the work of some Toulouse
researchers and makes it freely available over the web where possible.
This is
an author's
version published in:
https://oatao.univ-toulouse.fr/23783
Official URL :
https://doi.org/10.1016/j.jnoncrysol.2019.04.005
To cite this version :
Any correspondence concerning this service should be sent to the repository administrator:
tech-oatao@listes-diff.inp-toulouse.fr
Ponton, Simon and Dhainaut, Franck and Vergnes, Hugues and Samélor, Diane and
Sadowski, Daniel and Rouessac, Vincent and Lecoq, Hélène and Sauvage, Thierry and
Caussat, Brigitte and Vahlas, Constantin Investigation of the densification mechanisms
and corrosion resistance of amorphous silica films. (2019) Journal of Non-Crystalline Solids,
515. 34-41. ISSN 0022-3093
OATAO
Investigation of the densi
fication mechanisms and corrosion resistance of
amorphous silica
films
Simon Ponton
a,b, Franck Dhainaut
a,b, Hugues Vergnes
b, Diane Samelor
a, Daniel Sadowski
a,
Vincent Rouessac
c, Hélène Lecoq
d, Thierry Sauvage
d, Brigitte Caussat
b, Constantin Vahlas
a,⁎ aCIRIMAT, Université de Toulouse, CNRS, Toulouse, FrancebLGC, Université de Toulouse, CNRS, Toulouse, France
cIEM, Université de Montpellier, CNRS, ENSCM, Montpellier, France dCEMHTI, CNRS, Orléans, France
A R T I C L E I N F O Keywords: Silica TEOS CVD Densification FTIR P-etch test A B S T R A C T
The barrier properties of the technologically attractive amorphous silica films depend on their structural
characteristics at the atomic level, which, in turn are strongly influenced by the deposition conditions. In this
paper, we propose an investigation of the poorly investigated densification mechanism of amorphous SiO2films
processed by CVD from TEOS and O2between 400 and 550 °C. Based on literature survey and our original
experimental results, we show that the densification process of these films, occurring with increasing the
de-position temperature, is highlighted by a decrease of the water and silanol content, probed by transmission FTIR. We discuss the evolution of Si-O-Si related vibration signatures and we use the central force model to correlate
the LO2and LO3shifts with the decrease of the Si-O-Si bond force constant, when the deposition temperature
increases. Nuclear analysis reveals thatfilms processed below 525 °C present hydrogen content between 5 ± 0.3
and 7 ± 0.3%at. Ellipsometry measurements attest thatfilms processed at 550 °C are close to O/Si silica
stoi-chiometry and hydrogen free. We show that application of the P-etch test results in particularly low erosion rate
of 10 Å.s−1for densefilms processed at 550 °C.
1. Introduction
Thin and dense SiO2films processed from tetraethyl orthosilicate (Si
(OC2H5)4, TEOS) by chemical vapor deposition (CVD) have long been
considered to solve mainly microelectronic issues, such as copper dif fusion barrier, dielectric capacitor and intermetallic dielectric layers for multilayer metallization systems [1]. Nowadays, suchfilms remain key enabling materials in innovative applications and devices [2 6]. These applications have in common a low thermal budget process require ment due to thermally sensitive, or 3D complex geometry substrates. Addition of oxygen [7] or ozone O3[8] in the gas phase or the use of
plasma assistance (PECVD) [9,10] are well known actions resulting in lower thermal budget processes, yielding silicafilms at moderate tem peratures, typically lower than 600 °C. More recently, atomic layer deposition (ALD) of SiO2thin films has also been performed at low
temperature to solve optical applications issues [11] or to cap nano porous anodic alumina membranes employed in biosensor devices [12]. The correlation between the effects of such low temperature deposition and the atomic arrangement of the silica structure is not well
understood, especially considering that the densification process is complex and multi parameter dependent [13]. However, the atomic arrangement of the material is the key to understand its targeted barrier properties when such silicafilms are used as barrier coatings [4,5] or to understand the special selectivity of gases when it is used in gas membranes [6].
The structure of the amorphous SiO2films has been defined by Sen
and Thorpe [14] and Galeener [15] as a short range organized con tinuum built up from tetrahedral entities centered on a silicon atom. Each oxygen atom at the corner of a tetrahedron is shared by another tetrahedral unit and cross links the entire network. Twofold co ordinated bridging oxygen is more mobile than fourfold coordinated silicon and has been considered as the main contributor to the atomic vibration of this system [16]. Vibration modes of this oxygen are in timately related to the SiO2structure and, consequently, the spectral
changes under densification should reveal information on the atomic distribution of the network. Three vibration modes of the oxygen atom linked with two silicon atoms are assigned in the mid infrared (IR) region between 400 cm−1and 4000 cm−1. These are the transversal
⁎Corresponding author.
2. Experimental
Depositions were performed in a horizontal, hot wall tubular CVD reactor, presented in the supplementary material (Fig. S1). For each experiment, six 30 × 10 × 0.2 mm3 Si coupons cut from 4’ Si(100)
wafers (Sil'tronix ST) were degreased in sequential acetone and ethanol ultrasound baths for 5 min each, dried in Ar flow, positioned on a stainless steel planar substrate holder and immediately introduced in the reactor. TEOS vapors were introduced in the reactor by bubbling 58 standard cubic centimeters (sccm) of nitrogen, N2(99.9999%, Messer)
though the liquid precursor heated at 51 °C. 520 sccm of O2(99.999%,
Messer) are added to the mixture just before the reaction chamber. Experiments were performed atfive different Td, namely 400 °C, 450 °C,
500 °C, 525 °C and 550 °C, at a constant pressure of 730 Torr. An an nealing at 800 °C during 30 min under ambient atmosphere was per formed on one sample processed at 550 °C. The thickness profiles of the SiO2films on all coupons were measured by reflectometry and served to
deduce mechanistic and kinetic information for each experimental condition. More information about the deposition setup and the kinetic results obtained is available in our recent companion paper which deals with the development of a kinetic model of this process [7].
FTIR spectrometry was performed in transmission mode with a optical rocking (TO1), bending (TO2) and asymmetric stretching (TO3)
modes, which are observed respectively at around 450 cm−1, 800 cm−1
and 1070 cm−1 [16]. The TO
1 mode is sensitive to structural changes
[17] but its frequency shift is too weak to be monitored by FTIR, i.e. the shift is in the same order of magnitude with the measurement un certainties. An additional vibration mode, the TO4, is assumed by some
authors between 1050 cm−1 and 1250 cm−1 [18 20]. It has been at
tributed to the out of phase vibrations of the TO3 mode [20,21], to the
longitudinal, LO3 mode in this area [22], to the presence of residual
TEOS molecules [23] and to strained 3 to 6 fold SieO rings [19,24,25]. The debate around the attribution of a physical phenomenon to the TO4
broad band reveals the difficulty to correlate the existence and the characteristics of this vibration with the short range organization of the network. This difficulty may be attributed to the intrinsic nature of the material, which is amorphous, with randomly crosslinked tetrahedral entities [15]. Thus, the overall characteristics of CVD SiO2 films, such as
stoichiometry [26,27], porosity [28], impurities [29,30] and mechan ical strain [24] which depend on the process conditions, will affect the FTIR signature, the evolution of the refractive index and consequently they may bias the interpretation of the densification process.
This literature review reveals that, despite uncertainties on the origin of some vibrations, FTIR is an appropriate technique to monitor the evolution of the silica network, and for this reason it will be used in the present work. We will adopt the central force model proposed by Sen and Thorpe [14] and applied to glasses by Galeener [15] in order to link FTIR signatures to structural changes. This model connects SiO2
vibrations to the Si O Si intertetrahedral bond angle, θ, and the SieO force constant, α, of the SiO2 network [31]. Nonetheless, the model
assumes perfect stoichiometric, continuous SiO2 network and it takes
into account neither composition deviations, namely the offset with regard to the nominal O/Si ratio, nor the presence of heteroatoms such as carbon impurities, nor the porosity, nor the mechanical strain that can be observed in CVD SiO2 films. Consequently, and in order to ela
borate a scenario of the evolution of the structure under different process temperatures (Td), we perform complementary characteriza
tions to get insight on these parameters: we quantify by nuclear analysis the concentrations of silicon, oxygen and hydrogen; we determine both the refractive index by reflection spectroscopic ellipsometry (SE) using the Sellmeier model, and the porosity by ellipsometric porosimetry (EP) measurements using the Cauchy model. Finally, we apply selective chemical corrosion tests proposed by Pliskin [13,32] in order to cor relate the evolution of the structure with its intrinsic resistance towards aggressive medium.
Frontier FT IR/NIR instrument. The 400 4000 cm−1 spectral range was
probed with a 2 cm−1 spectral resolution. Fifty spectrum accumulations
were performed for each experiment. Raw data were processed in order to remove light interferences and substrate signature. The position of SiO2 peaks are affected by the thickness of the film in transmission mode
[33]. Films with similar thicknesses were investigated, ranging from 338 nm to 416 nm and the absorbance was normalized by the film thickness. A homemade substrate holder was used in order to apply an angle between the incident beam and the sample, to observe the TO LO splitting. Two instruments were used for ellipsometry investigations. First, EP measurements were used to evaluate the open nanoporosity of the films. A Semilab GES5E spectroscopic ellipsometer was used on pur pose, operating between 250 nm and 1000 nm, at a fixed incidence angle of 70°. This ellipsometer is completed with a lab made chamber set up for automatic vapor adsorption desorption investigation [34,35]. Porosity was estimated by probing the evolution of the refractive index due to the intake of the ethanol by the structure. Before any acquisition of the refractive index and thickness of the layer, the sample was maintained under vacuum at 150 °C to desorb water or other volatile adsorbed compounds. Refractive index and thickness calculation were monitored at variable ethanol pressures by adding gradually the solvent in the chamber. The filled pore fraction of the open pores is a function of the partial pressure of the solvent above the sample. Ellipsometric data tan(psy) and cos(delta) are collected then simulated and fitted on the 390 1000 nm spectral range with a goodness of fit over 0.99, using the Cauchy model (Winelli2® software).
In addition, a Semilab SE 2000 instrument operating in the 250 nm to 1000 nm spectral range with fixed incidence angle of 70° was used to evaluate the refractive index by SE. The spectroscopic ellipsometry data were simulated and fitted using the Semilab SEA software. The Sellmeier model was used as a reference to determine the refractive index and the films thickness.
The O/Si atomic ratio of film was determined by coupling the Rutherford Backscattering Spectroscopy (RBS) and Nuclear Reaction Analysis (NRA) techniques for Si and O analysis, respectively. RBS was performed at a 166° detection angle with 2 MeV α particles. The oxygen concentration was measured through the use of the 16O(d,α
0) nuclear
reaction with D+ ion beam of energy 0,9 MeV and at a 166° detection
angle of emitted alphas. The hydrogen content of SiO2 film was mea
sured by ERDA with 2,8 MeV alphas beam. The samples were posi tioned at 15° grazing incidence and the recoiled hydrogen atoms were collected at scattering angle of 30°. The global composition of films is obtained through the simulation of the RBS, NRA and ERDA spectra by using the SIMNRA software [36].
The corrosion resistance of the films was evaluated by using the P etch solution test, proposed by Pliskin [13]. The test consists in im merging the sample for 30 s in a stirred solution maintained at 25 °C. The solution is composed of 3 parts hydrofluoric acid (49 wt%), 2 parts of nitric acid (70 wt%), and 60 parts of water. The P etching rate for each sample corresponds to the thickness loss for a given etching time, determined by SE and is given in Å.s−1
, 3. Results and discussion
3.1. FTIR
Fig. 1 presents a typical 400 4000 cm−1 FTIR survey spectrum of a
SiO2 film processed at Td = 400 °C. According to the literature [16], the
TO1, TO2 and TO3 vibration modes are detected at 450 cm−1, 798 cm−1
and 1074 cm−1, respectively. The TO
4 broad band appears around
1100 1200 cm−1. Water content is observed between 3300 and 3600
cm−1 and silanol fingerprints are probed at 925 cm−1 and 3650 cm−1. Neither carbon (SieC) [37] nor CH3 [38] nor SieH im purities related
vibrations [29,39 41], expected respectively at 600, 1300 and 2000 cm
Fig. 2presents a zoom on the 700 1300 cm−1region of the FTIR spectrum of five samples processed at different Td, from 400 °C to
550 °C. This spectral domain includes the Si OH, and SiO2vibrations
modes (TO2, TO3and TO4). A color code is applied for each Tdand it
will be used in all forthcoming illustrations. Several informations are highlighted in thisfigure. First, a slight, though noticeable evolution of the position of the TO3 peak, corresponding to the asymmetric
stretching vibration mode is observed with increasing Td. At the same
time, the TO3peak broadens, from 72.5 cm−1at 400 °C to 81 cm−1at
550 °C as shown by the diagram in the insert ofFig. 2. Finally, a de crease of Si OH intensity is observed when Tdincreases. These three
informations will be discussed hereafter in other to have an insight into the reorganization of silicafilms when Tdincreases.
3.1.1. Evolution of TO3frequency with the increase of Td
It has been reported that the information contained in the evolution of the position of the TO3peak, provides insight in the densification
process of the SiO2network [13,42]. According to these authors, the
shift to higher wavenumbers (blue shift) of the TO3peak position in
dicates the densification of the SiO2network and conversely, a shift to
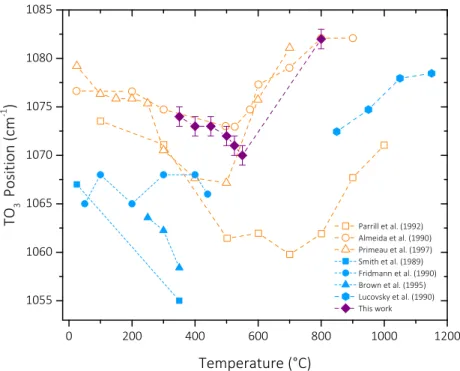
lower wavenumbers (red shift) is assigned to a decrease of the density. Fig. 3presents the evolution of the position of the TO3peak as a
function of Tdof the CVD samples of the present work (mauve diamond
plots). The point at the highest temperature corresponds to a sample deposited at 550 °C and annealed at 800 °C for 30 min. We observe a red shift of the TO3peak position with increasing Td, while the peak po
sition of the annealed sample shifts to a higher value. For sake of comparison, a compilation of literature data is also reported inFig. 3, as a function of deposition or post deposition annealing temperature [23,43 49]. Empty symbols correspond to sol gel, room temperature processed, then annealed SiO2films. Full symbols correspond to plasma
enhanced CVD (PECVD) SiO2 films, processed between room tem
perature and 250 °C. Two regimes are illustrated in the diagram. For deposition, or post deposition annealing temperatures equal to, or lower than 600 °C, the TO3 position presents a red shift or remains
stable with increasing temperature. Above 600 °C, it presents a blue shift with increasing temperature.
Literature and our own data present a remarkable coherence. The global behavior of all chemical systems used for the processing of SiO2
films indicates that the assumption following which densification is illustrated by a blue TO3shift, is not relevant forfilms processed and/or
annealed below 600 °C. This inconsistency is attributed tofilms defects such as porosity, impurities or mechanical strain resulting in less dense organization of the tetrahedral network [13]. The previously described TO4broad band is the representation of the disorder of the network and
it is relatively high for every silicafilms processed at temperature lower
4000 3500 3000 2500 2000 1500 1000 500
TO
3TO
2TO
1v
Si-OH
v
Si-OH
v
H-O-H
TO
4 Si O Si Si Si O Si Si OWavenumber (cm
-1)
Fig. 1. FTIR survey spectrum of a SiO2film processed at Td= 400 °C.
1300 1200 1100 1000 900 800 0.0 0.5 1.0 FWHM
Si-OH
TO
2TO
3Abs
o
rb
ance
(a
.u
)
Wavenumber (cm
-1)
550 525 500 450 400°CTO
4 400 450 500 550 72 76 80 T d(°C)TO3 Broadening
(cm1)FIG. 2. Zoom in the 700–1300 cm−1zone of the FTIR spectra containing the Si-OH, TO2, TO3, TO4vibrational modes, and their evolution as a function of Td. The
evolution of the TO3peak broadening is plotted as a function of Td.
f_/ __ /
-1 ---1---1
than 600 °C. This peak can strongly impact the position of the TO3peak.
At and above 600 °C, the Si O Si asymmetric stretching vibration mode is less impacted by the TO4broad band because fewer defects might be
observed in the structure. Consequently, the TO3peak position presents
a blue shift with increasing temperature [44]. 3.1.2. Broadening of TO3peak with the increase of Td
The broadening of the TO3peak revealed inFig. 2was also observed
for PECVD SiO2 films [48]. This behavior is attributed to a dis
organization of the network [50] and thus it cannot be linked to the densification of the SiO2 structure, either. Nonetheless, a close ob
servation reveals that this broadening is not related to the increase of the full width at half maximum (FWHM) of the peak but rather to a change in its shape. At high Td, the peak can no longer befitted by only
one gaussian or lorentzian function. The peak is shifted due to the asymmetric, one side increase of the peak area. An addition of a second contribution had to be assumed. The existence of two contributions below the TO3main peak has been already suggests by authors [51,52].
To explain this behavior, they assigned the contribution of two asym metric stretching mode vibrations from two different phases.
3.1.3. Decrease of hydrated species specific peak intensities with the increase of Td
Fig. 2reveals a simultaneous decrease of the intensities of the TO4
vibration shoulder and of the Si OH vibrations located at 925 and 3650 cm−1 with increasing Td. Above Td= 500 °C, almost no Si OH
located at 925 cm−1is probed. In order to confirm this trend, it is useful to focus on the 2750 3800 cm−1spectral domain, also containing Si OH and H OH vibrations.Fig. 4presents the FTIR spectra in this do main for the samples processed in thefive investigated Td. A common
baseline has been adopted for all five spectra. The insert in Fig. 4 presents the evolution, with increasing Td, of the peak intensities of the
Si OH and H OH vibrations located at 3650 cm−1and at 3400 cm−1, respectively. As is the case for the Si OH vibrations located at 925 cm−1, their intensity in the presented spectral domain also de creases with increasing Td, and the same holds for the H OH vibration.
Moreover, it is observed in the insert of thefigure that this decrease is slightly accelerated above 500 °C for both bonds.
When Tdincreases, the structure is less hydrated as shown from the
decrease of the H2O and Si OH vibrations inFig. 4. At the same time,
the intensity of TO4decreases and the TO3peak area increases. More
over, the attenuation of the TO3broadening above 450 °C observed in
Fig. 2, can be correlated to the reduced Si OH population above this temperature. Based on this assumption, we suggest that at moderate temperature; i.e. below 600 °C, the SiO2network is composed of cross
linked Si O Si units with impurities which impact SieOeSi asymmetric stretching“out of plane” mode vibrations (TO4shoulder) [19,23,24].
These impurities can be assigned to hydrogen species (H2O and Si OH)
or structural disorder such as space among SiO4 tetrahedra [53]. At
higher temperature, additional Si O Si bonds are created and the amount of impurities decreases. This scenario results in the presence of two populations of Si O Si bonds, the classic Si O Si bond population which vibrates at the TO3 vibration frequency and another one re
presented by the TO4 vibration mode or by another asymmetric vi
bration mode suggested by authors [51,52]. Si O Si groups that vibrate at the TO4frequency are the one impacted by impurities [23] or por
osities [19,24]. As soon as the signature of hydrogen species decreases when Td increases, TO4decreases and the position and shape of the TO3
change as described. In order to check this assumption and to link the FTIR signature to structural changes, it is essential to further investigate the deconvolution of each contribution, especially in the TO3TO4re
gion.
3.1.4. TO3LO3splitting
By applying an oblique incidence of the infrared beam on the sample, the interaction of the electromagnetic field with the film is enhanced and the asymmetric stretching mode is split into two com ponents [54], the transverse optical excitation (TO) and the long itudinal optical one (LO), the latter called the Berreman effect [55,56]. Fig. 5 presents the evolution of each component of the asymmetric stretching mode for thefive Td, for an incidence angle of 60° with the
sample surface. A similar behavior to the one described hereafter is observed for all other tilt angles. The shape of the TO3peak varies when
tilted, with non Gaussian type evolution when Td increases, as pre
viously reported. This is attributed to the existence of two populations of the Si O Si group. At the same time, the TO3position presents a red
shift, while the position of the longitudinal component (LO3) presents a
blue shift. Similar observations were obtained on mesoporous SiO2
films [57]. Due to TO4splitting, Lange et al. [54] attributed TO4and
LO4frequencies at 1200 cm−1and 1170 cm−1respectively. While TO3
0
200
400
600
800
1000
1200
1055
1060
1065
1070
1075
1080
1085
TO
3Posi
tion
(cm
-1)
Temperature (°C)
Parrill et al. (1992) Almeida et al. (1990) Primeau et al. (1997) Smith et al. (1989) Fridmann et al. (1990) Brown et al. (1995) Lucovsky et al. (1990) This workFig. 3. Overview of TO3position as a function of
post-an-nealing temperature for SiO2films. Empty symbol data: sol-gel
films processed at room temperature. Full symbol data: PECVD films processed between room temperature and 250 °C. Empty
squares [25], empty dots [43], empty triangles [23], full
squares [48], full dots [49], full triangles [46], full pentagons
[44]. Full diamonds correspond to samples of the present work
positioned as a function of the deposition temperature. The point at the highest temperature corresponds to a sample de-posited at 550 °C and annealed at 800 °C for 30 min.
,
---0
6. .,"/ I I I I I I I .,0 I ;✓ , 0~ ,' 6, I '~
0-~'t',.:.--::_2::CJ'
,'
6 2'.:)-,0\ -
L
y,
:i:_~
.
,
, /
',
,'
1•----
.., .._..., \\
rY-- -
'J,'
I,,
'R"
I "\, I·-
,,/·
'
~
~
::
.
--ti
I• --_,/ ---
\
~
I ___ , ' I -•
---
... __
'
•' -
0--.,,',,,
\•--- •,,
/
-6-··· ... :.
--•--
_t
---
•
-+-.,
•'
,.---.
,•
and LO3probe the same asymmetric stretching vibration mode, other
types of vibration may less bias the LO3response. Consequently, the
blue shift observed for the LO3peak is predominantly attributed to the
asymmetric stretching vibration [58,54].
In order to confirm the effective densification of the SiO2network
with increasing Td, as assumed by the blue shift of LO3, we now apply
the central force model which correlates the different Si O Si vibration frequencies (ω, cm−1) with the effective force constant (α, N.m−1) and
the angle (θ) of the bond [15]:
= + + −
α ½(ωLO22 ωLO32) M (1O 4M /3M )O Si 1 (1a)
= − + − +
cos θ (ωLO22 ωLO32) (ωLO22 ωLO32) (11 4M /3M )O Si (1b)
where MO(16 g.mol−1) and MSi(28 g.mol−1) are the molar masses
of oxygen and silicon. The evolution of the effective force constant and of the angle of the Si O Si bond versus Tdcan be determined by mea
suring the evolution of the LO2and LO3frequencies,ωLO2andωLO3.
Since the TO2LO2splitting is negligible, TO2and LO2frequencies are
merged and the evolution of the LO2frequency is assumed identical to
that of the TO2one.Table 1details the LO2and LO3shifts, the evolu
tions of the force constant and of the intertetrahedral bond angle as a function of Td. The model predicts that with increasing Td, the effective
force constant increases and the intertetrahedral bond angle remains stable. It is concluded that, by differentiating the TO3LO3pairs, it is
possible to isolate the asymmetric stretching contribution and to con firm the densification of the SiO2network, despite the red shift which is
observed for the TO3peak.
3.2. Nuclear analysis
The red shift of the TO3vibration mode is assigned tofilms defects
in general, including impurities. We perform ion beam analysis in order to access the composition of thefilms processed between 400 °C and 550 °C. The results are resumed inFig. 6in terms of the evolution of the O/Si atomic ratio and of the atomic percentage of hydrogen atoms as a function of Td.
Between 400 and 525 °C the O/Si atomic ratio remains stable at a value slightly higher than 2, attributed to the presence of H2O
3800 3600 3400 3200 3000 2800 0.00 0.02 0.04 0.06 0.08 0.10
H
2O
Si OH
Absorbanc
e
(a
u)
Wavenumber (cm
1)
550 525 500 450 400°C 400 450 500 550 0 02 0 04 0 060 08Absorbance intensity (a.u)
Td(°C) Slope break Si-OH (3650 cm1 ) H2O (3400 cm 1 )
Fig. 4. Zoom in the 2750–3800 cm−1zone of the FTIR spectra containing Si-OH and H
2O vibrational modes, forfilms processed at different Td. Insert: Evolution of
the absorbance intensity of H2O and Si-OH peaks as a function of Td.
1300 1200 1100 1000 0.0 0.1 0.2 0.3 0.4 TO3 A b sor b an ce (a u ) Wavenumber (cm1 ) LO 3 550 525 500 450 400°C 400 450 500 550 1070 1072 1074 LO 3frequency (cm 1) T d(°C) TO3frequency (cm 1 ) 1232 1236 1240
Fig. 5. Zoom in the 1000–1300 cm−1 zone of the FTIR
spectra, obtained for a 60° tilt of the incident beam with the
sample surface, of SiO2films processed at different Td. The
two TO3and LO3peaks are obtained from the split of the
asymmetric stretching mode in these probing conditions. Insert: Shift of the TO3and LO3peaks as a function of Td. Table 1
TO2and TO3peak shifts, effective force constant (α) and angle (θ) versus Td.
Td(°C) ωLO2(cm 1) ωLO3(cm 1) α (N.m 1) θ (°) 400 798 1231 570.2 134.8 450 806 1232 572.1 134.4 500 809 1234 574.2 134.3 525 811 1235 575.7 134.1 550 813 1238 578.1 134.3
"---,!
..__---
--
;:~::
,
_
.
_
''
(
_-.
_
'-,
:-
---
..
7-- ---uI.
I
I ---l---1
,'
J
>
J
-·
J"_
--,molecules in the network as was revealed by FTIR. This ratio decreases to ca. 1.93 at 550 °C. However, this evolution remains within the un certainty of the measurements. At Tdequal to or lower than 525 °C, the
hydrogen concentration varies between 5.0 ± 0.3 and 7.0 ± 0.3 at.%. At Td= 550 °C, it is below the detection limit of ERDA, namely 0.5 at.
%. These results are consistent with a decrease of the concentrations of water and silanol groups at 550 °C. Silanol groups were not probed at 925 cm−1by FTIR at this temperature and a low signal was probed for water and silanol groups at 3650 cm−1. However, the decrease of water content and silanol groups between 400 and 525 °C, observed by FTIR, is not probed by nuclear analysis. This can be attributed to the con ditioning of the samples under secondary vacuum during nuclear ana lysis, resulting to water desorption from the structure. It can also be attributed to the current density received by the sample under the ion beam which may result in a preferential desorption.
It is worth noting that hydrogen containing silicafilms have often been reported in the literature. For example,films processed by plasma enhanced ALD and thermal, ozone involving ALD from various silicon precursors present a relatively high hydrogen concentration, in the range 10 to 13 at.% [59]. Also,films processed by PECVD from hex amethyldisiloxane (HDMSO) and O2present a Tddependent hydrogen
concentration, decreasing from 18.5 at.% at 50 °C to 5.3 at.% at 300 °C [60].
The significant amount of hydrogen probed by nuclear analysis and a non negligible amount of water probed by FTIR can be assigned to the deposition process since it is a by product of the CVD reaction between TEOS and oxygen [61]. It can also be due to the post processing ad sorption of water in the SiO2structure, as reported by some authors
[62 64]. For example, Lucovsky et al. observed a significant intake of H2O after 5 days storage at ambient atmosphere which has a strong
effect into the TO3band [64].
Also, thermal desorption and FTIR studies of the gas evolution and the microstructure of PECVD silicon oxide grown between 70 and 700 °C from TEOS and oxygens show that between 100 and 300 °C, gas desorption is due to adsorbed water in the film during air exposure, originating from liquid water and hydrogen bonded water molecules at the macropore site [65]. At higher temperature, from 350 °C to 650 °C, gas desorption is related to the isolated silanol bonds at the macro and micropore sites formed duringfilm growth.
3.3. Ellipsometry
The densification of the films involves an evolution of their porosity, taken in the broader sense of the free space available among the SiO4
tetrahedra. In order to get insight in this parameter, twofilms processed at 400 and at 550 °C; i.e. the highest and lowest Tdwere characterized
by EP. The refractive index, n550, of thefilm processed at 550 °C, de
termined using the Cauchy model, was shifted from 1.450 to 1.423 after the warm up stage up to 150 °C. Taking into account that this tem perature is too low to induce structural modifications in the film, the evolution of the refractive index gap can be assigned to water removal, contained in thefilm (nvoid= 1 < nH2O). Then, ethanol was introduced
in the chamber. The value of n550remained unchanged to 1.423. EP
measurements were not sensitive enough to determine a possible por osity in thefilms. In the literature, ultra microporous SiO2films exhibit
a porosity smaller than 1 nm [66]. Studies were done in order to un derstand the adsorption of water molecules inside 1.04, 1.96 and 2.88 nm diameter silica pores [67]. The proposed scenario considers the coverage of the surface of each pore by silanol groups. Afirst stage, defined by a preferential adsorption of the water molecule near silanol groups, is followed by the formation of a water monolayer over the entire pore surface. In the presence of excess water molecules, pores are completelyfilled with water.
The evolution of the refractive index versus Tdusing the Sellmeier
models is presented in Fig. 7. Two regimes are observed; below Td= 500 °C the refractive index remains stable. Above 500 °C, the re
fractive index decreases. Two scenarios are reported in the literature for the correlation between the characteristics of the SiO2films and their
refractive index: for stoichiometricfilms, the refractive index increases when the network becomes denser due to the decrease of porosity content that contain void or water with a refractive index of the en vironment lower than that of SiO2[68]. For non stoichiometric SiOx
films, the refractive index decreases when the SiO2network becomes
denser [69]. This behavior is assigned to the incorporation of oxygen in the structure, this enrichment goes with a decrease of the refractive index because nSi> nSiO> nSiO2.
At Tdup to 500 °C, the stability of the refractive index can be at
tributed to afilm composition that remains stable as suggested by nu clear analysis. However, this conclusion does notfit FTIR results, which reveal a decrease of the H2O and Si OH FTIR vibration modes when Td
increases. To counterbalance the expected decrease of the refractive index due to the dehydration of the layer, the incorporation of oxygen
400 450 500 550 1.5 1.6 1.7 1.8 1.9 2.0 2.1 2.2 O/ S a t rat o Td( °C) 0 1 2 3 4 5 6 7 8 H( %a t )
Fig. 6. Evolution of the O/Si atomic ratio (filled squares) and of the atomic
percentage of hydrogen atoms (open triangles) as a function of Td, probed by
ion beam analysis. Dotted lines are guide to the eye.
400 450 500 550 1.448 1.452 1.456 1.460
Re
fr
ac
t
ve
ndex
,
n
T
d(°C)
Fig. 7. Evolution of the refractive index of the SiO2films processed between
20 ~ 15 'v, ~ ~
e
.r:. 10 !::l (I) d. 5t-
---
+-
-•
0- ' - ~ - - ~ - ~ - - ~ - - ~ - ~ - - ~ - -/,1---~-' '/ 400 450 500 550 Annealingsoo·c
Fig. 8. P-etch rate versus Td and post-annealing at 800•
c
for the Si~ films. in the network is considered when T d increases above 500•
c
.
At this temperature range, the incorporation of oxygen can indeed be assigned to the generation of new Si O Si bonds. This result suggests an increase of the structure densification when Td increases.3.4. Co,rosion resistance
Pliskin proposed in 1964 an etching solution in order to compara tively investigate the resistance of various glass and oxide fihn systems [32). Since then, the Pliskin etch or P etch has been commonly adopted in order evaluate the impact of the type of deposition technique, of the chemistry and of the different process parameters on the resistance to the involved corrosive solution of the SiO2
films
.
Fig. 8 presents the Petch rate (A.s-1
) of the films deposited between
400
•
c
and 550•
c
.
Theresistance to the corrosive solution is clearly improved with increasing Td, from 18A.s-1 to lOA.s-1
• These results favorably compare with
those of previously reported SiO2 films processed below 600
•
c
byPECVD [70) or using ozone [71), for which the P etch rate varies be tween 8 and 53 A.s-1
• An annealing at 800
·
c
durins 30 min of the films(independently of Td) presents a Petch rate of 2A.s-1; i.e. similar to
the denser silica fihn obtained by pyrolysis at temperature higher than 975
•
c
[13). This behavior is indirectly linked to the porosity, the composition, the stoichiometry and ultimately to the density of the films [13).4. Conclusions
An original methodology is developed in order to propose a corn prehensive scenario for the densification mechanism of CVD SiO2 films
processed from TEOS and oxygen in the temperature range
400
550•
c
.
The combination of different characterization techniques allows as signing the densification process first to a dehydration of the film based on the decrease of the water and silanol peaks, revealed by FTIR. Asignificant hydrogen content between 5 ± 0.3%at. and 7 ± 0.3%at. is
determined by nuclear analysis for films processed below Td
=
525•
c
.
Films processed at T d
=
550•
c
are hydrogen free and present a slightlysubstoichiometric structure. Ellipsometric porosimetry allows con eluding that if the films present porosity, the diameter of this porosity might be smaller than the detection limit of EP measurements. The corrosion resistance, probed by the P etch rate test, is improved from 18 to 10A.s-1 with increasing Td; i.e. with the Si-O-Si network densifi
cation. Upon annealing at 800
•
c
for 30 min, the P etch rate is further improved, decreasing to 2>..s-1, the lowest reported value for SiO2,similar to the one of films obtained from the pyrolysis ofTEOS at almost
1000
•
c
.
This test indirectly confirms the densification of the fihn with increasing Td. The integration of the reported various experimental information confirms the proposed mechanism and indicates that amorphous SiO2 films processed from TEOS and oxygen at 550•
c,
aredense and thus present high normalized corrosion resistance.
Aclmowledgm
e
n
ts
We are indebted to Olivier Debieu, CIRIMAT Toulouse for advice with the ellipsometry investigations, and to Benoit Ridard and Herve Guegan, ARCANE CENG Bordeaux for the nuclear investigations. This work was partly supported by the Agence Nationale de la Recherche (ANR) under contract #ANR 17 CE08 0056.
References
(1 J S.P. Murarlca, R.J. Gutmann, A.I!. Kaloyeros, WA. Lanford, Advanced multilayer metallization schemes with copper as interconnection metal, Thin Solid Films 236
(1993) 257-266, https:/ /doi.org/10.1016/0040-6090(93)90680-N.
(2) S. Callard, A. Gagnaire, J. Joseph, New method for in situ control of Bragg reflector fabrication, Appl. Phys. Lett. 68 (1996) 2335-2336, https://dci.org/10.1063/1. 115849.
(3) C. Martinet, V. Paillard, A. Gagnaire, J. Joseph, Deposition of SiO2 and TiO2 thin films by plasma enhanced chemical vapor deposition for antireflection coating, J. Non-Cryst. Solids 216 (1997) 77-82.
(4) AG. Erlat, 8.-C. Wang, R.J. Spontak, Y. Tropsha, K.D. Mar, D.B. Montgomery, l!.A Vogler, Morphology and gas barrier properties of thin SiOx coatings on poly
-carbonate: correlations with plasma-enhanced chemical vapor deposition condi
-tions, J. Mater. Res. Pittsburgh 15 (2000) 704-717, https://doi.org/10.1557/JMR. 2000.0103.
(5) P.A Premkumar, SA. Starostln, M. Creatore, H. De Vries, R.M.J. Paffen, P.M. Koenraad, PA. Premlcumar, M.C.M. Van De Sanden, S.A Starostln, Smooth
and self-similar SiO2-llke films on polymers synthesized In roll-to-roll atm00pheric
pressure-PECVD for gas diffusion barrier applications, Plasma Process. Polym. 7 (2010) 635-639, https:/ /doi.org/10.1002/ppap.200900179.
(6) S. Nltodas, E. Favvas, G. Romanos, M. Papadopoulou, A Mitropoulos,
N. Kanellopoulos, Development and characterization of sillca-based membranes for
hydrogen separation, J. Porous. Mater. 15 (2008) 551-557, https://doi.org/10. 1007 /s10934-007-9132-4.
(7) S. Ponton, H. Vergnes, D. Samelor, D. Sadowslcl, C. Vahlas, B. Caussat, Development of a kinetic model for the moderate temperature chemical vapor deposltlon of Si02 films from tetraethyl orthosilicate and oxygen, AI CHE J. 64 (2018) 3958-3966,
https:/ /doi.org/10.1002/aic.16222.
(8) S.V. Nguyen, D. Dobuzinslcy, D. Dopp, R. Gleason, M. Gibson, S. Fridmann, Plasma
-Assisted Chemical Vapor Deposition and Characterization of High Quality Silicon
Oxide Films, Thin Solid Films 194 (1990) 595~, https://doi.org/10.1016/0040·
6090(90)90211-U.
(9) C. Valle, A. Goullet, A Granier, A. Van Der Lee, J. Durand, Inorganic to organic crossover in thin films deposited from O2/Tl!OS plasmas, J. Ncn-Cryst. Solids 272 (2000) 163-173.
(10) S.C. Deshmulch, l!.S. Aydil, Investigation of SiO2 plasma enhanced chemical vapor
deposition through tetraethoxysilane using attenuated total reflection Fourier transform infrared spectrOSCOpy, J. Vac. Sci. Technol. A 13 (1995) 2355-2367,
https:/ /doi.org/10.1116/1.579521.
(11) K. P£eiffer, S. Shestaeva, A Binge!, P. Munzert, L Ghazaryan, C. van Helvoirt,
W.M.M. Kessels, U.T. Sanll, C. Grevent, G. Schiltz, M. Putkonen, I. Buchanan,
L Jensen, D. Ristau, A. T!lnnermann, A Szeghahni, Comparative study of ALD Si02
thin films for optical applications, Opt. Mater. Express. 6 (2016) 660, https://doi. org/10.1364/OMl!.6.000660.
(12) V. Romero, V. Vega, J. Garcia, R. Zierold, K. Nielsch, V .M. Prida, B. Hernando,
J. Benavente, Changes in morphology and ionic transport induced by ALD SiO2 coating of nanoporous alumina membranes, ACS Appl. Mater. lnteifaces 5 (2013) 3556-3564, https:/ /doi.org/10.1021/am400300r.
(13) WA. Plislcln, Comparison of properties of dielectric films deposited by various methods, J. Vac. Sd. Technol. 14 (1977) 1064-1081, https://doi.org/10.1116/1. 569413.
(14) P.N. Sen, M.F. Thorpe, Phcnons In AX2 glasses: from molecular to band-like modes, Phys. Rev. B 15 (1977) 4030-4038, https://doi.org/10.1103/PhysRevB.15.4030. (15) F.L. Galeener, Band limits and the vibrational spectra ,:J tetrahedral glasses, Phys.
Rev. B 19 (1979) 4292-4297, https:/ /doi.org/10.1103/PhysRevB.19.4292. (16) S. Taraslcln, S. I!llJott, Nature ,:J vlbratlcnal excitations In vitreous silica, Phys. Rev.
B 56 (1997) 8605-8622, https:/ /doi.org/10.1103/PhysRevB.56.8605. (17) H. Schliwinski, U. Schnakenberg, W. Windbraclce, P. Mikrostrulcturtechnik,
Plasma-Enhanced Chemical Vapor Deposited Silicon Oxide Films, 139 (2000), pp. 1730–1735.
[18] I. Montero, L. Galn, O. Najmi, J.M. Albella, Disorder-induced vibration-mode cou-pling in SiO2films observed under normal-incidence infrared radiation, Phys. Rev. B 50 (1994) 4881–4884,https://doi.org/10.1103/PhysRevB.50.4881.
[19] P. Innocenzi, P. Falcaro, D. Grosso, F. Babonneau, Order disorder transitions and evolution of silica structure in self-assembled Mesostructured silicafilms studied through FTIR spectroscopy, J. Phys. Chem. B 107 (2003) 4711–4717,https://doi. org/10.1021/jp026609z.
[20] P. Lange, Evidence for disorder-induced vibrational mode coupling in thin amor-phous SiO2films, J. Appl. Phys. 66 (1989) 201–204,https://doi.org/10.1063/1. 344472.
[21] C.T. Kirk, Quantitative analysis of the effect of disorder-induced mode coupling on infrared absorption in silica, Phys. Rev. B 38 (1988) 1255–1273.
[22] M.K. Gunde, Vibrational modes in amorphous silicon dioxide, Phys. B 292 (2000) 286–295,https://doi.org/10.1016/S0921-4526(00)00475-0.
[23] N. Primeau, C. Vautey, M. Langlet, The effect of thermal annealing on aerosol-gel deposited SiO2films: a FTIR deconvolution study, Thin Solid Films 310 (1997) 47–56,https://doi.org/10.1016/S0040-6090(97)00340-4.
[24] F. Ruiz, J.R. Martınez, J. Gonzalez-Hernandez, A simple model to analyze vi-brationally decoupled modes on SiO2 glasses, J. Mol. Struct. 641 (2002) 243–250,
https://doi.org/10.1016/S0022-2860(02)00348-4.
[25] T.M. Parrill, Transmission infrared study of acid-catalyzed sol-gel silica coatings during room ambient drying, J. Mater. Res. 7 (1992) 2230–2239,https://doi.org/ 10.1557/JMR.1992.2230.
[26] P.G. Pai, S.S. Chao, Y. Takagi, G. Lucovsky, Infrared spectroscopic study of SiOx films produced by plasma enhanced chemical vapor deposition, J. Vac. Sci. Technol. 4 (1986) 689–694,https://doi.org/10.1116/1.573833.
[27] C. Charles, Characterization of silicon dioxidefilms deposited at low pressure and temperature in a helicon diffusion reactor, J. Vac. Sci. Technol. 11 (1993) 2954–2963,https://doi.org/10.1116/1.578675.
[28] A. Fidalgo, L.M. Ilharco, The defect structure of sol-gel-derived silica/poly-tetrahydrofuran hybridfilms by FTIR, J. Non-Cryst. Solids 283 (2001) 144–154,
https://doi.org/10.1016/S0022-3093(01)00418-5.
[29] D.V. Tsu, G. Lucovsky, B.N. Davidson, Effects of the nearest neighbors and the alloy matrix on SiH stretching vibrations in the amorphous SiOr:H (0 < r < 2) alloy system, Phys. Rev. B 40 (1989) 1795–1805,https://doi.org/10.1103/PhysRevB.40. 1795.
[30] H. Yoshino, K. Kamiya, H. Nasu, IR study on the structural evolution of sol-gel derived SiO2 gels in the early stage of conversion to glasses, J. Non-Cryst. Solids 126 (1990) 68–78.
[31] C. Weigel, M. Foret, B. Hehlen, M. Kint, S. Clément, A. Polian, R. Vacher, B. Rufflé, Polarized Raman spectroscopy of v- SiO2 under rare-gas compression, Phys. Rev. B 93 (2016) 1–9,https://doi.org/10.1103/PhysRevB.93.224303.
[32] W. Pliskin, R. Gnall, Evidence for oxidation growth at the oxide-silicon Interface from controlled etch studies, J. Electrochem. Soc. 111 (1964) 872–873,https://doi. org/10.1149/1.2426271.
[33] C. Martinet, R.A.B. Devine, Analysis of the vibrational mode spectra of amorphous SiO2films, J. Appl. Phys. 77 (1995) 4343–4348,https://doi.org/10.1063/1. 359459.
[34] V. Rouessac, R. Coustel, F. Bosc, J. Durand, A. Ayral, Characterisation of mesos-tructured TiO2thin layers by ellipsometric porosimetry, Thin Solid Films 495 (2006) 232–236,https://doi.org/10.1016/j.tsf.2005.08.334.
[35] P. Revol, D. Perret, F. Bertin, F. Fusalba, V. Rouessac, A. Chabli, G. Passemard, A. Ayral, Porosimetry measurements on low dielectric constant-thin layers by coupling spectroscopic ellipsometry and solvent adsorption-desorption, J. Porous. Mater. 12 (2005) 113–121,https://doi.org/10.1007/s10934-005-6768-9. [36] M. Mayer, SIMNRA User's Guide, Germany, (1997).
[37] I.W. Boyd, J.I.B. Wilson, A study of thin silicon dioxidefilms using infrared ab-sorption techniques, J. Appl. Phys. 53 (1982) 4166–4172,https://doi.org/10.1063/ 1.331239.
[38] R.M. De Vos, W.F. Maier, H. Verweij, Hydrophobic silica membranes for gas se-paration, J. Memb. Sci. 158 (1999) 277–288, https://doi.org/10.1016/S0376-7388(99)00035-6.
[39] J. Gope, S. Kumar, S. Singh, C.M.S. Rauthan, P.C. Srivastava, Growth of mixed-phase amorphous and ultra nanocrystalline silicon thinfilms in the low pressure regime by a VHF PECVD process, Silicon. 4 (2012) 127–135,https://doi.org/10. 1007/s12633-012-9109-z.
[40] L. He, Y. Kurata, T. Inokuma, S. Hasegawa, Analysis of SiH vibrational absorption in amorphous SiOx:H (0≤x≤2.0) alloys in terms of a charge-transfer model, Appl. Phys. Lett. 63 (1993) 162–164,https://doi.org/10.1063/1.110386.
[41] D. Rouchon, N. Rochat, F. Gustavo, A. Chabli, O. Renault, P. Besson, Study of ul-trathin silicon oxidefilms by FTIR-ATR and ARXPS after wet chemical cleaning processes, Surf. Interface Anal. 34 (2002) 445–450,https://doi.org/10.1002/sia. 1335.
[42] P. Innocenzi, Infrared spectroscopy of sol-gel derived silica-basedfilms: a spectra-microstructure overview, J. Non-Cryst. Solids 316 (2003) 309–319,https://doi. org/10.1016/S0022-3093(02)01637-X.
[43] R.M. Almeida, H.C. Vasconcelos, L.M. Ilharco, Relationship between infrared ab-sorption and porosity in silica-based sol-gelfilms, SPIE. 2288 (1994) 678–687,
https://doi.org/10.1117/12.189004.
[44] J.T. Fitch, S.S. Kim, C.H. Bjorkman, G. Lucovsky, The effect of post-deposition thermal processing on MOS gate oxides formed by remote PECVD, J. Electron. Mater. 19 (1990) 151–158,https://doi.org/10.1007/BF02651740.
[45] S. Nguyen, D. Dobuzinsky, D. Harmon, S. Fridmann, Reaction Mechanisms of Plasma- and Thermal-Assisted Chemical Vapor deposition of Tetraethylorthosilicate
Oxide Films, J. Electrochem. Soc. 137 (1990) 2209–2215,https://doi.org/10.1149/ 1.2086914.
[46] M.S. Haque, H.A. Naseem, W.D. Brown, Characterization of high rate deposited PECVD silicon dioxidefilms for MCM applications, J. Electrochem. Soc. 142 (1995) 3864–3869,https://doi.org/10.1149/1.2048425.
[47] T.M. Parrill, Heat treatment of spun-on acid-catalyzed sol-gel silicafilms, J. Mater. Res. 9 (1994) 723–730,https://doi.org/10.1557/JMR.1994.0723.
[48] Z. Yin, D.V. Tsu, G. Lucovsky, F.W. Smith, Annealing study of the infrared ab-sorption in an amorphous silicon dioxidefilm, J. Non-Cryst. Solids 114 (1989) 459–461,https://doi.org/10.1016/0022-3093(89)90616-9.
[49] S.V. Nguyen, D. Dobuzinsky, D. Dopp, R. Gleason, M. Gibson, S. Fridmann, Plasma-assisted chemical vapor deposition and characterization of high quality silicon oxidefilms, Thin Solid Films 194 (1990) 595–609, https://doi.org/10.1016/0040-6090(90)90211-U.
[50] J.T. Fitch, Effects of thermal history on stress-related properties of very thin films of thermally grown silicon dioxide, J. Vac. Sci. Technol. B. 7 (1989) 153–162,https:// doi.org/10.1116/1.584708.
[51] D. Davazoglou, V.E. Vamvakas, Optical dispersion analysis within the IR range of thermally grown and TEOS deposited SiO2films, Microelectron. Reliab. 39 (1999) 285–289,https://doi.org/10.1016/S0026-2714(98)00217-0.
[52] D. Davazoglou, V.E. Vamvakas, Comparison of FTIR transmission spectra of ther-mally and LPCVD SiO2films grown by TEOS pyrolysis, J. Electro. Soc. 151 (2004) 93–97,https://doi.org/10.1149/1.1676725.
[53] F.L. Galeener, Planar rings in glasses, Solid State Commun. 44 (1982) 1037–1040,
https://doi.org/10.1016/0038-1098(82)90329-5.
[54] P. Lange, W. Windbracke, Characterization of thermal and deposited thin oxide layers by longitudinal optical-transverse optical excitation in fourier transform IR transmission measurements, Thin Solid Films 174 (1989) 159–164,https://doi.org/ 10.1016/0040-6090(89)90885-7.
[55] D.W. Berreman, Infrared absorption at longitudinal optic frequency in cubic crystal films, Phys. Rev. 130 (1963) 2193–2198,https://doi.org/10.1103/PhysRev.130. 2193.
[56] B. Harbecke, B. Heinz, P. Grosse, Optical properties of thinfilms and the Berreman effect, Appl. Phys. A Solids Surfaces. 38 (1985) 263–267,https://doi.org/10.1007/ BF00616061.
[57] N. Chemin, M. Klotz, V. Rouessac, A. Ayral, E. Barthel, Mechanical properties of mesoporous silica thinfilms: effect of the surfactant removal processes, Thin Solid Films 495 (2006) 210–213,https://doi.org/10.1016/j.tsf.2005.08.260. [58] K. Hübner, L. Schumann, A. Lehmann, H.H. Vajen, G. Zuther, Detection of LO and
TO phonons in amorphous SiO2films by oblique incidence of IR light, Phys. Status Solidi 233 (1981) 301,https://doi.org/10.1002/pssb.2221040145.
[59] M. Putkonen, M. Bosund, O.M.E. Ylivaara, R.L. Puurunen, L. Kilpi, H. Ronkainen, S. Sintonen, S. Ali, H. Lipsanen, X. Liu, E. Haimi, S.P. Hannula, T. Sajavaara, I. Buchanan, E. Karwacki, M. Vähä-Nissi, Thermal and plasma enhanced atomic layer deposition of SiO2using commercial silicon precursors, Thin Solid Films 558 (2014) 93–98,https://doi.org/10.1016/j.tsf.2014.02.087.
[60] M. Creatore, S.M. Rieter, Y. Barrell, M.C.M. van de Sanden, R. Vernhes, L. Martinu, Optical and chemical characterization of expanding thermal plasma-deposited carbon-containing silicon dioxide-likefilms, Thin Solid Films 516 (2008) 8547–8553,https://doi.org/10.1016/j.tsf.2008.05.022.
[61] M.G.M. Van Der Vis, E. Cordfunke, R. Konings, The thermodynamic properties of tetraethoxysilane (TEOS) and an infrared study of its thermal decomposition, J. Phys. IV 03 (1993) 75–82,https://doi.org/10.1051/jp4:1993309.
[62] R. Etemadi, C. Godet, J. Perrin, A. Seignac, D. Ballutaud, Optical and compositional study of silicon oxide thinfilms deposited in a dual-mode (microwave/radio-frequency) plasma-enhanced chemical vapor deposition reactor, J. Appl. Phys. 83 (1998) 5224–5232,https://doi.org/10.1063/1.367343.
[63] W.S. Liao, S.C. Lee, Water-induced room-temperature oxidation of Si-H and -Si-Si-bonds in silicon oxide, J. Appl. Phys. 80 (1996) 1171–1176,https://doi.org/10. 1063/1.362915.
[64] J.A. Theil, D.V. Tsu, G. Lucovsky, Reaction pathways and sources of OH groups in low temperature remote PECVD silicon dioxide thinfilms, J. Electron. Mater. 19 (1990) 209–217,https://doi.org/10.1007/BF02651747.
[65] Norio Hirashita, Shunichi Toikitoh, Hidetsugu Uchida, Thermal desorption and infrared studies of plasma-enhanced chemical vapor deposited SiOfilms with tet-raethylorthosilicate, Jpn. J. Appl. Phys. 32 (1993) 1787–1793.
[66] C.J. Brinker, T.L. Ward, R. Sehgal, N.K. Raman, S.L. Hietala, D.M. Smith, D.W. Hua, T.J. Headley,“Ultramicroporous” silica-based supported inorganic membranes, J. Memb. Sci. 77 (1993) 165–179,https://doi.org/10.1016/0376-7388(93)85067-7. [67] K. Shirono, H. Daiguji, Molecular simulation of the phase behavior of water
con-fined in silica nanopores, J. Phys. Chem. C 111 (2007) 7938–7946,https://doi.org/ 10.1021/jp067380g.
[68] P.N.K. Deenapanray, Influence of low-temperature chemical vapor deposited SiO [sub 2] capping layer porosity on GaAs/AlGaAs quantum well intermixing, Electrochem. Solid-State Lett. 3 (2000) 196–199,https://doi.org/10.1149/1. 1391000.
[69] G. Lucovsky, J.T. Fitch, E. Kobeda, E.A. Irene, Local atomic structure of thermally grown, Phys. Chem. (1988) 139–148 SiO2.
[70] C. Vallée, A. Goullet, F. Nicolazo, A. Granier, G. Turban, In situ ellipsometry and infrared analysis of PECVD SiO 2films deposited in an O2/TEOS helicon reactor, J. Non-Cryst. Solids 216 (1997) 48–54.
[71] H. Juárez, M. Pacio, T. Díaz, E. Rosendo, G. Garcia, A. García, F. Mora, G. Escalante, Low temperature deposition: properties of SiO2 Tilms from TEOS and ozone by APCVD system, J. Phys. Conf. Ser. 167 (2009) 1–6, https://doi.org/10.1088/1742-6596/167/1/012020.