DOCTORAT DE L'UNIVERSITÉ DE TOULOUSE
Délivré par :Institut National Polytechnique de Toulouse (INP Toulouse) Discipline ou spécialité :
Génie des Procédés et de l'Environnement
Présentée et soutenue par :
M. AHMED JARRAY le mardi 3 novembre 2015
Titre :
Unité de recherche : Ecole doctorale :
MESOSCOPIC MODELING, EXPERIMENTAL AND THERMODYNAMIC
APPROACH FOR THE PREDICTION OF AGGLOMERATES
STRUCTURES IN GRANULATION PROCESSES
Mécanique, Energétique, Génie civil, Procédés (MEGeP)
Laboratoire de Génie Chimique (L.G.C.) Directeur(s) de Thèse :
M. VINCENT GERBAUD M. MEHRDJI HEMATI
Rapporteurs :
M. BERNARD ROUSSEAU, UNIVERSITE PARIS 11
M. KHASHAYAR SALEH, UNIVERSITE DE TECHNOLOGIE DE COMPIEGNE Membre(s) du jury :
1 M. KHASHAYAR SALEH, UNIVERSITE DE TECHNOLOGIE DE COMPIEGNE, Président
2 M. MEHRDJI HEMATI, INP TOULOUSE, Membre
2 M. MOHAMED BENALI, UNIVERSITE DE TECHNOLOGIE DE COMPIEGNE, Membre
iii
Le procédé de granulation en voie humide nécessite l'ajout d'un agent d’enrobage ou liant, typiquement composé d'agents tensioactifs, d'eau, de plastifiant et de charge hydrophobe. Cependant, dans les procédés de granulation en voie sèche, l'agent d’enrobage est ajouté sous la forme de fines particules solides. L’objectif de ce travail est double : d’une part, examiner le comportement des particules dans les systèmes secs et aqueux aux échelles microscopique et mésoscopique, et d’autre part, développer des méthodologies prédictives permettant de choisir le liant adéquat et formuler la bonne solution d’enrobage. Dans le cadre de cette étude, nous avons utilisées l'hydroxypropyl-méthylcellulose (HPMC) et la cellulose d'éthyle (EC) comme agents d’enrobage, polyvinylpyrrolidone (PVP) et la cellulose microcristalline (MCC) généralement utilisés comme liants, l'acide stéarique (SA) qui est une charge hydrophobe, et le polyéthylène glycol (PEG) comme plastifiant. Tous ces matériaux sont largement utilisés dans les industries alimentaires et pharmaceutiques.
La réussite d’une granulation dépend de l’affinité entre les particules primaires et le liant. Afin de prédire l'affinité liant-substrat en milieu sec et en milieu aqueux, nous avons comparé deux approches; la première est basée sur le travail de l'adhésion alors que la seconde s’appuie sur le concept de résistance à la traction idéale. L’équation de résistance à la traction idéale a été étendue aux systèmes ternaires dans le but de l’appliquer pour la granulation en milieu aqueux. Les approches développées ont été ensuite confrontées aux données expérimentales sur différent systèmes (composées de PVP, MCC, HPMC, SA, EC, PEG et l'eau). Nous avons ainsi trouvé que l’approche basée sur le travail d'adhésion semble donner de meilleures prédictions des affinités. Les deux approches prédisent que le HPMC est un bon liant pour le MCC. Les résultats indiquent également que le PEG a une bonne affinité avec le HPMC et le SA.
Nous avons ensuite étudié la structure des agglomérats formés dans les formulations colloïdales utilisées dans les procédés d’enrobage. Pour ce faire, nous nous sommes appuyés sur des analyses expérimentales et des simulations mésoscopiques. Ces dernières reposent sur l’utilisation de la méthode de dynamique des particules dissipatives (DPD) dans laquelle les composés sont décrits comme un ensemble de billes souples (approche « coarse-grain ») interagissant selon le modèle de Flory-Huggins. Les interactions répulsives entre les billes ont été évaluées en utilisant le paramètre de solubilité (δ) calculé par simulation moléculaire tout-atome. Les résultats de simulation DPD ont été comparés aux résultats expérimentaux obtenus par plusieurs voies : cryogénique-MEB, analyse de distribution de taille de particule et par la technique DSC. Les résultats de la simulation DPD montrent que le polymère HPMC est un meilleur agent stabilisant pour le SA que le PVP et le MCC.
iv
est incapable de stabiliser les particules de SA lorsque celles-ci sont en quantités élevées (supérieurs à 10% (w/w)). Nous constatons également que le PEG se diffuse à l'intérieur des chaînes de HPMC entrainant l’extension de ce dernier, formant ainsi un polymère composite lisse. Les résultats expérimentaux montrent des tendances similaires; l’analyse de la distribution de taille de particule indique qu’en présence de HPMC, pour de faible pourcentages de SA (au-dessous de 10% (w/w)), la majorité des particules de SA sont inférieures à 1 µm de diamètre. Les images MEB révèlent que HPMC entoure les cristaux de SA avec un film texturé et ancre sur leur surface.
Mots clés
v
Wet granulation process requires the addition of a coating agent or binder, typically composed of surfactants, water, plasticizers and fillers. In dry granulation however, the coating agent is added to the system in the form of fine solid particles. Our goals are to investigate the particles behaviour and agglomeration mechanism in dry and aqueous systems at the micro and meso scales, and also, to develop predictive methodologies and theoretical tools of investigation allowing to choose the adequate binder and to formulate the right coating solution. In this study we chose materials widely used in food and pharmaceutical industries, including; coating agents such as Hydroxypropyl-methylcellulose (HPMC) and Ethyl cellulose (EC), binders such as Polyvinylpyrrolidone (PVP) and Microcrystalline cellulose (MCC), hydrophobic filler such as Stearic acid (SA) and plasticizer such as Polyethylene glycol (PEG).
A successful granulation requires good affinity between host and guest particles. In this context, in the first part of this work, two approaches to predict the binder-substrate affinity in dry and in aqueous media were compared; one based on the work of adhesion and the other based on the ideal tensile strength. The concept of ideal tensile strength was extended to ternary systems and applied for granulation in aqueous media. The developed approaches were thereafter tested for various systems (composed of PVP, MCC, HPMC, SA, EC, PEG and water) and compared to experimental observations. Approaches yielded results in good agreement with the experimental observations, but the work of adhesion approach might give more accurate affinity predictions on the particles affinity than the ideal tensile strength approach. Both approaches predicted that HPMC is a good binder for MCC. Results also indicated that PEG has a good affinity with HPMC and SA.
In a second part of our work, we used mesoscale simulations and experimental techniques to investigate the structure of agglomerates formed in aqueous colloidal formulations used in coating and granulation processes. For the simulations, dissipative particle dynamics (DPD) and a coarse-grained approach were used. In the DPD method, the compounds were described as a set of soft beads interacting according to the Flory-Huggins model. The repulsive interactions between the beads were evaluated using the solubility parameter (δ) as input, where, δ was calculated by all-atom molecular simulations. The mesoscale simulation results were compared to experimental results obtained by Cryogenic-SEM, particle size distribution analysis and DSC technique. According to the DPD simulations, HPMC polymer is a better stabilizing agent for SA than PVP and MCC. In addition, HPMC is able to cover the SA germ with a thick layer and to adsorb in depth into its inner
vi
HPMC chains thereby extending and softening the composite polymer. Experimental results presented similar trends; particle size distribution analysis showed that in the presence of HPMC, for low percentages of SA (below 10% (w/w)), the majority of SA particles are below 1 µm in diameter. SEM images revealed that HPMC surrounds SA crystals with a hatching textured film and anchors on their surface.
Keywords
vii
This work is the result of three years of research efforts during my Ph.D. studentship. Of course, most of such work would have not been possible without the support of many people that I wish to thank.
First of all, I wish to express my deep and sincere gratitude to my supervisors Prof. Gerbaud Vincent and Prof. Hemati Mehrdji for inviting me to this exiting journey into the realm of granulation science and molecular simulation. Without their knowledge, enthusiasm and encouragement, this thesis would not have been possible.
I wish to express my appreciation to Prof. Khashayar Saleh and Prof. Bernard Rousseau, the reviewers of the thesis, for their constructive comments and remarks on the manuscript. My gratitude goes also to Dr. Mohammed Benali for accepting to examine my work, and I am grateful for his achievements during his thesis back in 2006, from which the work described in this thesis followed. I am most grateful to Dr. Yaocihuatl Medina Gonzalez for her fruitful interaction within my research work. My gratitude goes also to Dr. Fabien Laboulfie for helping me in the experimental part of this thesis.
I thank Bruno Payres and Yves Martinez from CMEAB for their co-operation in the field of cryogenic electron microscopy, and for their helpful advice and suggestions.
Special thanks to Dr. Pierre Yves Pontalier for his support and encouragement.
I also thank Federico Senior Arenas for his positive view on all aspects of life and for his encouragement from the beginning of my thesis.
A warm thanks to my dear Sabrina for being there with me during the most difficult times when writing this thesis; especially during the weekends, she gave me the moral support and she even cooked for me!
I wish especially to thank Alain Philip for his amazing help and encouragement at all time. Thank you for being there for both me and all the others Ph.D. students.
I also thank Ivonne for her friendship. She was a never-ending source of encouragement and motivation.
viii
I also like to thank Roanna guldor for the support and patience as well as for discussing science and other issues.
A special acknowledgement goes to my office mate of many years: Stephane. He is an amazing person in too many ways. And I also thank Jesus and Yasmina, other great office mates who have been supportive in every way.
I would like to acknowledge friends at LGC who supported me during my time here. First and foremost, I would like to thank Sofea; a great and kind person, Philip; my favorite specimen, Rihab; my compatriot, Shahineze; my second compatriot, Segolene; my movie companion, Didier; my buddy (thanks for the dancing moves!). Also, I thank Rene, Antonio, Imane, Jawher, Omar, Anh, Sayed, Lucile, Marco, Natascha, Sara, You, Emanul, Benoit, Guillaume x 2, Laszlo, Martial, Natalia, Juan, Antoine, Pierre, Mylène and Mathieu for the pleasant atmosphere at work and for having lots of fun. My warmest thanks belong to my parents for their loving and unconditional support and encouragement. Their unwavering faith and confidence in me is what has shaped me to be the person I am today, so, thank you.
To anyone that may I have forgotten. I apologize. Thank you as well.
ix
Acknowledgments ... vii
General Introduction ... 1
1 Background and Motivations ... 3
1. Introduction ... 3 2. Granulation process ... 4 2.1. Dry granulation ... 4 2.2. Wet granulation ... 5 2.3. Agglomeration mechanism ... 5 2.4. Coating mechanism ... 8 2.5 Bonding mechanisms ...10 3. Coating formulation ...11 3.1. Colloids ...12 3.2. Colloidal stability ...13 3.3. Film formers ...15 3.4. Plasticizers ...16 3.5. Fillers ...17
4. Computational methods in granulation process ...17
5. Conclusion and general objectives ...19
2 Materials and experimental characterization techniques ... 21
1. Introduction ...21
2. Materials ...21
2.1 Polyvinylpyrrolidone (PVP) ...23
2.2 Microcrystalline cellulose (MCC) ...23
2.3 Hydroxypropyl methylcellulose (HPMC) ...24
2.4 Stearic acid (SA) ...25
2.5 Polyethylene glycol (PEG) ...26
2.6 Ethylcellulose (EC) ...26
2.7 Niflumic acid (NA) ...27
3. Equipment and analysis instruments...27
3.1 Ultra-Turrax disperser for coating preparation ...27
x
3.5 Differential scanning calorimetry (DSC) ...32
4. Preparation protocol of the suspensions ...33
5. Conclusion ...34
3 Aqueous coating formulation: experimental characterization ... 37
1. Introduction ...37
2. Behavior of HPMC, PEG and SA during coating preparation ...38
3. Colloid stability ...40
4. Experimental results ...41
4.1 Particle size distribution ...42
4.2 Cryogenic-SEM results ...47
4.3 DSC results ...55
5. Conclusion ...59
4 Solubility Parameter (δ) and COSMO’s σ-profiles ... 61
1. Introduction ...61
2. COSMO, DFT and σ-profiles ...62
3. The Solubility parameter δ ...64
4. Calculation methods of the Solubility parameter δ ...66
4.1. Experimental methods ...66
4.2 Group Contribution methods and HSPiP ...67
4.3. Molecular Simulation ...68
5. Computational details and methods ...75
5.1 COSMO and DFT ...75
5.2 Molecular simulations ...76
6. Results and discussion ...76
6.1 σ-profiles ...76
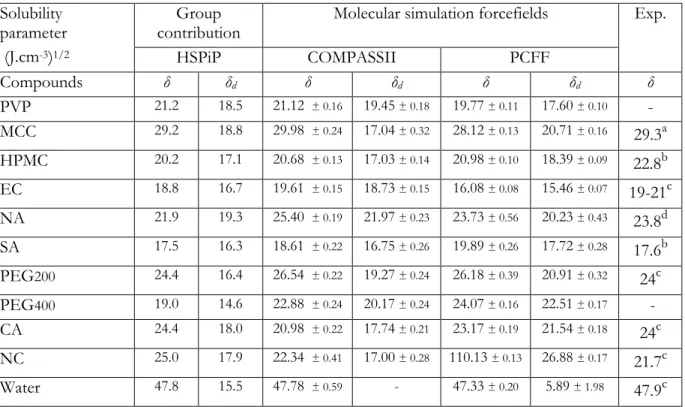
6.2 Solubility parameter calculated by different methods ...79
7. Conclusion ...82
5 Prediction of solid - binder affinity in dry and aqueous systems ... 83
1. Introduction ...83
2. Theoretical models and equations ...84
2.1. Contact angle and surface free energy ...84
xi
3.1. Generalization of the work of adhesion and tensile strength formula ...91
3.2. Extension of the ideal tensile strength model to ternary systems ...92
4. Model application and discussion ...94
4.1. Relationship between solubility parameter and surface free energy for cellulose derivatives ...94
4.2. Prediction of the interactions in binary mixture ...96
4.3. Prediction of the interactions in aqueous system: dispersion of substrate in a third medium .... 100
5. Conclusion ... 105
6 Dissipative particle dynamics simulation of composite coating solutions ... 107
1. Introduction ... 107
2. Theory and simulation methods ... 108
2.1. The dissipative particle dynamics (DPD) method ... 108
2.2. The “coarse-grain” modeling ... 110
2.3. DPD parameters calculations ... 112
3. Computational simulation details ... 114
3.1. The mesoscale “coarse-grain” model ... 114
3.2. Molecular dynamic simulation and solubility parameter calculation ... 115
3.3. DPD simulation details ... 117
4. Results and discussion ... 119
4.1. Interfacial energy of polymers ... 120
4.2. Influence of SA concentration on HPMC-SA agglomerate in water ... 120
4.3. Influence of the polymer nature on the SA based coating ... 127
4.4. Effect of plasticizer (PEG400) on aqueous polymeric dispersions structure ... 129
4.5. Structure factor, diffusivity coefficient and end-to-end distance ... 132
5. Conclusion ... 138
General conclusion and perspectives ... 139
References ... 145
xiii
Table 2.1 – Relevant functional category of the material studied throughout this study. Data collected
from Rowe (2009) and other literatures presented under this table... 22
Table 2.2 – Solubility parameter, surface free energy and density found in the literature. ... 22
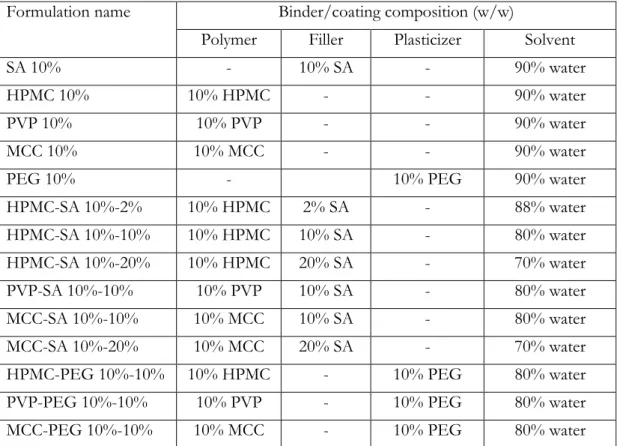
Table 2.3 – Composition of the different formulation studied throughout this thesis. ... 34
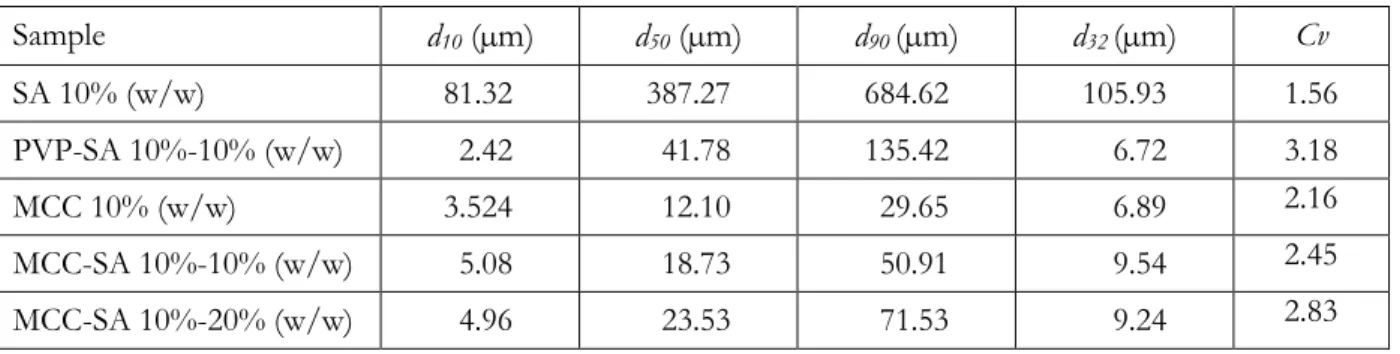
Table 3.1 – Granular properties in volume of the dispersions. ... 44
Table 3.2 – Granular properties in number of the dispersions. ... 44
Table 3.3 – Granular properties in volume of the dispersions. ... 46
Table 3.4 – Granular properties in number of the dispersions. ... 46
Table 3.5 – Melting temperature (Tm) and melting enthalpy (∆Hm) ... 58
Table 4.1 – Solubility parameters calculated by different methods. ... 80
Table 4.2 – Hansen solubility parameter components calculated by HSPiP. ... 81
Table 5.1 – Work of cohesion in mJ.m-2 calculated using different correlations ... 96
Table 5.2 – Cohesion work (diagonal) and adhesion work in mJ.m-2 in the binary mixture calculated using the solubility parameter obtained from COMPASSII forcefiled. ... 96
Table 5.3 – Cohesion work (diagonal) and adhesion work in mJ.m-2 in the binary mixture calculated using the solubility parameter obtained from HSPiP method. ... 97
Table 5.4 – The ideal tensile strength in binary mixtures in J.cm-3 calculated using the solubility parameter obtained from COMPASSII forcefiled ... 97
Table 5.5 – The ideal tensile strength in binary mixtures in J.cm-3 calculated using the solubility parameter obtained from HSPiP method. ... 98
Table 5.6 – Interactions predicted for PVP and MCC ... 98
Table 5.7 – Interactions predicted for HPMC and EC ... 98
Table 5.8 – Interactions predicted for NA and SA... 99
Table 5.9 – Interactions predicted for PEG200 and PEG400 ... 99
Table 5.10 – Cohesion work (diagonal) and adhesion work in mJ.m-2 of the compounds dispersed in water, calculated using the solubility parameter obtained from COMPASSII and PCFF forcefileds.100 Table 5.11 – Cohesion work (diagonal) and adhesion work in mJ.m-2 of the compounds dispersed in water, calculated using the solubility parameter obtained from HSPiP. ... 101
Table 5.12 – The ideal tensile strength in ternary mixtures in J.cm-3 of the compounds dispersed in water, calculated using the solubility parameter obtained from COMPASSII and PCFF forcefileds.101 Table 5.13 – The ideal tensile strength in ternary mixtures in J.cm-3 of the compounds dispersed in water, calculated using the solubility parameter obtained from HSPiP method ... 101
xiv
Table 5.16 – Interactions predicted for NA and SA ... 103
Table 5.17 – Interactions predicted for PEG200 and PEG400 ... 103
Table 6.1 – Solubility parameter and density of repeating units and molecules. ... 116
Table 6.2 – Conversion of monomer and molecules into beads, and properties of the beads. ... 116
Table 6.3 – DPD number nDPD of PVP, MCC and HPMC, calculatedusing equation (6.20) ... 117
Table 6.4 – The conservative force parameters aij and aii obtained by using Groot and Warren’s (1997) equations (6.12) and (6.13). ... 118
Table 6.5 – The conservative force parameters aij and aii obtained by using Travis et al. (2007) equations (6.16) and (6.18). ... 118
Table 6.6 – interfacial energy results obtained by DPD simulations and compared with experimental values. ... 120
xv
Fig. 1.1 - Typical dry granulation methods (Salman, 2007). ... 4 Fig. 1.2 – Agglomeration and coating mechanism. ... 6 Fig. 1.3 – Distribution and immersion mechanisms. ... 7 Fig. 1.4 – Examples of equipment used in film coating process, adapted from McGinity and Felton (2008). ... 9 Fig. 1.5 – Bonding mechanisms in granulation process ... 10 Fig. 1.6 – a) Image of a stable suspension of clay particles observed in dark field optical microscopy, b) A small amount of salt was added. Clays dispersed particles form aggregates. The suspension is destabilized. Images are taken from Van Olphen (1963). ... 12 Fig. 1.7 – Colloidal instability; through sedimentation (on the right), and through flocculation (on the left). ... 13 Fig. 1.8 – Illustration of the DLVO potential and all its components (Lucio, 2007) ... 14 Fig. 1.9 – Schematic representation of typical film formation mechanism from aqueous polymer dispersions, and plasticizer effect on release mechanism. ... 16 Fig. 1.10 – Multiscale modeling in granulation process. Figure adapted from Cameron (2005), Chipot (2003) and Sutmann (2009). ... 18 Fig. 2.1 – Structural formula of Polyvinylpyrrolidone (PVP) and SEM image of PVP’s (Povidone K-30) dry powder (Rowe, 2009). ... 23 Fig. 2.2 – Structural formula of Microcrystalline cellulose (MCC) and SEM image of MCC’s (Avicel PH-102) dry powder (Rowe, 2009). ... 24 Fig. 2.3 – Structural formula of Hydroxypropyl methylcellulose (HPMC) and SEM image of HPMC’s (Methocel E5) dry powder (Rowe, 2009). ... 25 Fig. 2.4 – Structural formula of Stearic acid (SA) and SEM image of SA’s dry powder (Rowe, 2009). 25 Fig. 2.5 – Structural formula of Polyethylene glycol (PEG). ... 26 Fig. 2.6 – Structural formula of Ethylcellulose (EC) and SEM image of EC’s dry powder (Rowe, 2009)... 27 Fig. 2.7 – Structural formula of Niflumic acid (NA). ... 27 Fig. 2.8 – Ultra-Turrax disperser; a) Ultra-Turrax motor, b) Ultra-Turrax axe composed of rotor and stator, c) dispersion of particles in between the rotor and the stator, adapted from Renouf (2000). ... 28 Fig. 2.9 – CAMAG handcoater. ... 28 Fig. 2.10 – Cryogenic-SEM instruments; a) Hitachi MEB ESEM Quanta 250 FEG FEI, b) Leica EM GP. ... 30 Fig. 2.11 – Typical examples of particle size distributions. ... 32
xvi
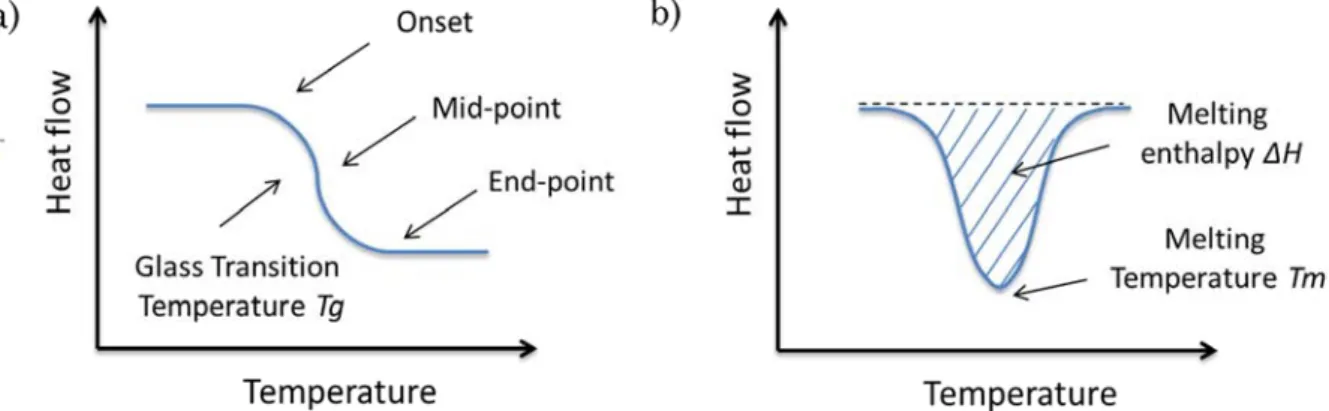
Fig. 2.13 – Schematic DSC curves; a) Determination of glass transition temperature Tg, b)
Determination of melting temperature Tm. ... 33 Fig. 3.1 – Wet particle growth mechanisms. ... 38 Fig. 3.2 – Film formation during the evaporation phase. Figure adapted from Onions (1986). ... 39 Fig. 3.3 – Coating preparation steps of HPMC-SA-PEG1500 mixture placed in water, HPMC:
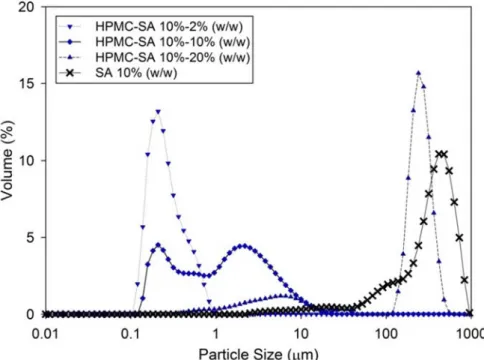
Hydroxypropyl-methylcellulose, SA: Stearic acid, PEG1500: Polyethylene glycol 1500. ... 39 Fig. 3.4 – Schematic representation of the stabilization of colloidal particles. a) Colloidal particles agglomerate in water, b) Colloidal particles stabilized in water by a polymer. ... 40 Fig. 3.5 – Appearances of a) Pure SA 10%, b) Pure HPMC 10%, c) Pure MCC 10%, d) Pure PVP 10%, e) HPMC-SA 10%, f) MCC-SA 10%, g) PVP-SA 10%, h) HPMC-PEG 10%-10%, i) MCC-PEG 10%-10%-10%, j) PVP-PEG 10%-10%-10%, all the mixtures weight percentages. ... 41 Fig. 3.6 – Particle size distribution in volume of HPMC-SA under different percentages of SA. HPMC: Hydroxypropyl-methylcellulose, SA: Stearic acid. ... 43 Fig. 3.7 – Particle size distribution in number of HPMC-SA under different percentages of SA. HPMC: Hydroxypropyl-methylcellulose, SA: Stearic acid. ... 43 Fig. 3.8 – Particle size distribution in volume of pure SA, pure MCC, HPMC-SA, PVP-SA and MCC-SA in water. HPMC: Hydroxypropyl-methylcellulose, PVP: Polyvinylpyrrolidone, MCC:
Microcrystalline cellulose, SA: Stearic acid. ... 45 Fig. 3.9 – Particle size distribution in number of pure SA, pure MCC, HPMC-SA, PVP-SA and MCC-SA in water. HPMC: Hydroxypropyl-methylcellulose, PVP: Polyvinylpyrrolidone, MCC:
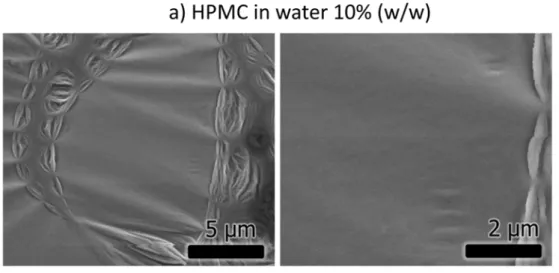
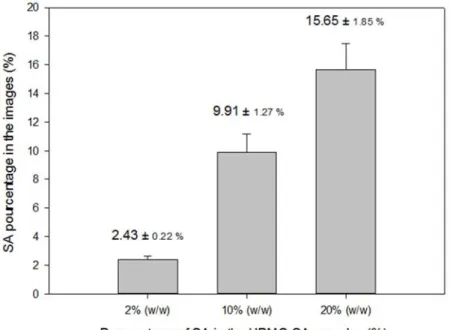
Microcrystalline cellulose, SA: Stearic acid. ... 45 Fig. 3.10 – SEM micrographs of HPMC (top) and SA (bottom) in water before and after sublimation, cryofixated using pasty nitrogen. HPMC: Hydroxypropyl-methylcellulose, SA: Stearic acid. ... 47 Fig. 3.11 – SEM micrographs of HPMC-SA in water (10%-10% (w/w)). HPMC: Hydroxypropyl-methylcellulose, SA: Stearic acid. ... 48 Fig. 3.12 – Observations using pasty nitrogen freezing, SEM micrographs of HPMC-SA in water under different percentages of SA and taken after sublimation. HPMC:
Hydroxypropyl-methylcellulose, SA: Stearic acid. ... 50 Fig. 3.13 – Observations using liquid ethane as a freezing medium, SEM micrographs of HPMC-SA in water under different percentages of SA and taken after sublimation. HPMC: Hydroxypropyl-methylcellulose, SA: Stearic acid. ... 51 Fig. 3.14 – Observations using high pressure freezing, SEM micrographs of HPMC-SA in water under different percentages of SA and taken after sublimation. HPMC:
xvii
Polyvinylpyrrolidone, SA: Stearic acid. ... 54
Fig. 3.17 – SEM micrographs of MCC-SA in water taken after sublimation. MCC: Microcrystalline cellulose, SA: Stearic acid. ... 54
Fig. 3.18 – DSC curves of PEG 10% (w/w), HPMC 10% (w/w) and HPMC-PEG 10%-10% (w/w). ... 56
Fig. 3.19 – DSC curves of PEG 10% (w/w), HPMC 10% (w/w) and HPMC-PEG 10%-10% (w/w). ... 57
Fig. 3.20 – DSC curves of PEG 10% (w/w), PVP 10% (w/w) and PVP-PEG 10%-10% (w/w). ... 57
Fig. 4.1 – σ-profile of water ... 64
Fig. 4.2 – 3D representation of the Hansen solubility parameters (1967). ... 65
Fig. 4.3 – A molecular dynamics system setup. The simulation box is filled with 10 Hydroxypropyl methylcellulose molecules (in blue) surrounded by 1000 water molecules. The periodic box is surrounded by 3 copies of itself in a molecular dynamics simulation. ... 70
Fig. 4.4 – Pair distribution function of liquid Zirconium, adapted from Hennet et al. (2007) ... 74
Fig. 4.5 – σ-profile of Water, PVP, HPMC, PEG400 ... 77
Fig. 4.6 – Dmol3-COSMO surfaces of HPMC, PVP and PEG400. ... 77
Fig. 4.7 – σ-profile of Water, NA, SA and MCC. ... 78
Fig. 4.8 – Dmol3-COSMO surfaces of NA; MCC and SA. ... 79
Fig. 4.9 – Variation of Hildebrand solubility parameter versus number of repetition unit of polymers. ... 80
Fig. 5.1 – Representation of the shape of a liquid droplet placed on a substrate for different contact angles. ... 85
Fig. 5.2 – The influence of contact angle θ on nuclei size formed in fluid-bed granulation of lactose/salicylic acid mixtures. Powder contact angle determined by goniometry and percent of lactose of each formulation are given in parentheses (Ennis et al., 1990)... 86
Fig. 5.3 – Definition of the work of adhesion and cohesion for solid and liquid surfaces in vaccum and in athird medium, Figure adapted from Israelachvili (2010). ... 88
Fig. 5.4 – Interactions predicted between particles A and particles B in a third medium C based on the tensile strength approach. ... 94
Fig. 5.5 – Logarithm of the ratio γ/v1/3 plotted against the logarithm of the Hildebrand solubility parameters δ. δ in (cal.cm-3)1/2 and surface tension γ in mJ.m-2. γ and δ of celluloses derivatives are obtained from literature ... 95
Fig. 6.1 – Schematic representation of the coarse-graining of a water molecule. In this case,
ρ
= 3 and Nm = 6, the cut-off distance rc is therefore equal to the length of one side of the cubic cell. ... 110xviii
Hydroxypropyl-methylcellulose (HPMC) and Stearic acid (SA). ... 115 Fig. 6.3 – DPD simulation of HPMC (Hydroxypropyl-methylcellulose, blue, 10%)-SA (Stearic acid, grey, 10%) mixture in water (transparent, 80%)... 121 Fig. 6.4 – Snapshots of DPD simulation at equilibrium state of HPMC-SA (10%-10% (w/w)) mixture in water under different amounts of SA, HPMC: Hydroxypropyl-methylcellulose, SA: Stearic acid. 122 Fig. 6.5 – Distribution of HPMC beads around and through SA agglomerate under different amounts of SA, HPMC: Hydroxypropyl-methylcellulose, SA: Stearic acid. ... 123 Fig. 6.6 – Concentration of HPMC beads Γ( drr, ) as a function of the radial distance from SA agglomerate geometric origin. HPMC: Hydroxypropyl-methylcellulose and SA: Stearic acid. ... 125 Fig. 6.7 – Schematic representation of the distribution functionΓ(r,dr)in relation to the agglomerate structure and size. ... 125 Fig. 6.8 – Snapshots of DPD simulation of PVP-SA, HPMC-SA and MCC-SA in water 10%-10% (w/w) when equilibrium state is reached. PVP: Polyvinylpyrrolidone, MCC: Microcrystalline cellulose, HPMC: Hydroxypropyl-methylcellulose, SA: Stearic acid. ... 127 Fig. 6.9 – Concentration of polymer beads Γ( drr, ) as a function of radial distance from polymer-SA agglomerate geometric center. PVP: Polyvinylpyrrolidone, MCC: Microcrystalline cellulose, HPMC: Hydroxypropyl-methylcellulose and SA: Stearic acid. ... 128 Fig. 6.10 – Distribution of polymer beads (PVP and MCC) around and through SA agglomerate. PVP: Polyvinylpyrrolidone, MCC: Microcrystalline cellulose and SA: Stearic acid. ... 129 Fig. 6.11 – Images of DPD simulation of PVP-PEG400, HPMC-PEG400 and MCC-PEG400 10%-10% (w/w) in water when equilibrium state is reached. PVP: Polyvinylpyrrolidone, MCC:
Microcrystalline cellulose, HPMC: Hydroxypropyl-methylcellulose, PEG: Polyethylene glycol. ... 130 Fig. 6.12 – Distribution of polymer beads (PVP, HPMC and MCC) around and through PEG. PVP: Polyvinylpyrrolidone, MCC: Microcrystalline cellulose and PEG: Polyethylene glycol... 131 Fig. 6.13 – Concentration of polymer beads Γ( drr, )diffused inside PEG agglomerate as a function of radial distance from SA agglomerate geometric center. PVP: Polyvinylpyrrolidone, MCC:
Microcrystalline cellulose, HPMC: Hydroxypropyl-methylcellulose and PEG: Polyethylen glycole. . 132 Fig. 6.14 – Average structure factor S(Q) of HPMC-SA under different percentages of SA. HPMC: Hydroxypropyl-methylcellulose, SA: Stearic acid. ... 133 Fig. 6.15 – Average structure factor S(Q) of stearic acid (SA) agglomerates formed when using
different polymeric compounds, PVP: Polyvinylpyrrolidone, MCC: Microcrystalline cellulose, HPMC: Hydroxypropyl-methylcellulose ... 133 Fig. 6.16 – Evolution of the diffusivity of HPMC, PVP and MCC in the mixtures HPMC-AS, PVP-AS and MCC-PVP-AS (10%-10% (w/w) in water) respectively, as a function of time in DPD units.
xix
Fig. 6.17 – End-to-end distance of HPMC and SA in HPMC-SA mixture. (a) End-to-end distance of the last step of the DPD simulation, (b) Average end-to-end distance as a function of simulation time, each point is averaged over 10 successive steps. ... 135 Fig. 6.18 – End-to-end distance of MCC and SA in MCC-SA mixture. (a) End-to-end distance of the last step of the DPD simulation, (b) Average end-to-end distance as a function of simulation time, each point is averaged over 10 successive steps. ... 136 Fig. 6.19 – End-to-end distance of PVP and SA in PVP-SA mixture. (a) End-to-end distance of the last step of the DPD simulation, (b) Average end-to-end distance as a function of simulation time, each point is averaged over 10 successive steps. ... 137
xx
“Concentrate every minute on doing what’s in front of you with precise and genuine seriousness, tenderly, willingly, with justice. And on freeing yourself from all other distractions. Yes, you can— if you do everything as if it were the last thing you were doing in your life, and stop being aimless, stop letting your emotions override what your mind tells you, stop being hypocritical, self-centered , irritable. You see how few things you have to do to live a satisfying and reverent life? If you can manage this, that’s all even the gods can ask of you. -Marcus Aurelius
1
Granulation is a size-enlargement process during which small particles are formed into larger and physically strong agglomerates (Salaman, 2007). In wet granulation processes, this is performed by spraying a liquid binder onto the particles as they are agitated in tumbling drum, fluidized bed, high shear mixer or similar device (Hemati et al. 2007; Holm, 1997). Coating, on the other hand, is a process which allows to deposit on the surface of particles a thin film layer which can be of different nature: polymers, salts, sugars etc.
These two operations confer on powders new properties for customers, such as hydrophobicity, masking bitterness, reducing the risks of explosion, avoiding the segregation of the constituents, improving the flow properties and the compression characteristics of the mix.
Processes of size enlargement involve the coupling of two classes of parameters. The first class corresponds to the local physico-chemical parameters dependent on the nature of the solutions and powders. The second class corresponds to the parameters of the processes which are the constraints exercised by the process equipment on the bed of powder, such as the temperature and the flow rates. The quality of the end product depends on the control of the coupling between these two families of parameters which exist at different scales. At present, the optimization of these parameters, notably the choice of solvent and binders is based on an empirical, by nature long and expensive approach. In addition, formulating the optimum binder or coating is essential even if suitable operating conditions may bring enough mechanical energy to obtain rigid granules.
Today, important issues in binder formulation and wet granulation process are; a) the assessment of binder-particle interactions in dry and aqueous systems which is experimentally expensive and time consuming, b) the choice of a stabilizing agent which is empirical; an instable dispersion may results in an uncomplet film formation, c) the selection of a suitable plasticizer compatible with the materials that compose the coating film, and d) the structure of agglomerates at the mesoscale level.
In this study we chose materials widely used in food and pharmaceutical industries, including coating agents such as Hydroxypropyl-methylcellulose (HPMC) and Ethyl cellulose (EC), binders such as Polyvinylpyrrolidone (PVP) and Microcrystalline cellulose (MCC), hydrophobic filler such as Stearic acid (SA) and plasticizer such as Polyethylene glycol (PEG).
This thesis is organized in six chapters;
In chapter 1; Background and motivations, we present the context of the study; we give an overview of the granulation process and the coating and binder formulation. We also describe briefly
2
the computational tools used in wet granulation processes. At the end of the chapter, the objectives of the study are listed.
In chapter 2; Materials and experimental characterization techniques, experimental techniques and chosen materials used throughout the study are described.
In chapter 3; Aqueous coating formulation: experimental characterization, we use experimental characterization technique to analyze the structure of aqueous coating formulations. We use particle size distribution analysis to investigate the stability of coating formulations containing Stearic acid and polymers. Cryogenic-SEM technique is used to observe the structure of the coating formulation. Plasticizer-polymer compatibility is also analyzed via DSC.
In chapter 4; Solubility Parameter (δ) and COSMO’s σ-profiles, we describe the methods used for the calculation of the solubility parameter δ and we analyse the σ-profiles of the materials. σ-profiles give insights on the solubility of the different materials in water, and the compatibility between certain polymers. The calculated δ values of each material are used in the next chapter for the prediction of solid-binder interactions.
In chapter 5; Prediction of solid - binder affinity in dry and aqueous systems, we compare two approaches to predict the binder-substrate affinity in dry and in aqueous media, one based on the work of adhesion and the other based on the ideal tensile strength. The equations used in both approaches are generalized and rewritten as a function of the Hildebrand solubility parameter δ. The concept of ideal tensile strength, originally formalized by Gardon (1967) for binary systems, is extended to ternary systems and applied for granulation in aqueous media.
In chapter 6; Dissipative particle dynamics simulation of composite coating solutions, we use dissipative particle dynamics (DPD) to elucidate the structure of aqueous colloidal formulations. The effect of percentage of SA on the structure of the HPMC-SA suspension is investigated. In addition, the stability of SA in the presence of MCC and PVP is examined. Plasticizer-polymer compatibility is also studied. Then, DPD simulation results are compared to the experimental findings obtained in chapter 3.
Several appendixes are presented at the end of the thesis. They provide supplementary details and include the scripts used in molecular and mesoscale simulations.
3
Chapter 1
1
Background and Motivations
“One ultimate goal would be to quantify the behaviour at the micro and meso scales in terms of rates laws, apply them in a conservation statement and then produce a description of the macro behaviour.”
― Agba Salman, Granulation, 2007
1. Introduction
Granulation is a process that transforms crystallized or amorphous powder particles into solid agglomerates more or less strong and more or less porous called granules (Salman, 2007). In wet granulation, a binder (or coating solution) is sprayed on the primary particles to obtain agglomerates or coated particles.
The success of wet granulation process is conditioned by the binder formulation (i.e. the behavior of suspensions when in contact with the primary particles). A good binder (or coating solution) should; (a) be suitable with the primary particles (or granule) onto which they it’ll be pulverized, (b) provide the quality requirements and the expected properties in the final products, and (c) be compatible with the equipment used in the granulation process (e.g. sprayable by the designed turbine).
In granulation process, the particles are attached together by adhesion and cohesion forces. These forces arise from interatomic and intermolecular bonds: Van der Waal forces, electrostatic forces, etc. While two particles may attract each other in vacuum, they may repel each other when placed in a medium (e.g water). In this context, it is important to distinguish between the particles agglomeration that occurs; (i) during the granulation process, and (ii) during binder (or coating) preparation.
This chapter is divided into three parts; in the first part, we describe briefly the granulation process, first in the context of agglomeration mechanism and then in the context of coating mechanism. The second concerns colloid agglomeration and stability. Terms such as colloidal stability, plasticizers and
4
polymer-particle surface adsorption are defined. Finally, we describe briefly the different multi-scale methods and models used for the modeling of granulation and agglomeration mechanisms.
2. Granulation process
The word "granulation” is taken to cover all forms of particle size enlargement processes and not a specific mechanism. "Initial particle" refers to particles charged as raw material in the granulation process before growth takes place, and the word "granule" is used to mean any particle product. Granulation is widely used in the pharmaceutical, agricultural, fertilizer, and mining industries. Granulation includes a number of processes that purposely convert, by a sequence of events, small particles into large permanent masses in which the initial primary units are still identifiable. These granules exhibit better flow characteristics, higher content uniformity and better compressibility in comparison to the ungranulated powder. Granule growth occurs either by the collision and successful adherence of primary feed particles into discrete granules or by growth centered around a nucleus on to witch particles collides and attach themselves to form a layer (Salman, 2007). The obtained granule may, eventually, be made into tablets or a similar compressed compact. Granulation can be categorized into wet granulation and dry granulation.
2.1. Dry granulation
Dry granulation technique does not use a liquid phase and therefore lacks a drying step. Fine particles with sizes of less than several microns are mostly cohesive and are readily agglomerated by exerting pressure on them. This technique utilizes the cohesive characteristics of the particles to form larger granules without using any binders but with pressure by extruding, tumbling and fluidizing powders as shown in Fig. 1.1 (Salman, 2007).
5
Dry granulation major disadvantages are the generation of dust, uncontrollable granule size and irregular granulate properties and therefore it is not considered to be the preferred granulation method (Kleinebudde, 2004; Miller, 2005). Other than the mechanical forces excreted by the dry granulation equipment, the final product is also influenced by the interactions between the raw primary particles. As we will see later in chapter 5, the organization and the structure of the granule in dry granulation can be predicted by analyzing the affinity between the primary particles.
2.2. Wet granulation
The process of wet granulation is brought about when a bed of solid particles moves, with simultaneous intensive mixing, in the presence of a liquid phase. This motion provides particle collisions and individual particles coalesce and bind together (Salman, 2007). This can be done using fluid bed granulators, tumbling drums, shear mixers, or extruders.
In 1958, Newitt and Conway published a paper describing for the first time the binding mechanism in wet granulation. This was the precursor of wet granulation science that opened the path for many other researchers including Israelachvili (2010) who explained the binding forces between the particles in terms of intermolecular and interface forces, Schubert (1975, 1981) who studied the interparticle contact forces and the agglomerate structure by calculating the tensile strength, and Rumpf (1962) who classified the binding mechanisms according to the forces between the granules and proposed a model for relating the strength of agglomerates to the presence of pores.
2.3. Agglomeration mechanism
“The terms agglomerate and aggregate are qualitative and have been interchanged by most researchers for so long that it probably no longer matters how they are used.”
Gary Nichols, 2002. • Agglomerate [from the Latin agglomerare (glomus-meris ball)]. Gathered into a ball or cluster; collected into a mass (Simpson, 1989). Assemblage of particles rigidly joined together, as by partial fusion (sintering) or by growing together (Gregory, 1988)
• Aggregate [from the Latin aggregare held together (grex gregis flock)]. A mass formed by the union of individual particles; an assemblage, a collection (Simpson, 1989). Assemblage of particles which are loosely coherent (Gregory, 1988).
Gerstner (1966) defined both names in terms of the granule structure; soft agglomerate (i.e. friable and readily dispersed granule) would be equivalent to an agglomerate and a hard agglomerate (i.e. strong, non-friable, gritty, and not readily dispersed) would be equivalent to an aggregate. However,
6
as long as there is no way to measure quantitatively the degree of association of particles in an assemblage, it’s difficult to choose between both terms. At the end of their article, Gary and coworkers (2002) proposed that when particles assemblages are described, the term agglomerate is used exclusively. For prenucleation structure, obtained upon association of molecules into macromolecules (that may develop into agglomerate), the term aggregate may be used.
Fig 1.2 schematically shows the mechanisms of agglomeration and coating. The initial step of an agglomeration mechanism is the nucleation where wet particles coalesce and the liquid between them dries to form solid bridges between primary particles and thus forms a primary agglomerate (nuclei) (See Fig. 1.2 (a)). Iveson et al. (2001a) demonstrated that the nucleation formation mechanism depends on the relative sizes of the droplets and of the primary particles. In this context, Schæfer and Mathiesen (1996) suggested that the nucleation stage can be divided into two basic mechanisms: Distribution and Immersion.
7
When the binder droplet is smaller or of comparable size to the primary solid particles, it disperses as a film on the particles surface, and nuclei are formed by successful collision and bridging of particles. This nucleation mechanism is referred to as the distribution mechanism (Fig. 1.3 (a)). In the immersion mechanism, the binder, whose droplet size is larger than the primary particles, represents the core of the agglomerate (Fig. 1.3 (b)). Finally, when the droplet size is identical to that of the particles, the distribution of phenomena and the immersion phenomena may occur concurrently and in balanced manner. It’s worth mentioning here that the immersion-distribution hypothesis assumes that the thermodynamics of the wetting process are favorable which means that the binder will always spread over the powder surface. In addition, the possibility of the solid spreading over the liquid must be included (Hapgood et al., 2009). During the consolidation phase, the agglomeration process is dominated by the mechanical characteristics of the mixer. The consolidation step marks the final stage of a successful agglomerate formation and it affects the mechanical properties of the agglomerates by reducing the size and porosity of the granules and by decreasing their possibilities of deformation, thereby reducing their ability to coalescen after contact.
Fig. 1.3 – Distribution and immersion mechanisms.
Binder choice is important in agglomeration mechanism. Liquid binders can be either aqueous or non-aqueous, although aqueous solutions are more commonly used for safety reasons (Salman, 2007). The binder must have sufficient viscosity to promote agglomeration and growth, but also provide sufficient strength to hold dried granules together in order to avoid breakage as the liquid inter-particle bonds dry during the consolidation stage. Schaefer and Mathiesen (1996) analyzed the effect of viscosity on granulation; they found that the initial growth rate decreases for higher molecular weight of Polyethylene glycol but the subsequent growth rate increases. Eliasen et al. (1998) investigated the effect of binder viscosity on the granulation of lactose and found that a low-viscosity
8
binder reduces the strength of the granules. Similarly, Keningley et al. (1997) found that, depending on the primary particle size, a critical minimum binder viscosity is required to form granules. In another study, it was also found by Johansen and Schaefer (2001) that more spherical granules and an improved binder distribution can be obtained upon reducing the binder viscosity. Overall, increased binder viscosity traduces into an increased average granule size (Salman, 200).
Jaiyeoba and Spring (1980b) studied the effect of wettability of powders, they concluded that granule growth is low if the starting material is poorly wettable. For soluble powder in the binder, Jaiyeoba and Spring (1980a) suggested that the amount of liquid should be reduced accordingly since the amount of powder is lower. Fu et al. (2004) investigated the impact behavior of wet granules; they found that particles restitution decreases upon increasing primary particle size. Simons et al. (2005) studied the effect of binder adhesive strength and the amount of binder captured by the granule and concluded that binder selection should be based on both the dry and wet binder surface energies. Thielmann et al. (2008) investigated the effect of surface properties of primary particles on their agglomeration behaviour in fluidised bed granulation. Hydrophilic particles were found to result into a narrower granule size distribution than hydrophobic ones, however, hydrophobic primary particles grow to larger sizes. Planinšeka et al. (2000) and Zhanga et al. (2002) emphasized on the importance of the wetting kinetics and surface free energy for successful granulation.
Inspired by Ennis’ work (1990, 1991), Benali et al. (2009) proposed the modified capillary number Ca’ to evaluate the importance of the viscous force in binders with respect to the adhesion work. When the Ca’ > 1, the cohesion of dynamic liquid bridges during nucleation and growth becomes greater than that of the static liquid bridges. This is attributed to the effect of viscous energy dissipation. When the Ca’ < 1, the effect of the adhesion force is dominant. Mastering granule processing under the Ca’ > 1 regime is routine for laboratory and industrial practitioners. Mastering the Ca’ < 1 regime requires to select binders adequately. The quality of the final solid products is therefore determined by both the parameters of the processes equipment and the physicochemical properties of the raw materials.
2.4. Coating mechanism
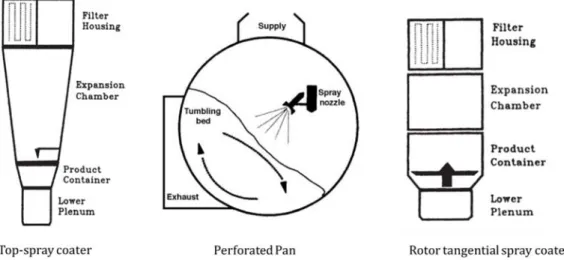
Agglomeration and coating mechanism coexist in wet granulation processes. In the case of coating process, agglomeration mechanism is a parasitic phenomenon which should be minimized in the process. Specific coating equipment and optimal processing conditions are essential to ensure that an equal amount of coating solution is distributed evenly on the surface of the particles; some well-known coating equipment are given in Fig. 1.4. The coating process involves the covering of particulate materials including seeds, agglomerates, pellets and powders with a surrounding layer of a
9
coating agent (or coating material) (Salman, 2007) (See Fig. 1.2 (b)). Coating occurs when wet particles are dried before a collision with other particles takes place or when the mechanical forces exerted by the wet granulation equipment can break the bonds between the particles. During the film-coating process, formation of an acceptable layer of film on the substrate requires the followings (McGinity and Felton, 2008):
1. Formation of appropriate-size droplets, 2. Contact of these droplets with the substrate, 3. Spreading and coalescence of the droplets, 4. Evaporation of the solvent.
The macroscopic properties of the coated granule depend on the properties of the constituent phases of the coating agent, the coating-granule affinity interactions, and the texture of the coating and surface appearance (Salman, 2007). It’s important to avoid sedimentation or coagulation of the coating solution prepared by dispersion; otherwise, uncompleted film formation may occur (Lehmann, 1982). Iley (1991) demonstrated that bigger particles capture more coating than smaller particles during the coating of poly-distributed particles in a fluidized bed. In another study, Smith and Nienow (1982) concluded that the formation of coated particles depends also on the strength of the bond holding the particles. Saleh et al. (2003) Studied the effects of particle size on coating characteristics and showed that both growth rate and efficiency increase with decreasing the particle size. Poor spreading of the coating on the surface of particle can lead poor or incomplete coating film formation. Khoufech et al. (2015) showed that impact speed increases the maximum extent of spreading of the droplet on hydrophobic surfaces and adding CarboxyMethylCellulose sodium salt into water induces splashing and rebound inhibition.
Fig. 1.4 – Examples of equipment used in film coating process, adapted from McGinity and Felton (2008).
10
2.5 Bonding mechanisms
Whether it is a coating or agglomerate, the bonding mechanisms in wet granulation that determines the structure of the granule can be divided into two categories (Ormos, 1994; Rumpf, 1958) (see Fig. 1.5):
Bonding mechanisms in the presence of a binding material:
• Solid bridges, created by transfer of material (chemical reaction, recrystallization of dissolved substances, partial melting, contact fusion by sintering, solidification of high viscous bond agents),
• Quasi-liquid bridges with low or limited mobility generated by macromolecules or high viscous polymers that form strong bonds equivalent in strength to the solid bridges,
• Bonds due to mobile liquid (liquid bridges) and created by capillary forces or surface tension.
Bonding mechanisms without material bridges:
• Van der Waals, electrostatic forces and magnetic forces.
• Mechanical interlocking due to the shape and roughness of the particle surface.
11
Bonding mechanisms involves the simultaneous interactions of many molecules (Israelachvili, 2010), and they become particularly severe when dealing with short-range interactions that determine, for example, adhesion and bonding forces. At the beginning of the granulation process, the particles are generally of low size and contain only marginal amounts of water. This small amount of binder does not create liquid bridges between the particles. At this stage of granulation, the forces of Van der Waals or electrostatic origin are dominant.
In every situation involving a substrate and a binder or coating, the combination of adhesion and cohesion determines the overall bonding effectiveness, and thus, governs the agglomerate growth mechanism and the coating efficiency. Adhesion and cohesion forces between a liquid and a solid depend on the liquid surface tension and liquid-solid contact angle.
Binder selection is empirical and time consuming,
It's difficult to experimentally asses the affinity between the primary particles, and between the primary particles and the binder,
Models for solid-binder affinity in aqueous systems are unavailable.
3. Coating formulation
“A product based on organic binders, which when applied to a substrate produces a cohesive, virtually water-impermeable, protective and possibly decorative film, is called a coating material.”
Thomas Brock, European Coatings Handbook, 2010. Coatings generally consist of mixtures of various raw materials that are added to confer or enhance specific properties to the final product. Typically, a coating solution is composed of water, film forming polymer, stabilizing agent, filler and plasticizer.
One of the important issues regarding the aqueous coating process is the stability of the aqueous dispersion. An instable dispersion results in the agglomeration of the colloidal particles as a result of the van der Waals attraction. This attractive energy becomes very large at short distances between the colloidal particles and may lead to coagulation or sedimentation, thereby affecting the film coating properties and eventually the granulation process. For aqueous coating formulation to be successful, stable colloidal suspensions should be obtained.
12
3.1. Colloids
“Watching and measuring the motion of colloidal particles had made the world of molecules finally tangible“ Jean Baptiste Perrin, Les atomes, 1913. Historically, it was the theory of Albert Einstein (1926) on Brownian motion and the experiments of Jean Baptiste Perrin (1913) on gum colloids that laid the foundations of modern colloid physics, which in fact opened the path to soft matter science.
A particle suspension in a liquid medium (e.g. water) is called colloidal when the particles are large enough to present a structure and small enough to be submitted to Brownian motion. Their size range is typically between 10 nm and several microns. As an example, glues and gels are colloids that form in solution called colloidal suspensions.
The thermal motion in a liquid is responsible for the constant motion of the mesoscopic particles and the motor of the Brownian motion in a colloidal suspension. Because of it, particles jiggle around randomly by collisions; they bounce and separate again after the shock. As shown in Fig. 1.6, the structure of the dispersed particles changes when a small amount of salt is added to the dispersion. Small particles stick to each other after collision, and agglomerates are formed (Fig. 1.6 (b)), resulting in the reduction of the total number of dispersed particles. This phenomenon is called coagulation, flocculation or destabilization and may lead to phase separation.
Fig. 1.6 – a) Image of a stable suspension of clay particles observed in dark field optical microscopy, b) A small amount of salt was added. Clays dispersed particles form aggregates. The suspension is
destabilized. Images are taken from Van Olphen (1963).
A schematic presentation of colloidal instability and the subsequent mechanisms is shown in Fig. 1.7. Flocculation (or agglomeration in a suspension) is a reversible phenomenon; it is a process of contact and adhesion whereby the particles form larger clusters. The coagulation is a much denser form of
13
flocculation. Sedimentation is the tendency of particles in the suspension to decant the fluid (see Fig. 1.7).
Fig. 1.7 – Colloidal instability; through sedimentation (on the right), and through flocculation (on the left).
3.2. Colloidal stability
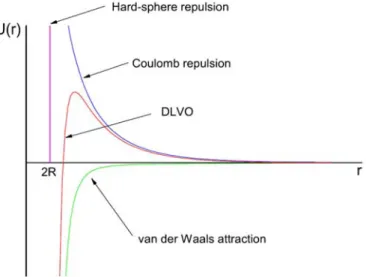
A colloidal dispersion is said to be stable when the colloidal particles remains dispersed over a long time scale (i.e. the total number of particles remains constant over time). Colloidal suspensions behavior is determined by the interactions between the particles. On one hand, we have the attractive interactions of van der Waals and the Brownian movement which are at the origin of the flocculation of the particles. On the other hand, we have the repulsive interactions between particles that ensure kinetically stable suspensions. There are basically two types of repellents colloids. The first type consists of charged colloids in aqueous phase. This repulsion results from electrostatic repulsion forces acting between the surfaces of the particles. The sum of the attractive interaction of van der Waals forces and the repulsive electrostatic interaction is known as the DLVO interaction (Derjaguin, 1941; Verwey, 1948). Fig. 1.8 shows the sum of the two aforementioned interaction potentials
14
resulting in the Derjaguin-Landau-Verwey-Overbeek (DLVO) potential. It highlights the existence of an energy barrier that will moderate the kinetic energy of the two colliding particles.
Fig. 1.8 – Illustration of the DLVO potential and all its components (Lucio, 2007)
The second type of repulsion, and most important for us, is encountered between colloids whose surface is covered by non-charged polymers. Under the presence of a good solvent, the adsorbed polymer forms a barrier that keeps the colloidal particle dispersed. As we will see later, the concentration of the adsorbed polymers, which give insights on the effectiveness of the stabilizing polymer agent, can be assessed by a numerical method.
The role of polymers in the stabilization process during coating solution preparation can be classified into two phases; (a) the initial dispersion of the particles in the medium (normally with shear) and (b) the stabilization of that dispersion (without shear) (Vincent, 1974). The protective action by an adsorbed polymer layer is now generally referred to as “steric stabilization”, steric stabilization acts essentially by preventing the approach of the particle cores to a separation where their mutual van der Waals attraction would be sufficient for aggregation to occur (Vincent, 1974).
Polymeric steric stabilization against aggregation requires that the solid particle provides an adsorbing substrate for the polymer and that the polymer is irreversibly adsorbed (Gregory, 1978). Much emphasis has been placed on the thickness of the adsorbed layer that confers to the particles a barrier against agglomeration. In this context, Koelmans and Overbeek (1954) suggested that only if the thickness of the adsorbed layer was comparable in size to the diameter of the dispersed particles could a polymeric steric mechanism provide sufficient protection. Albers and Overbeek (1960) later modified this suggestion. As a result of their work on water/oil emulsions, it was shown that the van der Waals inter-particle attraction forces had been greatly over-estimated in the earlier work. In the
15
same context, Walbridge and Waters (1966) showed that the minimum steric barrier thickness required for the largest particles was of the order of 5 nm. Finally, some recent experiments by Crow and Malati (1966) indicated the importance of good anchoring of the polymer on the surface of the colloid particles in the stabilizing process.
Another type of colloid Stabilization is called the electro-steric stabilization which, as its name indicates, combines electrostatic and steric effects to avoid re-agglomeration of the particles where a charged organic compound is adsorbed to the particle surface (Fritz, 2002).
Coating formulation is a complex issue and selection of suitable stabilizing agents is expensive and time consuming,
Mesoscale models for particle agglomeration and polymer adsorption in aqueous dispersions are unavailable,
Microscopic SEM observation of agglomerate structure and colloids in a polymeric dispersion are unavailable.
3.3. Film formers
In general, film formers are organo-chemical macromolecule-forming substances which polymerize and form crystalline or amorphous continuous structure as the coating dries. The role of the film former is to form a cohesive coating film on a given substrate and – where relevant – to hold together the components of the coating (Brock et al., 2010). Film formation is the result of the increase in polymer concentration in the colloidal dispersion, leading to the formation of a three dimensional network.
The formation of a polymeric film arises from the ‘coalescence’, i.e. deformation, cohesion and polymer chain interdiffusion, of the individual colloidal particles normally held apart by stabilizing forces (Steward et al., 2000). Evaporation of the interstitial water upon drying leads to the deformation of the particles of polymer until complete coalescence (Fig. 1.9). This mechanism requires sufficient colloidal stability to form close packing upon coalescence; otherwise, poor film may be obtained. Film formation process also requires the spreading of the solution into a thin-layer. Keddie et al. (1995, 1996) demonstrated that voids could remain in the film during film formation even after water evaporation. According to Spitael and Kinget (1980), the formation of a gel was the most important stage of solvent-cast film formation.
16
Fig. 1.9 – Schematic representation of typical film formation mechanism from aqueous polymer dispersions, and plasticizer effect on release mechanism.
The obtained film must be smooth and uniform, or, typically, film coating prepared from pure polymer tends to be brittle and crack upon drying. To overcome this problem, one way is to add a plasticizer to the coating solution.
3.4. Plasticizers
For polymers with limited film-formation ability, a plasticizer may be added to ease the deformation and to favor colloidal particles coalescence. The plasticizer partially eliminates the interactions responsible of the mechanical cohesion between the chains, and therefore increases their mobility. As a consequence, the rigid material is transformed into soft and flexible material (Cole, 1995). Plasticizers reduce the glass transition temperature Tg and the minimum polymer film forming temperature (MFT) at levels that depends on the coating process. Plasticizers also create channels through which drug diffuses for pellets coated with insoluble films (Ozturk et al., 1990) (Fig. 1.9). A good choice of a plasticizer depends on its compatibility with the polymer and on the permanence of the plasticizer in the film during coating. High compatibility between a polymer and a plasticizer produces stable and homogeneous coating. It’s characterized by a high miscibility between the plasticizer and the polymer. However, polymer-plasticizer incompatibility influences not only the mechanical properties, but also drug release (Amighi and Moes, 1996; Arwidssonet al., 1991). Permanence of a plasticizer means its tendency to remain in the plasticized material; i.e. long term compatibility, it depends on the size of the molecule and on its rate of diffusion.
Bodmeier and Paeratakul (1994, 1997) studied the distribution of plasticizers between the aqueous phase and colloidal polymeric dispersions. They also studied the factors influencing the rate of diffusion of plasticizer through the polymer. For optimal mixing between the plasticizer and the
17
polymeric dispersion, Bodmeier and Paeratakul recommended the introduction of insoluble plasticizer to aqueous polymer dispersion before dilution of the latter. They also recommended a longer plasticization time for insoluble plasticizers than for soluble plasticizers. In his work on the coating of large Alumina particles, Ould-chikh (2008) found that adding a plasticizer (Polyvinyl Alcohol (PVA)) in aqueous suspension reduces dramatically the segmentation or the cracking of the coating films upon drying. Laboulfie et al. (2013) also studied the effect of plasticizer on the mechanical resistance and thermal behavior of composite coating films. They found that adding a plasticizer (Polyethylene glycol (PEG)) enhanced the plastic behavior of the coting films and improved its mechanical properties.
The selection of suitable plasticizers during coating formulation is time consuming and empirical.
3.5. Fillers
Fillers generally refer to cheap and inert materials that are included in a coating composition in order to take up space and diminish the cost of the product. Typically, fillers (such as stearic acid) are added to the coting dispersion to enhance some desired properties such increasing the viscosity or the hydrophobicity of the final product.
4. Computational methods in granulation
process
In this work, we will use different numerical methods to investigate the structure of agglomerates and the interactions between the particles in the coating solution. Simulation and properties prediction of agglomerates and granular systems is subject to the constraint of computational performances and thus require a hierarchic division: microscopic, mesoscopic and macroscopic. Fig. 1.10 schematically shows these different lengths and relates them to a number of different multi-scale methods and models based on levels of molecular details they are able to resolve. At the bottom left of the time and length scale there is the quantum mechanics methods. This method takes into consideration electronic configurations, and therefore is located at a time and space range typically of the order of Å and ps. At slightly larger scale, there is the all-atom simulation that allows, within the framework of molecular mechanics, the description of the non-covalent interactions responsible for the formation of agglomerates and self-assembled systems.
18
Fig. 1.10 – Multiscale modeling in granulation process. Figure adapted from Cameron (2005), Chipot (2003) and Sutmann (2009).
However, all-atom simulations are computationally heavy, and the computing capabilities sets a limit for the system size and simulation time to 10-100 Å and several ns respectively. All-atom simulation are therefore valuable for simple systems and cannot give access to several mesoscale phenomena including the structure of agglomerate, polymer-surface adsorption and self-assembly of large polymers. This led to the development of mesoscopic simulation methods such as DPD, with an intermediate level of detail and intermediate computational cost, and which opens the accessibility to a larger length between nm and micrometer, and time scale between nanoseconds and microseconds. It also shares a time-space range with the experimental study which makes the validation of DPD simulation results possible.
Finally, macroscopic simulation methods can be used for larger spatio-temporal scales; methods such as the distinct elements method (DEM) and the finite element methods (FEM). DEM is a simulation technique where the particles are considered individually rather than as a continuum and interact only at contact points. FEM is a simulation method based on the division of space on a mesh. An equation is obtained for each point of FEM discretization and the resolution of these equations allows the definition of a coupling between the particle and its surrounded fluid.