Official URL
DOI : https://doi.org/10.1007/978-3-030-02849-7_8
Any correspondence concerning this service should be sent to the repository administrator: [email protected]
This is an author’s version published in: http://oatao.univ-toulouse.fr/24706 Open Archive Toulouse Archive Ouverte
OATAO is an open access repository that collects the work of Toulouse researchers and makes it freely available over the web where possible
To cite this version: El Malki, Mohammed and Kopliku, Arlind and Sabir, Essaid and Teste, Olivier Benchmarking Big Data OLAP NoSQL Databases. (2018) In: 4th International Symposium on Ubiquitous Networking (UNet 2018), 2 May 2018 - 5 May 2018 (Hammamet, Tunisia).
Benchmarking Big Data OLAP NoSQL
Databases
Mohammed El Malki1(&), Arlind Kopliku1, Essaid Sabir2, and Olivier Teste1
1
Institut de Recherche en Informatique de Toulouse, Toulouse, France {elmalki,teste}@irit.fr, [email protected] 2
NEST Research Group, ENSEM, Hassan II University of Casablanca, Casablanca, Morocco
Abstract. With the advent of Big Data, new challenges have emerged regarding the evaluation of decision support systems (DSS). Existing evaluation benchmarks are not configured to handle a massive data volume and wide data diversity. In this paper, we introduce a new DSS benchmark that supports multiple data storage systems, such as relational and Not Only SQL (NoSQL) systems. Our scheme recognizes numerous data models (snowflake, star and flat topologies) and several data formats (CSV, JSON, TBL, XML, etc.). It entails complex data generation characterized within “volume, variety, and velocity” framework (3 V). Next, our scheme enables distributed and parallel data gen-eration. Furthermore, we exhibit some experimental results with KoalaBench.
1 Introduction
Several benchmarks have been proposed for information systems evaluation and specifically for decision support systems [1]. We particularly mention the well-known TPC-DS [18] and the TPC-H benchmarks [13, 24]. They provide data sets and usage scenarii allowing comparison of systems’ behavior under equivalent conditions, thus permitting comparative evaluations. Recently, information systems have quickly evolved to support the growth of data Volume, Variety/diversity and Velocity (3 V) framework. However, the evaluation benchmarks have not evolved at the same rate. The existing solutions are still at the time where data warehouses were mainly stored in a single powerful machine and relational databases were mostly used. Besides, there are many other reasons to make us believe that a new DSS benchmark is required. For instance, we cite the following:
(i) New Enabling Technologies: Nowadays, there are different NoSQL (“Not only SQL”) systems that ease Big Data management, which cannot be handled effi-ciently by existing relational systems [11, 20]. These systems enable the storage according to various data models (documents, columns, graphs, etc.), introducing a higher flexibility on the schema levels. We are facing a high diversity of solutions to jointly consider;
(ii) Multiple Data Models: Every NoSQL solution supports different formats and data models [7]. On one hand, multidimensional data warehouses rooted with rela-tional databases (ROLAP) favour data models like the snowflake schema (stan-dardized schemas) or the star schema (non-standard schema). On the other hand, NoSQL systems are likely to use a flat model with a complete denormalization (can be related to the universal relationship) and could use imbrications. These approaches go against the principle introduced by the relational approach of strict separation between the data model and the data processing. The dependencies between data modelling and data processing make even more important to have a support for multiple data models adapted to multiple various treatments;
(iii) Data Volume: Before deciding which solution to adopt, it is important to check the system behaviour under a massive amount of data [11]. The larger the amount is, the more we are facing the memory limits on a single-computer configuration. Big Data’s new solutions allow to scale up and balance the memory disorders. Data are settled on multiple computers forming a cluster. Then, when it reaches the storage limit, the system can be upgraded by simply adding new computers. This agile method costs less than increasing the storage capacity of a centralized computer. It is worth to mention that existing benchmarks generate the data only on one computer;
(iv) Variety/Diversity: NoSQL systems rely on new logical data models that promise higher flexibility. Some NoSQL systems are said “schemaless”; i.e. there is no fixed data schema. Data of the same class can have no schema or might have multiple schemas. Integration and analysis of those heterogeneous data sets is a complicated task that benchmarks dedicated to the existing decision-making systems are still struggling with;
(v) Velocity: As data is generated with an increasing rate, the architectures are compelled to adopt a system capable of processing such fast growing data. Henceforth, related research community must consider new evaluation benchmarks supporting big data challenges. Data warehouses evaluation benchmarks (TPC-DS [18], TPC-H and SSB [19] are relatively out-of-date and do not consider the new challenges and technologies. These solutions are neither defined for a usage in a distributed environment, nor for NoSQL databases. Their data generating processes are quite sophisticated and interesting. However, they remain limited when it comes to data volume and data variety since they depend on the memory limit of the machine being used for data generation and they only generate one data model, one file format, and one schema. NoSQL systems work with different logical data models and different file formats and they can accommodate to diverse schemaless data. In other terms, a significant effort is needed to load data on NoSQL systems and to be able to assess some of their advantages such as support for data diversity.
In this paper, we propose a new benchmark for evaluating multidimensional data warehouses that take into consideration big data properties (i.e., 3 V paradigm). KoalaBench is an extension of TPC-H that tackles big data technologies and requirements. These new benchmark functionalities include:
– Support for relational databases system and NoSQL systems;
– Support parallel and distributed data generation natively in HDFS; – Support for variety/diversity: multiple schemas at once;
– Support for velocity: able to process fast growing data.
The remaining is organized as follows. We provide in Sect. 2 a comprehensive overview on existing benchmark suites. Section 3 describes the proposed benchmark. We finally exhibit an extensive experimental work and results in Sect. 4. Concluding remarks and some future directions are drawn in Sect. 5.
2 Related Work
During the last few years, tremendous research efforts on information system bench-marks have been deployed. However, the technology evolution and the explosion of stored information are demanding novel and efficient benchmarks methods. We dis-tinguish two benchmarking families with respect to distributed information systems and decision support systems. The first method details the TPC-D derived benchmarks, which focus on Decision Systems (DSS). Whereas, the second family tackles the benchmarks supporting NoSQL approaches.
2.1 Decision Benchmark Systems (DSS)
Benchmark approach edited by Transaction Processing Performance Council (TPC) is the most used to evaluate DSS systems. The well-known benchmark APB-1 was popular in the 90’s. It quickly became obsolete because it was too simple and unsuitable for most experiences [4, 22].
The TPC-D benchmark was the first benchmark designed explicitly for DSS sys-tems. Later, two sub-benchmarks were derived from it: TPC-H has been designed for ad-hoc queries and R has been designed for reporting. DS succeeds on TPC-H as the data model became richer, standardized and supports a total of 99 queries classified into 4 categories: interactive OLAP queries, ad-hoc decision support queries, extraction queries and reporting queries. The data model is a constellation schema composed of 7 fact tables and 17 shared dimensions tables. TPC-H is an alternative benchmark that simulates a decision support system database environment. It imple-ments business-oriented queries and concurrent data access. These queries are per-formed on ultra large amounts of data and have a high degree of complexity.
In 2009, the Star Schema Benchmark (SSB) was proposed [19]. It is an extension of the TPC-H benchmark. Unlike TPC-DS, SSB introduces some denormalization on data for the sake of simplicity. It implements a pure star schema composed of a fact table and 4 dimension tables. In order to adapt a star-schema-oriented benchmark to NoSQL, two SSB-derived benchmarks were proposed. Namely, the CNSSB that supports column-oriented data models [6] and SSB that supports column-oriented as well as documents-oriented data models with different logical data modelling approaches [2]. TPC benchmarks remain the main reference for DSS evaluation. However, they are built for relational systems and cannot be easily implemented for NoSQL databases.
2.2 Big Data Benchmarks
Big Data benchmarks tend to compare the new systems that are storing massively distributed data and that support parallels computing. Yahoo Cloud service is one of the most popular tools. It is used to compare standard CRUD operations (Create, Read, Update and Delete) [3]. It already has been used by most of the NoSQL systems proving their capabilities for data loading, updates, etc. [3]. Similarly, Bigframe is a benchmark that primarily focuses on problems of volume, variety, and velocity in Big Data context [10]. With more functionalities than the first two, the authors of [8] propose BigBench which models command lines. It is composed of 3 types of data: structured (from TPC-DS), semi-structured (clicks streams on web sites), and unstructured (clients comments) and it is developed to measure and evaluate offline analytic using Hadoop. Hibench is a benchmark suite for measuring incomplete data using Hadoop and MapReduce. BigDataBench is a complete benchmark suite that evaluates the big data requirements centric on 4 V [14]. it supports the offline and online analysis using Hadoop and NoSQL.
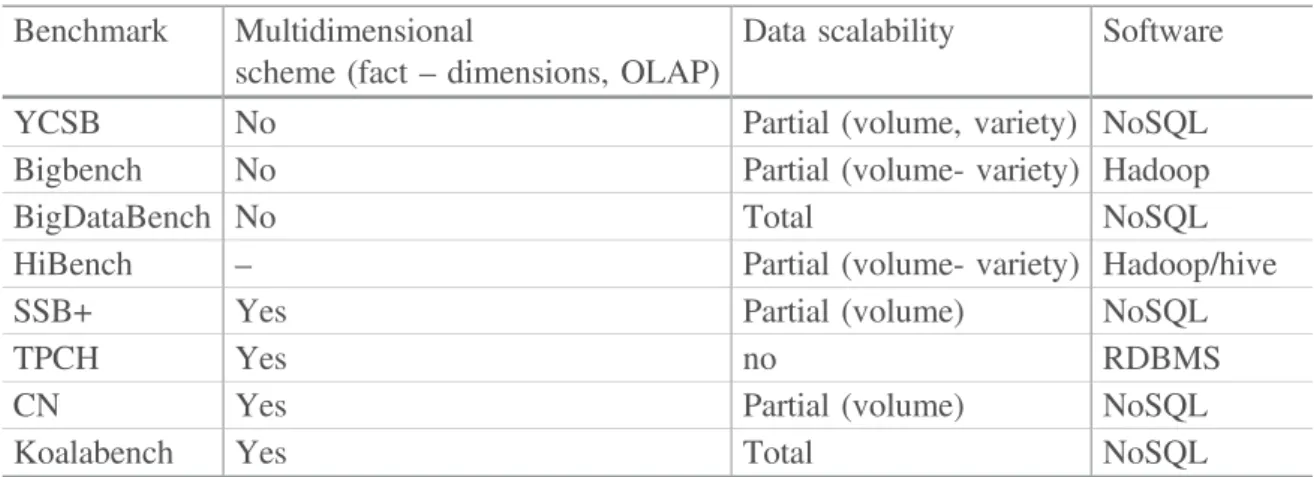
As shown in Table 1 and unlike traditional benchmarks, big data benchmarks are oriented toward flexible information, massive data, and scalability. Even though these big data benchmarks have gained popularity in the last few years, they do not evaluate the same criteria as compared to DSS benchmarks (fact, dimensions, OLAP).
In this paper, we propose a new benchmark, an extension of TPC-H. This solution supports column-oriented models and document-oriented models. This effort is com-plementary to the Big Bench effort as it provides a simpler but fair framework to play with NoSQL and SQL-like technologies. Also this new benchmark is dedicated to multidimensional data warehouse.
3 KoalaBench Benchmark Tool
KoalaBench is a decision support benchmark for Big Data needs. It is derived from the TPC-H benchmark, the reference benchmark in research and industry for decision support systems. It has been adapted to support Big Data technologies such as NoSQL
Table 1. Comparing Big Data benchmarking solutions. Benchmark Multidimensional
scheme (fact – dimensions, OLAP)
Data scalability Software
YCSB No Partial (volume, variety) NoSQL
Bigbench No Partial (volume- variety) Hadoop
BigDataBench No Total NoSQL
HiBench – Partial (volume- variety) Hadoop/hive
SSB+ Yes Partial (volume) NoSQL
TPCH Yes no RDBMS
CN Yes Partial (volume) NoSQL
and Hadoop file systems. It generates data in different file formats following different data models. The data generator is developed using a Java development of TPC-H. It supports:
– different logical models (flat, star, snowflake and flexible models);
– different formats compatible with NoSQL and relational storage systems; – parallel and distributed data generation through HDFS and MapReduce; – diversity in data through flexible schemas;
– velocity of generated data.
3.1 Data Models
The KoalaBench benchmark can generate consistent data with 3 logical models [3,4]. We detail them below:
Snowflake Data Model. This first data model is very close to the one used in the TPC-H benchmark with small modifications. In the snowflake model, data redundancy is minimized through data normalization; facts refer to dimensions which refer to other entities. For example, a customer can reference a country that references a region (Europe). The regions and the countries are generated in different files. The data schema is represented in. In this model, the data are generated in 9 files which will serve to supply the database.
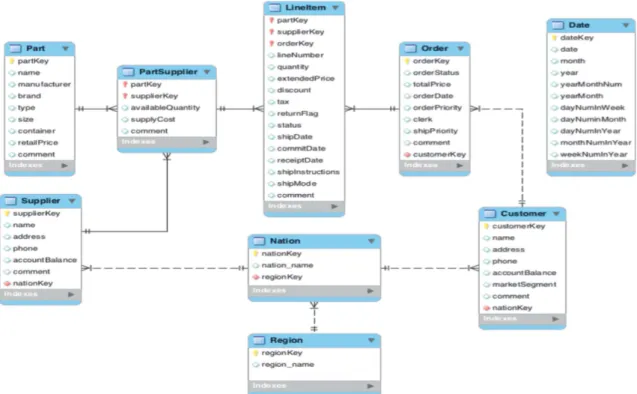
Star Data Model. This data model corresponds to a star schema. It is a common data model for data warehouses [17,21]. It is simpler than the snowflake schema. Here, we only consider one entity per fact and one entity per dimension. Dimensions themselves can have some redundancy (functional dependencies data). For instance, the customer is associated with a country that is associated with a region (e.g. EUROPE). In the star schema, we will not have a separate file for countries and regions. The customer file will include the country and the region even if the region is functionally dependent from the region. The data generation and data model are very similar to the Star Schema Benchmark (SSB) (Fig. 1).
We add a table entity. named Date. becomes an explicit dimension and it is described by multiple attributes such as “week number”, “day of the week”, “day in the year”, … The date table is common in traditional data warehouses. The LineItem fact is associated with 4 dimensions: Customer, Part, Date, and Supplier. This makes a simplification in the schema. The data schema is represented in Fig. 2.
Flat Data Model. This is the simplest data model we propose. It groups, in one entity, data about the fact and dimensions. This creates a considerable amount of redundancy in data, but it is known to be better for some NoSQL systems that do not support joins. We remove some attributes that are less important.
3.2 Complex Data
The new benchmark supports diversity of data, meant as variety of schema. It can generate data with diverse schemas i.e. data of the same class (table, collection) does not have to comply with one strict schema, different records of the same class can have
different schemas. It is easy to think of instances of the class “products”, where we can store mobile phones and num supplier. They can be described by common attributes such as weight and brand but they can have specific attributes such as screen size.
Fig. 1. Snowflake data model
Benchmark support for data diversity is important as support of flexible schemas is one of the major advantages of some NoSQL systems. KoalaBench enables diverse data generation, which can help measure this advantage. Data diversity is optional and is user defined. The user has to define two parameters:
– diversity: the possible schema categories. The records of the same category are homogeneous in structure i.e. have the same attributes.
– homogeneity: indicates the distribution of the data according to the diversity, meaning the ratio of records by the schema category.
To illustrate, consider A the set of the attributes such as A = [a1, a2 …, an] and T the set of records such as T = [t1,t2…, tm]. With a diversity level equal to 2, we get two categories of schemas:
– CS1= [b1, b2, …, bp] a set of attributes bj 2 A – CS2 = [c1, c2, …, cq] a set of attributes cj 2 A
The choice of attributes is determined by the user, in a configuration file of schemas and their distribution; CS1 [ CS2 = A. This file allows the user to determine the
schemas and the distributions percentage.
The homogeneity specifies the distribution of data for the different possible sche-mas; the level of homogeneity is proportional to the level of the diversity. For example, with a diversity level at 2, the homogeneity is equal to 1⁄2 + 1⁄2, forming two sets of data such as T1 [ T2 = T et T1 \ T2 = ∅:
– T1: 50% of records with a data schema of category CS1.
– T2: 50% of records with a data schema of category CS2.
Note 1: In this extension, the flexibility does not concern root attributes (identifiers) of the dimensions.
Note 2: The absence of some attributes in the data schemas that are potentially diverse, has a direct consequence on the results and the queries usage. Some requests can become invalid, if the attributes they contain do not appear in any schemas. To address this issue, we recommend choosing categories of schema that cover every attribute (C S1 [ C S2 = A).
Data Velocity. Ability to process data with regular or irregular interval refreshment is another contribution of this paper. The new benchmark considers this feature and allows the user to select the data generation interval and the time T for data loading in the system. For example, for a total volume of 1 TB of data, the user can specify a generation of 2000 GB every 60 s. Same for loading, the user can schedule a load at a regular time interval or not. For an irregular interval, the user only specifies the number of times the file must be loaded and the maximum time Tmaxto wait between two loads.
The system implicitly generates a value T 2 [1, Tmax].
3.3 File Formats and Supported Systems
Several file formats are possible: tbl, csv, json and xml. To optimize the data loading phase in the NoSQL systems, the generator gives the user the possibility to specify the appropriate format of the used NoSQL systems. For example, for the
document-oriented model, MongoDB is a system storing data in bjson (binary json), it is opti-mized for a loading from json files. Loading a csv format file in MongoDB is possible but it will need a conversion in json that considerably increases the loading time. Koalabench has a special option for generating data compatible with ElasticSearch.
Regarding the formats and the data models generated, several data management systems are supported.
– Relational databases: PostgreSQl, MySQL, Oracle that takes files under csv, tbl or xml formats.
– XML databases or object-oriented supporting XML format files.
– Document-oriented databases: MongoDB, CouchDB, ElasticSearch that compliant with json format.
– Column-oriented databases: HBase, Cassandra that takes csv format files. – Graph-oriented databases: Neo4j that takes files in csv format.
The supported systems are summarized in the following Table 2.
3.4 Distributed Data Generation
The data generator has been adapted to generate data on several computers in parallel. It is possible to generate data on the very popular distributed files system HDFS. The distributed generation is based on the two main components of the Hadoop distributed file systems:
– MapReduce: to ensure the parallel generation of data. – HDFS: to ensure the distributed file storage.
3.5 Impact of Scale Factor
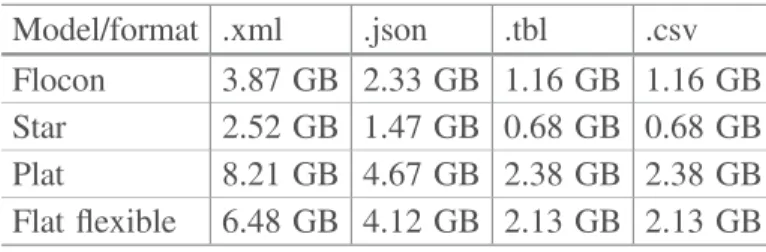
Here, we discuss the effect of the scale factor on data generation. We detail the data generation for scale factor sf = 1. For other scale factors, the proportions are linear Snowflake Model: When we generate data with the snowflake data model, we gen-erate 8 files for 8 entities. For each entity we have: 5247925 line items, 1500000 orders, 150000 customers, 800000 supplied parts, 200000 parts, 10000 suppliers, 25 nations, 5 regions. The total dataset size takes different amounts of memory depending on the data format. More precisely, it takes: 3.87 GB in .xml, 2.33 GB in .json, 1.16 GB in .tbl and 1.16 GBin .csv.
Table 2. Supported systems versus supported file formats.
Information system class Supported databases (examples) File formats RDBMS PostgreSQL, MySQL, SqlServer, Oracle, etc. csv, tbl, xml Document-oriented MongoDB, CouchDB, ElasticSearch json
Column-oriented Hbase, Cassandra csv, tbl
Graph-oriented Neo4J csv
Star Model: When we generate data with the star data model, we generate 5 files for 5 entities. For each entity we have: 5247925 line items, 150000 customers, 200000 parts, 10000 suppliers and 255 dates. The total dataset size takes different amounts of memory depending on the data format. Yet: 2.52 GB in .xml, 1.47 GB in .json, 0.68 GB in .tbl and 0.68 GB in .csv.
Flat Model: When we generate data with the flat data model, we just generate 1 file. We have a total of 5247925 line items. The total dataset size takes different amounts of memory depending on the data format. More precisely, it takes: 8.21 GB in .xml, 4.67 GB in .json, 2.38 GB in .tbl and 2.38 GB in .csv.
Obtained results are summarized in Table 3.
3.6 Queries Generator
Without loss of generality, we use the original QGEN query generator to generate queries written in SQL. Generating queries in other interrogation languages is tempting and certainly useful, but it would be challenging to cover all the NoSQL technologies out there. Moreover, this would likely be technology and version specific. The QGEN generator has a high number of queries; few of them could not be directly translated into NoSQL language specific queries. Some NoSQL systems are not suitable for non-standard data models (e.g. “joins” are not supported natively). Thus, it is up to the benchmark users to handle the adaptation work.
For our own experiments, we rewrote some queries to adapt them to the non-standard data models and we translated them into the targeted NoSQL database lan-guages: Hive for HBase usage, CQL for Cassandra usage, in the MongoDB query language for a usage with MongoDB and in the Cypher language to be used with Neo4j. These queries can be classified according to two criteria:
– Dimensionality affects the dimensions number in the grouping clause (equivalent to the Group By clause in SQL): iD for i dimensions;
– Selectiveness affects the level of data filtering when some conditions are applied.
4 Experiments and Data Sets
In this section, we present the results of some experiments conducted using the pro-posed benchmark. More precisely:
Table 3. File size versus data model. Model/format .xml .json .tbl .csv Flocon 3.87 GB 2.33 GB 1.16 GB 1.16 GB Star 2.52 GB 1.47 GB 0.68 GB 0.68 GB Plat 8.21 GB 4.67 GB 2.38 GB 2.38 GB Flat flexible 6.48 GB 4.12 GB 2.13 GB 2.13 GB
– we analyze and compare data generation with respect to the memory usage; – we analyze and compare data generation with respect to the execution time; – we analyze and compare loading times in Cassandra and MongoDB NoSQL.
For the different configurations, we change the scale factor to enable comparison at different scale levels.
Hardware. The used cluster includes three nodes (machines). Each node has 4-core CPU, 3.4 Ghz (i5-4670), 8 GB RAM, 2 TB SATA disk (7200RPM), 1 Gb/s network. Each node acts as a worker. One node acts also as dispatcher.
Software: Every machine runs on a CentOS operating system. We test data loading on two NoSQL data stores: Cassandra (v.3) and MongoDB (v.3.2) [5]. The latter repre-sents respectively column-oriented storage and document-oriented storage.
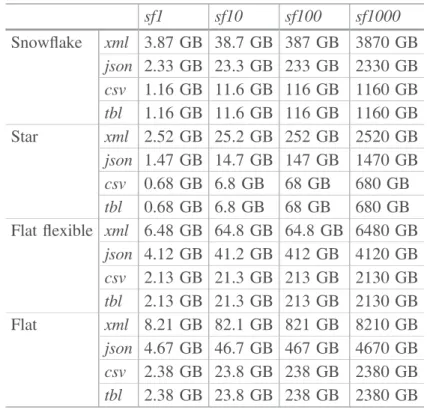
Experiment 1: Memory Usage on Different Configurations. In Table 4, we report the time needed to generate data under different scale factors (sf = 1, 10, 100, 1000) for the different data models. The file format impacts drastically the memory usage, as we can see in Table 3. For instance, at sf = 1000 and under the flat model, we have got 2380 GB for CSV file format and 4670 GB (almost double) for the JSON format. This difference impacts significantly the generating time, as files with a more expressive format (JSON or XML) may need 3 to 4 longer time. This way, using flat model at sf = 1000, we need around 17883 s to generate a CSV file versus 69872 s for a JSON file. Another observation can be noted about the fixed or flexible generation on the flat model. Indeed, we notice that the flexible generation is faster, which is explained by the minor volume generated Table 6.
Table 4. Memory usage (in GB) by factor and by scale model sf1 sf10 sf100 sf1000 Snowflake xml 3.87 GB 38.7 GB 387 GB 3870 GB json 2.33 GB 23.3 GB 233 GB 2330 GB csv 1.16 GB 11.6 GB 116 GB 1160 GB tbl 1.16 GB 11.6 GB 116 GB 1160 GB Star xml 2.52 GB 25.2 GB 252 GB 2520 GB json 1.47 GB 14.7 GB 147 GB 1470 GB csv 0.68 GB 6.8 GB 68 GB 680 GB tbl 0.68 GB 6.8 GB 68 GB 680 GB Flat flexible xml 6.48 GB 64.8 GB 64.8 GB 6480 GB json 4.12 GB 41.2 GB 412 GB 4120 GB csv 2.13 GB 21.3 GB 213 GB 2130 GB tbl 2.13 GB 21.3 GB 213 GB 2130 GB Flat xml 8.21 GB 82.1 GB 821 GB 8210 GB json 4.67 GB 46.7 GB 467 GB 4670 GB csv 2.38 GB 23.8 GB 238 GB 2380 GB tbl 2.38 GB 23.8 GB 238 GB 2380 GB
Experiment 2: In Table 5, we report the loading time under different scale factors (sf = 1, 10, 100) for different data models. We only have proceeded to the necessary loading for each tool, JSON for MongoDB and CSV for Cassandra. We notice that the required loading time in Cassandra is lower than in MongoDB. For example, at sf = 1, we need 672 s for Cassandra versus 3976 s for MongoDB, which means 4 times longer. This can be explained by the file’s format used. In MongoDB, the JSON format used is 4 times more voluminous than a CSV file. In addition, it led to more transfers between the master node and the slave node. The communication in Cassandra via its master-master architecture seems much less expensive. MongoDB creates an important number of indexes to optimize the querying phase.
5 Concluding Remarks
This paper presents the KoalaBench benchmark built to address the issues of decisions support systems based on big multidimensional data warehouses (Big Data). It is based on an extension of the reference benchmark TPC-H. The data can be generated in different formats (TBL, CSV, XML, JSON) and in different data models. It is worth to
Table 5. Time of generation (in seconds) by scale factor and by model. sf1 sf10 sf100 sf1000 Snowflake xml 50.2 s 386 s 3634 s 35902 s json 39.2 s 298 s 2873 s 27453 s csv 23.7 s 173 s 1877 s 17832 s tbl 23.7 s 173 s 1877 s 17832 s Star xml 30.5 s 192 s 2028 s 18973 s json 40.5 s 244 s 2351 s 21839 s csv 20.8 s 123 s 1312 s 12893 s tbl 20.8 s 123 s 1312 s 12893 s Flat flexible xml 122 s 1143 s 11165 s 104321 s json 71 s 561 s 5835 s 56348 s csv 21 s 136 s 1560 s 14902 s tbl 21 s 136 s 1560 s 14902 s Flat xml 154 s 1372 s 13767 s 132756 s json 87 s 691 s 7003 s 69872 s csv 31 s 164 s 1873 s 17883 s tbl 31 s 164 s 1873 s 17883 s
Table 6. Loading time per model and per scale factor with Cassandra and MongoDB. sf = 1 sf = 10 sf = 100
Cassandra (star) 672 s 6643 s 69025 s MongoDB (flat) 3967 s 38632 s 381142 s
mention that KoalaBench is not restricted to relational models; it can also generate data in several NoSQL systems. This novel benchmark solution is suitable for columns-oriented, graph-oriented and documents-oriented NoSQL systems. Moreover, data can be generated under a fixed or a flexible schema, in a distributed architecture using the Hadoop platform. KoalaBench proposes a specific loading script for every evaluated system. Conducted experiments show that the KoalaBench brings numerous advan-tages compared to the original version TPC-H. It simplifies the loading phase and allows data loading in a Hadoop distributed environment. It also permits evaluating the schemas’ diversity, which is specific to NoSQL approaches. This functionality enables dynamic data generation.
References
1. Chaudhuri, S., Dayal, U.: An overview of data warehousing and OLAP technology. SIGMOD Rec. 26(1), 65–74 (1997)
2. Chevalier, M., El Malki, M., Kopliku, A., Teste, O., Tournier, R.: Document-oriented data warehouses: models and extended cuboids, extended cuboids in oriented document. In: 10th International Conference on Research Challenges in Information Science (RCIS 2016), Grenoble, France, pp. 1–11. IEEE (2016)
3. Chevalier, M., El Malki, M., Kopliku, A., Teste, O., Tournier, R.: Implementation of multidimensional databases in column-oriented NoSQL systems. In: Morzy, T., Valduriez, P., Bellatreche, L. (eds.) ADBIS 2015. LNCS, vol. 9282, pp. 79–91. Springer, Cham (2015).
https://doi.org/10.1007/978-3-319-23135-8_6
4. Chevalier, M., El Malki, M., Kopliku, A., Teste, O., Tournier, R.: Implementation of multidimensional databases with document-oriented NoSQL. In: Madria, S., Hara, T. (eds.) DaWaK 2015. LNCS, vol. 9263, pp. 379–390. Springer, Cham (2015). https://doi.org/10. 1007/978-3-319-22729-0_29
5. Cooper, B.F., Silberstein, A., Tam, E., Ramakrishnan, R., Sears, R.: Benchmarking cloud serving systems with YCSB. In: Proceedings of the 1st ACM Symposium on Cloud Computing, Series. SOCC 2010. ACM, pp. 143–154 (2010)
6. Darmont, J.: Data warehouse benchmarking with DWEB. In: Taniar, D. (ed.) Progressive Methods in Data Warehousing and Business Intelligence: Concepts and Competitive Analytics. Advances in Data Warehousing and Mining (2008)
7. Dede, E., Govindaraju, M., Gunter, D., Canon, R.S., Ramakrishnan, L.: Performance evaluation of a MongoDB and hadoop platform for scientific data analysis. In: Proceedings of the 4th ACM Workshop on Scientific Cloud Computing, Series, pp. 13–20 (2013) 8. Dehdouh, K., Boussaid, O., Bentayeb, F.: Columnar NoSQL star schema benchmark. In: Ait
Ameur, Y., Bellatreche, L., Papadopoulos, George A. (eds.) MEDI 2014. LNCS, vol. 8748, pp. 281–288. Springer, Cham (2014). https://doi.org/10.1007/978-3-319-11587-0_26
9. Dehdouh, K., Bentayeb, F., Boussaid, O., et al.: Using the column oriented NoSQL model for implementing big data warehouses. In: PDPTA. The Steering Committee of The World Congress in Computer Science, Computer Engineering and Applied Computing (World-Comp), p. 469 (2015)
10. Ghazal, A., et al.: BigBench: towards an industry standard benchmark for big data analytics (2013)
11. Iu, M.-Y., Zwaenepoel, W.: HadoopToSQL: a mapReduce query optimizer. In: Proceedings of the 5th European Conference on Computer Systems. ACM, pp. 251–264 (2010)
12. Ivanov, T., Rabl, T., Poess, M., Queralt, A., Poelman, J., Poggi, N., Buell, J.: Big Data Benchmark Compendium. In: Nambiar, R., Poess, M. (eds.) TPCTC 2015. LNCS, vol. 9508, pp. 135–155. Springer, Cham (2016). https://doi.org/10.1007/978-3-319-31409-9_9
13. Jacobs, A.: The pathologies of big data. Commun. ACM 52(8), 36–44 (2009)
14. Kim, K., et al.: MRBench: a benchmark for mapReduce framework. In: 2008 14th IEEE International Conference on Parallel and Distributed Systems. ICPADS 2008, pp. 11–18, December 2008
15. Hacigumus, H., Iyer, B., Mehrotra, S.: Providing database as a service. In: 2002 Proceedings of 18th International Conference on Data Engineering. IEEE, pp. 29–38 (2002)
16. Lee, K.-H., Lee, Y.-J., Choi, H., Chung, Y.D., Moon, B.: Parallel data processing with mapReduce: a survey. SIGMOD Rec. 40(4), 11–20 (2012)
17. Lee, R., Luo, T., Huai, Y., Wang, F., He, Y., Zhang, X.: YSmart: yet another SQL-to-mapReduce translator. In: 2011 31st International Conference on Distributed Computing Systems (ICDCS), pp. 25–36, June 2011
18. Moniruzzaman, A.B.M., Hossain, S.A.: NoSQL database: new era of databases for big data analytics - classification, characteristics and comparison. CORR abs/1307.0191 (2013) 19. Morfonios, K., Konakas, S., Ioannidis, Y.: ROLAP implementations of the data cube. ACM
Comput. Surv. (CSUR) 39(4), 12 (2007)
20. Poess, M., Nambiar, R.O., Walrath, D.: Why you should run TPC-DS: a workload analysis. In: Proceedings of the 33rd International Conference on Very Large Data Bases. VLDB 2007 (2007)
21. O’Neil, P.E., O’Neil, E.J., Chen, X.: The star schema benchmark (SSB). In: PAT, vol. 200, p. 50 (2007)
22. Stonebraker, M.: New opportunities for new SQL. Commun. ACM 55(11), 10–11 (2012) 23. Ravat, F., Teste, O., Tournier, R., Zurfluh, G.: Algebraic and graphic languages for OLAP
manipulations. In: Strategic Advancements in Utilizing Data Mining and Warehousing Technologies: New Concepts and Developments, p. 60 (2009)
24. Vassiliadis, P., Sellis, T.: A survey of logical models for OLAP databases. ACM SIGMOD Rec. 28(4), 64–69 (1999)
25. Wang, J., et al.: BigDataBench: a big data benchmark from internet services. In: 2014 IEEE 20th International Symposium on High Performance Computer Architecture (HPCA), pp. 488–499, February 2014
26. Zhang, J., Sivasubramaniam, A., Franke, H., Gautam, N., Zhang, Y., Nagar, S.: Synthesizing representative I/O workloads for TPC-H. In: Software, IEEE Proceedings, pp. 142–142, February 2004
27. Zhao, H., Ye, X.: A practice of TPC-DS multidimensional implementation on NoSQL database systems. In: Nambiar, R., Poess, M. (eds.) TPCTC 2013. LNCS, vol. 8391, pp. 93– 108. Springer, Cham (2014). https://doi.org/10.1007/978-3-319-04936-6_7