O
pen
A
rchive
T
OULOUSE
A
rchive
O
uverte (
OATAO
)
OATAO is an open access repository that collects the work of Toulouse researchers and
makes it freely available over the web where possible.
This is an author-deposited version published in :
http://oatao.univ-toulouse.fr/
Eprints ID : 16507
To link to this article :
URL :
http://www.ijera.com/pages/v6no3(v6).html
To cite this version : Selva, Pierre and Lorrain, Bernard and Alexis,
Joël and Seror, Alexandre and Longuet, Arnaud and Mary, Caroline
and Denard, Fabrice Low cycle biaxial fatigue behavior of direct aged
Nickel-based 718 superalloy. (2016) International Journal of
Engineering Research and Applications, vol. 6 (n° 3). pp. 1-8. ISSN
2248-9622
Any correspondance concerning this service should be sent to the repository
administrator:
[email protected]
Low cycle biaxial fatigue behavior of direct aged Nickel-based 718
superalloy
P. Selva*, B. Lorrain**, J. Alexis**, A. Seror***, A. Longuet***, C. Mary***,
F. Denard***
*Centre d’Ingénierie en Mécanique, Matériaux et Surfaces, ENIT, 65016 Tarbes, France ** Université de Toulouse, LGP, ENIT/INPT, 65016 Tarbes, France
*** Safran-Snecma, Direction Technique, Etablissement de Villaroche, 77550 Moissy-Cramayel, France
ABSTRACT
In recent years, significant advances in the fabrication process of nickel-base supperalloy leading to grain size reduction have been made in order to improve fatigue properties of aircraft turbine discs. Indeed, a change in particle size affects the initiation mode of fatigue cracks as well as the fatigue life of the material. The present study aims to investigate the fatigue behavior of a newly developed nickel-based superalloy under biaxial-planar loading. Low Cycle Fatigue (LCF) tests are performed at different stress ratios to study the influence of the multiaxial stress state on the fatigue life of the material. Full-field displacement and strain measurements as well as crack initiation detection are obtained using Digital Image Correlation (DIC) techniques. Results related to different load ratios are presented and an appropriate biaxial lifetime prediction is given. Crack detection, strain amplitude and number of cycles to crack initiation vs. triaxial stress ratio for each loading case are mentionned. From fractographic investigations by scanning electron microscopy it is found that the mechanism of fatigue crack initiation does not depend on the triaxial stress ratio and that most fatigue cracks initiate from subsurface carbides.
Keywords –
Multiaxial fatigue, Cruciform specimen, nickel-base superalloyI.
INTRODUCTION
Inconel 718 has been predominantly used in aeronautic engine components, such as turbine discs and shafts, as they combine high temperature strength, toughness, good creep and rupture strengths as well as good corrosion endurance.
Over the past four decades, extensive investigations on the fatigue life of Inconel 718 have been made. In the 1970s, Fournier and Pineau [1] and Alexandre et al. [2] studied the uniaxial cyclic stress-strain response and the low cycle fatigue life of conventionally heat-treated Inconel 718. They observed that fatigue cracks nucleated principally along the twin deformation bands and at grain boundaries at low frequency, and also that crack propagation is transgranular at 298 K. Subsequently, other studies investigated macroscopic stress-strain response, cyclic deformation structure [3], fracture behavior both at room and high temperatures [4-9], the mechanism-based modeling of fatigue life prediction [6], the fatigue behavior up to the very high cycle regime [10].
In recent years, significant advances in the fabrication process of Inconel 718 leading to grain size reduction have been made in order to improve fatigue properties of aircraft turbine discs. A change in grain size affects the initiation mode of fatigue cracks as well as the fatigue life of the material [2], [11]. Indeed, fine grain size generally provides better
fatigue resistance than coarser grains as more grain boundaries aid in transcrystalline crack arrest and thus reduce fatigue crack growth rates. However, if grains size is reduced down to primary carbides dimensions, the latter may act as fatigue crack initiation sites and involve premature failures. Therefore, experimental data are needed so as to investigate and to assess the fatigue life of this new developed superalloy.
In many applications, components are subjected to multiaxial states of stress and strain which must be taken into account in the design process. Several experimental methods to produce multiaxial stress states have been presented in the literature. Bird and Duncan [12] utilized the hydraulic bulge test, Andrews and Ellison [13,14], Lefebvre [15] and Worthem [16], among others, used thin-walled tubes subjected to axial load combined with torsional load or internal/external pressure to create biaxial stress states. However, as mentioned by Demmerle et al. [17], the most realistic experimental method to create a known homogenous in-plane biaxial stress state is the direct biaxial test on a flat cruciform specimen as developed by Pascole and De Villiers [18], Hayhurst [19], Kelly [20], Makinde [21] among others.
This study presents the set-up of a biaxial planar test-rig for fatigue tests on the nickel-base superalloy Inconel 718DA. A series of biaxial-planar fatigue tests at room temperature are performed.
Experiments are carried out on cross shaped specimens at different stress ratios in order to study the influence of the multiaxial stress state on the fatigue life of the material and to provide an appropriate lifetime prediction. Full-field displacement and strain measurements as well as crack initiation detection are obtained using Digital Image Correlation techniques. In addition to the experiments, fracture surfaces are investigated using scanning electron microscopy to determine the origin/cause of failure.
II.
TEST SPECIMEN DESIGN
Test specimen design is a challenging aspect of a biaxial-planar testing system. Since the 1980s, the design of cruciform specimens has been investigated extensively in attempt to obtain the maximum of deformation at the center of the specimen and at the same time to avoid stress concentrations in other regions [22]. For instance, reduced section type specimens were studied by [23-25]; [26] used specimens containing a series of slits in its arms, while [21] combined both characteristics. Makinde and Ferron [27] and Demmerle and Boehler [23] proposed an optimized specimen having a rectangular central section and obtained a homogenous stress-strain field over a large part of the gauge zone. From this design, Johnston and al [28] proposed a modified version by adding a circular central zone with a smaller thickness while Yong and al studied a stiffer specimen by replacing arm grooves [29]. Few years later Zhang [30] and Scholz [31] used a cross-shaped specimen with reduced thickness in the central part and variable width arms to perform fatigue tests. However, as mentioned by Hannon and Tiernan [32], no standard geometry exists.
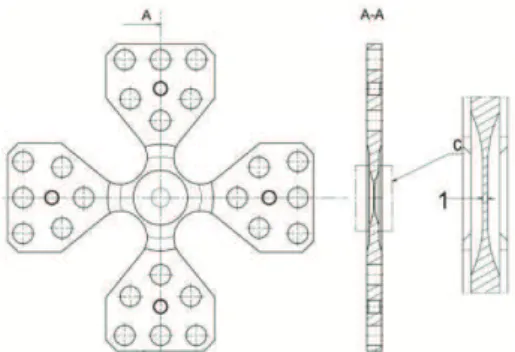
In the present study, cruciform Inconel 718 specimens with a reduced section in the gauge zone are utilized (Fig. 1). Note that for confidential reasons most dimensions of the specimen as well as chemical composition, microstructure and material properties are not revealed.
Based on the design proposed by [31], the geometry has been further optimized using numerical simulations so as to produce a stress and strain concentration with homogenous distribution in the central part, to increase the stress deviation between the gauge area and the specimen arms, and to maximize the stressed volume in the gauge zone.
Fig. 1 Visualization of the von Mises stress For the worst case of loading investigated hereafter (equibiaxial tension at 95 kN), finite element (FE) simulations were performed using the commercial FE Abaqus 6.10 software [33]. Briefly, the FE model considers one eighth of the specimen for symmetry reasons. A three-dimensional mesh (Fig. 2) is generated using 11550 20-nodes quadratic brick elements (element C3D20R in Abaqus). Symmetry plane boundary conditions are set up along the ۃX,Yۄ, ۃY,Zۄ, and ۃX,Zۄ planes, and pressure load is applied at each arm extremity. An elasto-plastic behavior combined with a nonlinear kinematic hardening model with two backstresses is considered.
Fig. 2 shows the von Mises stress field for a 95 kN biaxial tensile loading applied to three different designs: the initial geometry having a circular gauge area of a diameter of 15 mm with a thickness of 1.6 mm, a second geometry with a reduced thickness of 1 mm and a circular area of a diameter of 12 mm, and an optimized design considering the previous gauge area along with an increase of the fillet radius at the intersection of two arms. This final design reduces the stress in the arms to 90% of the maximum von Mises stress. This maximum is located in the gauge zone where the stress and strain distributions are uniform.
Fig. 2 Visualization of the von Mises stress field for an equibiaxial loading of 95 kN applied to three different designs. (a) Initial design with a central thickness of 1.6mm; (b) Second design with a reduced thickness of
1mm in the central part; (c) Optimized design with a central thickness of 1 mm and modified fillet radius
It is worth mentioning that, right after the manufacturing process, topographical characterization of the central zone of the specimens is performed using optical profilometry. Indeed, a very high proportion of all fatigue failures nucleate at the surface of components and so surface conditions constitute an extremely important factor influencing fatigue strength. In the present study, a fine polished finish of 0.2 µm maximum Ra value (roughness average defined by the absolute value of the surface height averaged over the surface) is obtained in this region to avoid crack initiation at surface roughness due to turning.
III.
EXPERIMENTAL SET-UP
III.1 Biaxial testing system
Fatigue tests are performed on the Instron biaxial cruciform testing system of the ENIT laboratory (Fig. 3) under laboratory atmosphere. The cruciform load frame is a rigid structure comprising a support base and an octagonal frame incorporating four 100kN hydraulic actuators. These actuators equipped with hydrostatic bearings have a ±20mm stroke range and are rated for operation at 280 bar supply pressure. The testing machine uses a digital controller to provide translation and deformation control of each axis. Each actuator may be operated in either non-modal control – which means actuators are controlled independently - or in modal control – which means that both actuators along the same axis are controlled dependently. In the latter case, closed-loop control using linear combinations of the two forces F1 and F2 and of the two displacements u1 and u2 of two opposite actuators is performed. In the present case, the mean force (F1+F2)/2 and mean displacement (u1+u2)/2 as well as the force difference (F1-F2)/2 and the displacement difference (u1-u2)/2 are implemented to control each axis. This permits, first, to avoid specimen center-point floating which could induce bending in the specimen resulting in an uncontrolled stress state and second, to avoid significant side loads which are detrimental to the actuators. The center of the specimen can also be considered as motionless throughout the test.
A x is B 2
A x is A 1 A x is A 2
A x is B 1
Fig. 3 Visualization of the biaxial testing machine
III.2 loading conditions
Through the literature, biaxial loading conditions are commonly derived from the desired biaxial stress ratio defined by when
or , with ,
where are the principal stresses. However, this ratio could be confusing as two different loading paths could provide the same value of b. For instance, equibiaxial compression-compression and tension-tension tests provide the same biaxial stress ratio of 1. In the following, we rather consider a triaxial stress ratio defined by the ratio of the first invariant of the stress tensor and the equivalent von Mises stress such as:
(1) Considering that then the relation between b and T is straightforward:
(2)
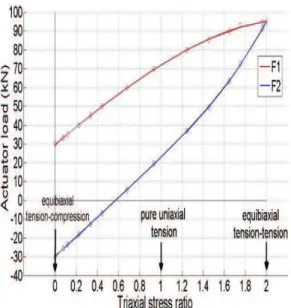
Specimens are subjected to a 1 Hz sinusoidal cyclic loading. In order to study the influence of the multiaxial stress state on the fatigue life, four different loading paths are considered: one proportional equibiaxial test in tension-tension cyclic loading at 95 kN, one proportional test in tension-tension cyclic loading equivalent to a compensated uniaxial test ( , one proportional tests in tension-tension cyclic loading producing a triaxial stress ratio of 1.73, and one proportional test in tension-compression producing a triaxial stress ratio of 0.48. Forces required and provided by each actuator to obtain a specific value of triaxial stress ratio are computed from finite element simulations (Fig. 4). It should be noted that the different multiaxial loading paths share the same maximum von Mises equivalent stress .
Fig. 4 Plot of the actuator loading as a function of triaxial stress ratio
Table I summarizes the different loading paths used in the present study. They all consider a load ratio RF=Fmin/Fmax=0.05.
TABLE IDefinition of the Loading Paths Test Triaxial stress
ratio 1 T=0.48 (-5|-0.25) (2.55|51) 2 T=1 (1.15|23) (3.6|72) 3 T=1.73 (3|60) (4.45|89) 4 T=2 (4.75|95) (4.75|95) III.3 Instrumentation
The specimens are instrumented with strain gauges in order to ensure that no flexion is induced when positioning them into the testing machine and during the test. Strain measurements are recorded using a multichannel data acquisition system until the gauges come off.
Two high-speed cameras (Phoron Fastcam SA61.1) capable of recording 50 frames per second at megapixel resolution (1024x1024 pixels) are set up, one facing each side of the specimen. A data acquisition module (National Instrument 6211) is used to synchronize image acquisitions with the load signal of the fatigue testing machine. The filtering of the command signal induces a delay of 8 ms to trigger both cameras. The acquisition sequence, which consists of recording 50 images during one cycle at different period of time, is as follows:
· From cycle 1 to 10 : every cycles
· From cycle 100 to 1000 : 1 cycle over 100
· From cycle 2000 to 10000 : 1 cycle over 1000
· From cycle 10100 till the rupture of the specimen: 1 cycle over 100.
After the completion of testing, digital image correlation is performed using the commercial Aramis software [34]. This optical full-field
measurement technique allows studying qualitatively as well as quantitatively the mechanical behavior of materials. Typically, the surface displacements are first measured with DIC. Strains are subsequently calculated by numerical differentiation of the measured displacement field.
III.4. DIC Performance
Prior to any test, performances of the DIC algorithm are evaluated. To perform DIC a random speckle pattern, which is handily performed by spray painting, is applied on both sides of the specimens. From a speckle-pattern reference image, two sets of images are artificially constructed with Fast Fourier Transformation. A sub-pixel displacement field is applied to the first set of images while a strain field is prescribed to the second set. Using these data as input, performances of the image processing algorithm are assessed by comparing the correlation software outputs with the exact imposed values. Errors are then statistically analyzed in terms of systematic error (mean difference between the measured and the prescribed fields) and uncertainty (standard deviation of the measured field). Note that calculations are performed on a regular square grid with no overlap.
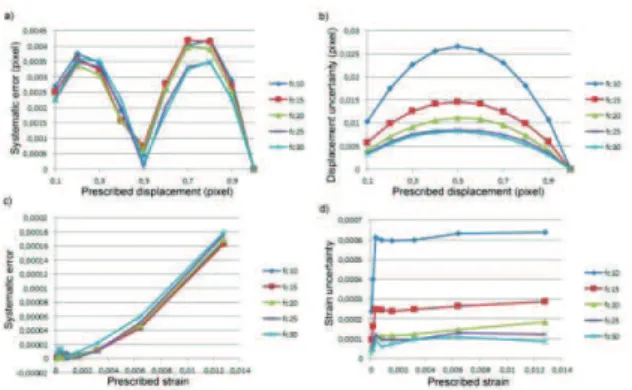
In the present case, the mean error is always under pixel equivalent to 0.075 µm (Fig. 5). The measurement uncertainty in displacement clearly depends on the mesh size. A value of 0.027 pixel is obtained with a mesh size of pixels while an uncertainty of 0.011 pixel is computed if square subsets of 20 pixels are used. However, beyond a mesh size of pixels, the gain on uncertainty is poor but there is a decrease in spatial resolution.
A similar analysis is made on the strain field. From a grid size of 20 pixels the strain uncertainty exhibits similar values, around 0.019 %. The systematic error strongly depends on the prescribed strain value. FE simulations predict a maximum strain in the gauge zone of about 1%. This corresponds to a systematic error of 0.012%. We also note that the systematic error is not affected by the mesh size.
For the actual tests a subset size of 20 pixels is used. This represents a fair compromise between measurement error and uncertainty, spatial resolution and computation time.
Fig. 5: Evolution of the performance indicators.
a)systematic error as a function of prescribed displacement.
b)displacement uncertainty as a function of prescribed displacement.
c) systematic error as a function of the prescribed strain; d) strain uncertainty as a function of prescribed strain.
IV.
EXPERIMENTAL RESULTS
IV.1. Crack initiation detection and fatigue lives
In the present study, DIC is used to determine the number of cycles to crack initiation and not to analyze crack propagation. As already mentioned, the experimental set-up allows performing DIC on both sides of the specimens.
For the sake of comparison, we chose to plot the equivalent von Mises strain field for all the tests performed with different biaxial loading types. Fig. 6 gathers the following test results according to each load case: maximum force , triaxial stress ratio T, von Mises strain field plotted on the front side of the specimen at N=10 cycles, von Mises strain field plotted at crack initiation and the displacement field at crack opening. Each test considers a load ratio ratio
R
F=F
min/F
max=0.05
. Plots of at N=10 clearlyshow that the strain field exposes a fairly symmetrical pattern, which means that the actual load is uniformly distributed. Prior to crack opening, crack initiation location is first detected by a local strain gradient, which is due to local plasticity, either on the front or back side of the specimen. We can observe that crack initiation occurs either in the gauge zone or in the transition area due to the notch effect of the radius. After a few hundreds cycles, the crack opens and a discontinuity is observed in the displacement field computed from DIC.
Fig. 6 Test results. Plots of the equivalent von Mises strain
field at the beginning of each test (N=10), at crack initiation (N=Nci) and plot of the displacement field at
crack opening (N=Nco)
The first appearance of the crack, which cannot be seen with the naked eyes and the number of cycles to crack initiation are precisely determined as images are recorded every 100 cycles. The triaxial stress ratio versus numbers of cycles to crack initiation is plotted in Fig. 7. Mean values are represented by dots while the standard deviation is represented by vertical lines. The number of cycles has been normalized with respect to the mean value of derived from compensated uniaxial tests ( ). Fig. 7 clearly shows the influence of the multiaxial stress state on the fatigue life of the material. For a triaxial stress ratio within the range [1.7 - 2] the number of cycles to crack initiation is similar and lower than in the case of a compensated uniaxial test ( ). On the contrary, fatigue life is significantly extended for triaxial stress ratio lower than 1, especially when compression is part of the loading path.
Fig. 7 Evolution of the normalized number of cycles to crack initiation with respect to the triaxial stress ratio.
Mean points) and standard deviation (error bars) are plotted
IV.2. Fractographic investigation
All tested specimens are subjected to fractographic investigation by macrographic
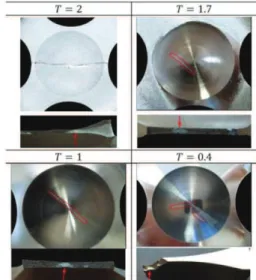
examinations, light microscope and scanning electron microscope (SEM). First, macroscopic crack orientations within the specimens are investigated (Fig. 8). For the equibiaxial tests the macroscopic crack growth occurs under about 45° to the loading axes in mode I. This orientation corresponds to the maximum shear plane. Both triaxial stress ratios of 1 and 1.73 produce crack growth also in mode I but in a plane perpendicular to the direction of the main principal stress. When compression loading is introduced (triaxial stress ratio of 0.48), the crack front is no longer a straight line and propagates with a zig-zag path as the fatigue crack growth occurs in a mixed mode (I+II). Second, from macrographic examinations of each rupture facies, i.e. by visual examination or by low-magnifications optical microscopy, crack initiation sites and crack propagation through thickness are clearly identified (Fig. 9). For all the tests, cracks originate from surface locations and propagate throughout the thickness of the specimen.
Fig. 8 Crack orientation within the cruciform specimen in respect to different stress state (triaxial stress ratio T) and macrographic observation of each rupture facies where
crack propagation is clearly visible
Investigations of the fracture surfaces are then completed using SEM, in particular at crack origins (stage I) and in the zone of crack propagation (stage II). Elemental mappings on crack initiation sites are also obtained using Energy Dispersive X-ray Spectroscopy (EDS). In all tests, SEM observations of fracture surfaces revealed crack initiation sites with a faceted-crystallographic aspect. Some quasi-cleavage facets [35] were also observed in specimens, but not in a large numbers. Crack initiation in Inconel 718 at room temperature is often observed to occur at slip bands and grain boundaries [36]. In this study, crack origins were found to be primary carbides cluster which are located within the surface layer of the specimen (Fig. 10). Cracked
carbides of dimensions equivalent to the grain size are clearly shown in Fig. 9.
Fig. 9 SEM observations of crack propagation and cracked carbides on rupture facies of cruciform specimens under in-plane biaxial cyclic loading. a) proportional equibiaxial
tension test at 95 kN; b) proportional tension-tension test at 60 kN / 89 kN
Fig. 10 Example of niobium mapping on crack initiation site obtained using Energy Dispersive X-ray Spectroscopy
(EDS). A cluster of niobium carbides is clearly visible
Regarding tension-compression tests, smeared surface structures showing signs of oxidation were frequently observed (Fig. 11). This can be explained by the shear stress component involving the friction of opposing fracture surfaces. This phenomenon greatly complicates the exact crack location determination. While tension-tension tests produce cracks that propagate radially throughout the thickness of the specimens (Fig. 9), crack growth is considered to spread out elliptically by mode II shear in the case of tension-compression tests (Fig. 11).
Finally, for every test conditions, typical fatigue striations of about 1 µm oriented perpendicular to the microscopic direction of crack propagation are revealed in the stage II area.
Fig. 11 SEM observation of a rupture facies in the case of a tension-compression test (T=0.48). Smeared surface structures and oxidized zones (dark zones) are observed.
elliptically through the thickness of the specimen
V.
CONCLUSION
A large experimental campaign at room temperature to study the biaxial-planar low cycle fatigue behavior of a newly developed nickel-based superalloy is performed.
Different stress ratios are considered and all tests share the same maximum von Mises equivalent stress. In each case, location of the first crack has been detected from DIC either on the front or back side of the specimens. The relationship between the level of stress ratio and the number of cycle to crack initiation has been clearly identified. The lower the triaxial stress ratio, the longer is the fatigue life of the material. In particular, fatigue life is significantly extended for triaxial stress ratio lower than 1 (compensated uniaxial test), especially when compression is part of the loading path.
Fractographic investigations have revealed that, first, cracks originate from surface locations and propagate throughout the thickness of the specimen and, second, that carbides or cluster of carbides may act as nucleation sites for fatigue cracks. It seems that, for the level of tested in the present study, the mechanism of fatigue crack initiation does not depend on the triaxial stress ratio. Thus the fatigue life of the material is directly related to the level of the multiaxial stress state.
ACKNOWLEDGEMENTS
The authors thank C. O’Keeffe for relevant advices and helpful comments on the manuscript.
REFERENCES
[1] D. Fournier, A. Pineau, “Low cycle fatigue behavior of Inconel 718 at 298K and 823K”, Metallurgical Transactions A, vol. 8A, pp. 1095-1105, 1977.
[2] F. Alexandre, S. Deyber, A. Pineau, “Modelling the optimum grain size on the low cycle fatigue life of a Ni based superalloy in the presence of two possible crack initiation sites”, Scripta Materialia, vol. 50, pp. 25-30, 2004.
[3] Sanders, T.H., Frishmuth, R.E., Embley, F.T., Temperature dependent deformation mechanisms of alloy 718 in low cycle fatigue, Metllurgica Transactions, 12A, 1003-1010
[4] [1] Floreen S, Kane RH. Effects of environment on high-temperature fatigue crack growth in a superalloy. Metall Trans A 1979;10A(11):1745–51.
[5] Clavel, M., Pineau, A., Fatigue behavior of two nickel-base alloys: I. Experimental results on low cycle fatigue, fatigue crack propagation, and substructures, Material Science Enginnering, 55, 157-171, 1982.
[6] Clavel, M. , Pineau, A., Fatigue behavior of two nickel-base alloys: II. Physical modeling of the fatigue crack propagation process, Material Science Enginnering, 55, 173-180, 1982.
[7] Andrieu E, Molins R, Ghonem H, Pineau A. Intergranular crack tip oxidation mechanism in a nickel-based superalloy. Mater Sci Engng 1992;A154(1):21–8. [8] Branco CM, Byrne J. Fatigue behaviour of
the nickel-based superalloy IN718 at elevated temperature. Mater High Temp 1994;12(4):261–7
[9] H. Andersson, C. Persson, T. Hansson, Crack growth in IN718 at high temperature, International Journal of Fatigue, 29, 9, 817-827, 2001.
[10] X.F. Ma, Z. Duan, H.J. Shi, R. Murai, E. Yanagisawa, “Fatigue and fracture behavior of nickel-based superalloy Inconel 718 up to the very high cycle regime”, Journal of Zhejiang Univ-Sci – Applied Physics & Engineering, vol. 10, pp. 727-737, 2010. [11] V. Zerrouki, “Inconel 718 et tenue en
fatigue oligocyclique. Influence de la microstructure et prédiction de la durée de vie”, Mémoire de DRT Génie des Matériaux, Université EVE, 2000.
[12] Bird, J.E., Duncan, J.L, Metallurgical Transactions, 12A, 235-241, 1981
[13] Andrews, J.M.H., Ellison, E.G., A testing rig for cycling at high biaxial strainJournal of Strain Analysis, 8, 168, 1973
[14] Ellison, E.G., Andrews, J.M.H., Biaxial cyclic high-strain fatigue of aluminium alloy RR58, Journal of Strain Analysis, 8, n°3, 1973
[15] Lefebvre, D., Chebl, C., Thibodeau, L., Khazzari, E., A high strain biaxial-testing rig for thin-walled tubes under axial load and pressure, Exp. Mech, 23, 384, 1983 [16] D.W. Worthem, C.J. Altstetter, I.M.
Robertson, D.F. Socie, Cyclic deformation and damage structure in Inconel 718, Biaxial and Multiaxial Fatigue, EGF 3, 1989, Mechanical Engineering Publications, London, pp. 131-143.
[17] Demmerle S. Boehler J.: Optimal design of biaxial tensile cruciform specimens. Journal of the mechanics and physics, 41(1): 143-181, 1993.
[18] Pascole, K.J., De Villiers, J.W.R., low cycle fatigue of steels under biaxial straining, Journal of strain analysis, 2, 117-126, 1967.
[19] Hayhurst, D.R., A biaxial-tension creep-rupture testing machine, Journal of Strain Analysis, 8, 119-123, 1973
[20] Kelly, D.A., Problems in creep testing under biaxial stress systems, Journal of Strain Analysis, 11, 1-6, 1976
[21] A. Makinde, L. Thibodeau, K.W. Neale, “Development of an apparatus for biaxial testing for cruciform specimens”, Experimental mechanics, vol. 32, pp. 132-137, 1992.
[22] Y. Ohtake, S. Rokugawa, H. Masumoto, “Geometry determination of cruciform type specimen and biaxial tensile test of C/C composites”, Key Eng. Mater., vol. 3, pp. 151-154, 1999.
[23] S.B. Lin, J.L. Ding, H.M. Zbib, “Characterization of yield surfaces using balanced biaxial tests of cruciform plate specimens”, Scripta Metall. Mater., vol. 28, pp. 617-622, 1993.
[24] J.S. Welsh, D.F. Adams, “An experimental investigation of the biaxial strength of IM6/3501-6 carbon /epoxy cross-ply laminates using cruciform specimens”, Composites: Part A 33, vol. 6, pp. 829-839, 2002.
[25] M. Poncelet, G. Barbier, B. Raka, S. Courtin, R. Desmorat, J.C. Le-Roux, L. Vincent, “Biaxial high cycle fatigue of a type 304L stainless steel: cyclic strains end crack initiation detection by digital image correlation”, European Journal of Mechanics / A Solids, vol. 5, 2010.
[26] P. Terriault, K. Settouane, V. Brailovski, “Biaxial testing at different temperatures of cruciform Ti-Ni samples. In: Shape Memory and Superelastic Technologies”, California, 2003.
[27] Ferron G. Makinde A.: Design and development of a biaxial strength testing device. Journal of Testing and Evaluation, 16: 253–256, 1988.
[28] Johnston W. M. Pollock W. D. Dawicke D. S.: Biaxial Testing of 2195 Aluminum Alloy Using Cruciform Specimens. Analytical Services & Materials, Inc. Hampton, Virginia, NASA/CR211942, 2002.
[29] Yong Y. Min W. Xiang-Dong W. Xian-bin Z.: Design of a cruciform biaxial tensile specimen for limit strain analysis by FEM. Journal of Materials Processing Technology, 123: 64-70, 2002.
[30] Zhang, S., Sakane, M., Multiaxial creep-fatigue life prediction for cruciform specimen, International Journal of Fatigue, 1, 1-9, 2007.
[31] A. Scholz, C. Berger, A. Samir, R. Bardenheier, “Biaxiale TMF-Simulation mit Kreuzproben zur Untersuchung des
Kriechermüdungsverhaltens von hochtemperaturewerkstoffen. Weinheim”, Wiley, pp. 280-285, 2007.
[32] Hannon A. Tiernan P. A review of planar biaxial tensile test systems for sheet metal. Journal of Materials Processing Technology, 198: 1-8, 2008.
[33] Abaqus Analysis User’s Manual v6.10. [34] Aramis software. Gom Optical Measuring
Techniques.
http://www.gom.com/EN/index.html, 2006. [35] S.P. Lynch, “Progression markings, striations, and crack-arrest markings on fracture surfaces”, Materials Sciences and Engineering A, 468-470, pp. 74-80, 2007. [36] C. Mercer, A.B.O. Soboyego, W.O.
Soboyego, Micromechanisms of fatigue crack growth in a forged Inconel 718 nickel-based superalloy, Materials Science and Engineering, A 270, 308-322, 1999.