To link to this article:
DOI:10.1080/15376494.2016.1142027
URL :
http://dx.doi.org/10.1080/15376494.2016.1142027
This is an author-deposited version published in:
http://oatao.univ-toulouse.fr/
Eprints ID:
17850
To cite this version:
Dehmous, Hocine and Duco, Fabien and Karama, Moussa and Welemane,
Hélène Multilevel assessment method for reliable design of composite
structures. (2016) Mechanics of Advanced Materials and Structures, vol.
24 (n°6). pp. 449-457. ISSN 1537-6494
Open Archive Toulouse Archive Ouverte (OATAO)
OATAO is an open access repository that collects the work of Toulouse researchers and
makes it freely available over the web where possible.
Any correspondence concerning this service should be sent to the repository
administrator:
[email protected]
Multilevel assessment method for reliable design of composite structures
Hocine Dehmousa,Fabien Ducob,Moussa Karamab,and Hélène Welemaneb'Department of Civil Engineering, Université Moulaud Mammeri,Tizi-Ouzou, Algéria; blNP ENIT-LGP, Université de Toulouse, Tarbes,France
ABSTRACT
This work aims at demonstrating the interest of a new methodology for the design and optimization of composite materials and structures.Coupling reliability methods and homogenization techniques allow the consideration of probabilistic design variables at different scales. The main advantage of such an original micromechanics-based approach is to extend the scope of solutions for engineering composite materials to reach or to respect a given reliability level. This approach is illustrated on a civil engineering case includ- ing reinforced liber composites. Modifications of microstructural components properties, manufacturing process, and geometry are investigated to provide new alternatives for design and guidelines for quality contrai.
KEYWORDS
Composite materials; design; multiscale analysis; optimization;reliability
1. Introduction
Design and optimization of composite structures generally suffer from the variability of several parameters (constituent properties, microstructural morphology, structural geometry, manufacturing process, loading conditions). In the context of deterministic approach, such a weak point is taken into account by the introduction of important safety factors. Associated
reduction of mechanical properties- above all strength- considered for calculations causes outsized geometries and
excessive costs. For a few years now, reliability-based analyses that model the random character of design properties have led to a new consideration of the risk. Reliability indicators derived by these methods (such as the failure probability) provide a
clear representation of the influence of uncertainties [l]. For composites, this significantly contributes to the develop- ment of materials and structures, regarding both design solu-
tions and maintenance programs (see reviews of Chiachio et al.
(2) and Sobey et al. [3]). Most existing approaches developed in this way aim at determining the reliability level of struc- tures according to the Joad and macroscopic parameters, such
as geometry and material strength. This helps, for instance, to determine most probable failure modes, identify driving param-
eters of failure mechanisms, estimate safety margins, compare
materials performances, or propose new design solutions (for instance (3-7]).
Associating micromechanics to the reliability framework clearly enhances such representation. Material constitutive laws derived from homogenization techniques account for the phys-
ical mechanisms involved at the microstructural scale (8-10). Introducing micromechanical arguments within probabilistic approach leads then to an enriched modeling of variabilities inherent to composites. On the one hand, the ability to rep- resent uncertainties on microscopie, macroscopic, and struc-
tural features could explain the consequences of variability of
composites from small to larger scales. Regarding that appli- cation field, micromechanical schemes are often examined and
compared to find the most suitable prediction of homoge-
nized equivalent properties of these heterogeneous materi- als/structures [8, 11-13] or used to incorporate microscale vari- ables and capture their effects on the reliability of structures [14-16]. On the other hand, the description of the physical ori- gin of the material failure deeply justifies the reliability anal-
ysis and provides a robust assessment of structures reliability.
Indeed, the lack of knowledge about the physics of the damag-
ing and failure process may become a critical issue and induce some major inconsistencies in the reliability estimation, espe- cially when considering large scale structures [2, 17].
The present work intends to demonstrate the interest of the
association of micromechanics and reliability methods regard- ing engineering design and optimization.Based on a case study
in civil engineering, new tools for reliability-based design are
presented. Special attention is given to available alternatives to achieve a reliability constraint and to guidelines derived from the analysis to improve engineering choices or quality control.
Initiated in the case of material engineering to develop new
solutions for composite materials [13, 15, 18], such methodol-
ogy is extended here at a structural scale. After a general recall of the methodology and case study, we present subsequently the design interest for a multiscale optimization. Based on the inte- gration of uncertainties at micro, macro, and structure scales,
the results and discussion focus on new design solutions pro- vided by the coupled approach.
2. General framework
Theoretical developments and implementation steps of the cou- pled approach suggested by the authors are detailed in [13, 15]. For clearness, we briefly recall here the major milestones of this type of study.
N
The first key point of the association of micromechanics and reliability methods stands in the selection of random variables
X = {X;};=t .N· They should include all variable data of the prob- lem, and possibly as much as possible of design parameters. For composites, microstructural features play an important role and should then be considered. The limitations at this stage concern the availability of the statistical distribution of random variables
and the size of the problem (number N) to avoid prohibitive calculation time. Significant random parameters of the consid-
ered problem may be identified by means of sensitivity analy- ses [l]. In this work, random variables X taken into account concern several scales of the problem (from microstructural to macrostructural data) and different aspects (mechanical prop- erties, manufacturing parameters, load).
The second step deals with the definition of the mathemati- cal fonction Grepresenting the failure scenario regarding either strength achievement or serviceability (failure domain is defined by Dt = {X, G(X) :S O}). In order to provide a sound basis for results, this requires a relevant representation of the mechanical behavior of the structure and a physical definition of the limit state. For both of these issues, the association with microme- chanics is a clear advantage: on the one hand, homogeniza- tion techniques derive the effective behavior of a representative volume element (RVE) of a heterogeneous material from the knowledge of its microstructural characteristics; on the other hand, they provide a local load sustained by constituents for a given macroscopic load.
The final stage lies in the calculation of probabilistic indica- tors, such as the probability of failure:
Pj
=
Prob(G( X ) :S 0)=
L
f
fx( X )DdX;, (1)with fx the joint probability fonction. When f x cannot be directly expressed and/or for problems dealing with a large num- ber of design variables, it is much more efficient to use numer- ical methods, especially if the coupling with finite-element simulations is required. Among them, approximation methods FORM/SORM (first-order and second-order reliability meth- ods) constitute very interesting solutions. Working in the stan- dard normal space, these methods compute by optimization algorithm the design point P* of the failure domain that exhibits
the highest failure probability. The distance between the design
point and the standard space origin is called the reliability index {3. Linear (FORM) or quadratic (SORM) simplification of the failure domain tangent to the design point finally allows esti-
mating Pf [1).
In what follows, usual intrinsic notations are employed . The tensor products of two second-order tensors a and b are defined
by:
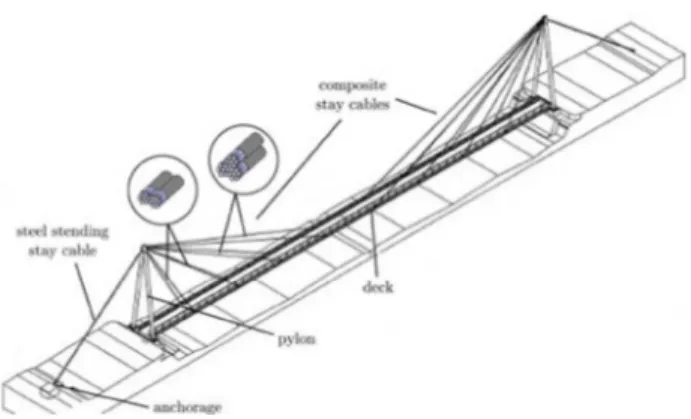
Figure 1. Structure of the Laroin footbridge.
3. Application case: The Laroin footbridge
The case study considered in this article is a civil engineer- ing structure that includes carbon fiber reinforced polymers. The innovative pedestrian footbridge of Laroin (France, 2002) is composed of a 110-m length steel deck held by composite stay
cables. At each sicle of the footbridge, eight stay cables and one steel stending cable arejoined to a steel reversed V-shaped pylon of 20.60-m height. Each stay cable includes two or three strands
of seven unidirectional cylindrical composite rods (Figure 1) [19).
So as to demonstrate the interest of the approach for the design of composite materials and structures, two types of reli-
ability investigations are presented in what follows:
• The first one called "Material;'initiated in [18) ,that focuses
on the elementary composite rod;
• The second one called "Structure;' which integrates the entire footbridge.
3.1. Materia/ study
Based on high-strength carbon fibers (Torayca T700SC-12K) and epoxy resin (Bostik Findley Eponal 401), composite rods
have been manufactured by pultrusion by Toray Carbon Fibers Europe company (mean fiber volume fraction fj of 67%). Inside the cables, each cylindrical rod (with diameter </>) issubjected to uniaxial tensile load (denoted F).
3.1.1.Mechanical mode/
The cylindrical rod corresponds to the RVE of the composite
material. Its behavior is described by means of a micromechan- ical approach, that provides both:
• the macroscopic properties (effective behavior) from the components properties and morphology; and
• the local solicitations from the correspondingmacroscopic quantities on the RVE.
In the present context, the formulation of Mori and Tanaka
[a ® b] :x = (b :x)a
[a ® b] :x
=
a . xr . br[a ® b] : x = a · x · br a ® b = ( a b + a ® b)
(2)
[20) constitutes a well-adapted constitutive framework to derive these expressions. Matrix medium corresponds here to the
epoxy resin, fibers are modeled as infinite cylindrical inclusions,
for any second-order tensor x, the term a®i = a ® a. ® a repre-
sents the ith tensor product of a tensor a. 1denotes the second-
order identity tensor.
and constituents are assumed to be isotropie (demonstration details are given in [13)). Using that scheme, the effective stiff-
ness tensor Ceff that links the macroscopic stress a and strain E
1
1 X;
-
-on the RVE (a = Cetf :t:) is thus given by: Table 1.Distribution parameters of random variables for the reference point.
(3) Study Random variables
xr.·
'
5refwith S; the elastic compliances of the epoxy resin (i
=
r) and fi.ber (i = f ):l + v; _ v;
M,S Fiber yield strength (MPa) a{ ( n) 4870 162 M,S Fiber volume fraction(%)
r,
67 0.333 M,S Active fiber fraction(%) Pact 95 0.667M,S Rod diameter (mm) cf> 6 0.03 S; = --1 0 1 - -1 0 1. E; - E; (4) M Axial load (kN) F 76 2.533
s
Weight (kN/m) w 10.650 0.355s
Exploitation (kN/m) E 8.076 0.269 E; and v; represent the Young modulus and Poisson ratio ofcon-stituents, respectively. On the other hand, the stress concentra- tion tensor (A}f of Eq. (3) relates the average local stress over the fi.ber phase (a}f and macroscopic stress:
'5(:mean value,\:standard deviation; M: Material study, S: Structure study. • Components mechanical properties: fi.ber axial yield
strength
a}
(n);(a}j
=
(A}j : Œ. (5) • Manufacturing process parameters: fi.ber volume fractionDenoting n as the unit vector in the axial direction of fi.bers, it is defined by:
fj,active fi.ber fraction Pact> rod diameter <fa;
• Load conditions: uniaxial tensile Joad F.
with
(6)
3.1.3. Failure criterion
The reliability assessment is defined as the mechanical failure of composite rods under tensile Joad. The considered limit state fonction accounts for the microstructural origin of the failure, namely, the fi.ber failure. The failure domain is thus assumed to The Eshelby tensor §, of infinite cylindrical fi.ber inclusions
within the resin is provided by (see [21] for instance): 4v - 1 §, = r (1 - n®2 ) 0 (1 - n®2 ) 8(1 - v,) 3 - 4v r (1 - n®2) 0 (1- n®2 ) 4(1 - v,)
-be reached when the maximum principal value of the average local stress over the fi.ber phase
(a}j
exceeds the fi.ber axial fail-ure strengtha
}
(n):(10) In Eq. (10),
(
a
}j
is deduced from the micromechanical mode! (Eq. 5) anda
}
(n) is a material data provided by manufacturers.+
!
2[CI -
n®2 ) n®2+
n®2 Q9 (1 - n®2 )]\)
r (I - n®2 ) 0 n®2 .
2(1 - v,) (8)
3.1.4. Simulation procedure
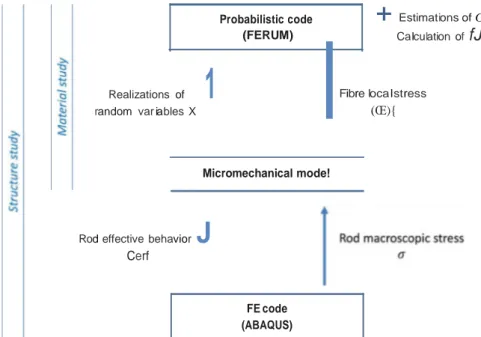
An explicit coupling between the probabilistic code FERUM Due to several manufacturing defects (fi.bers misalignment,
impregnation defects, etc.), it appears that only a part Pact :S
100% of the fi.ber fraction is involved in the mechanical response of the composite. Accordingly, the fi.ber volume fraction
fJ
appearing in the Mori-Tanakàs scheme (Eqs. 3 and 6) has been adjusted to account for the manufacturing process efficiency:(Finite element reliability using Matlab) and the micromechan- ical mode!has allowed the calculation of reliability indicators (upper part of Figure 2). Precisely, we have chosen to use the FORM approximation method, mainly for its computational efficiency. In that case, the failure probability Pj can be directly computed from the reliability index
f3.
Such a procedure requires the estimation of failure fonction G for several sets of randomfJ
--+Jj
= Pact Xft.
(9) variables. At first, FERUM thus generates realizations of ran- dom variables X = {X;};=1.s according to their individual dis-Identification of the quality parameter Pact has been doneon the pultrusion production line of Toray Carbon Fibers Europe [13].
3.1.2. Random variables
Among all design parameters entering the mechanical model, only those whose variability clearly affects the composite mate-
rial and footbridge reliability have been defined as random variables. It has been demonstrated that some properties or aspects can be considered as deterministic (for instance, com- ponents elastic properties) or neglected (for instance, matrix porosity, fi.ber elliptical shape) without modifying significantly the reliability estimation [13]. For the Material study, one has thus considered the following random variables X
=
{X;};=J ,s (Table 1):tribution law and distribution parameters. From the axial load F
and rod diameter </J, the macroscopic stress is given by Π= ;:,,
while fi.ber volume fraction
fJ
and active fi.ber fraction Pact pro-vide the stress concentration tensor (A}f through Eq. (6) and then the average local stress over the fi.ber phase (a}j
through Eq. (5). Finally, comparison of the latter witha}
(n) allows esti-mating criterion (10).3.2. Structure study
Calculation of the footbridge is based on European Civil Engi- neering Standards [19, 22]. Structural loads applied are the own weight of the structure (denoted W), the variable exploitation
Joad related to the pedestrians passage (denoted E), and the
cables adjustment forces. Regarding the mechanical modeling,
+
Realizations of
1
random var iables X
Probabilistic code (FERUM)
+
Estimations of G Calculation offJ
Fibre localstress (Œ){ Micromechanical mode!Rod effective behavior
J
Cerf
Figure 2. Interactions between probabilistic and mechanical tools.
the previous micromechanical scheme of composite rods is kept
for the study at the structure scale.
3.2.1. Random variables
It has been demonstrated that the scatter in cable adjustement forces has a neglecting effect on the probability of failure [15]. Regarding the Structure problem, six random variables X =
{X;};=J .6 have thus been considered (Table 1):
• Components mechanical properties: fiber axial yield strength
aj
(n);• Manufacturing process parameters: fiber volume fraction
fj,
active fiber fraction Pact> rod diameter </J ;• Load conditions: weight of the structure W, exploitation Joad E.
3.2.2. Foi/ure criterion
It is assumed that ail steel components of the footbridge (deck, reversed V-pylons, stending cables) exhibit an elastic behavior with high strength. While keeping the same failure fonction G
used for the Material study, failure mechanism of the footbridge
is defined as the failure of the most loaded stay cables. The latter
are cables of greater length (based on three strands, see Figure 1) when they are submitted to the most critical loading configu- ration. Severa!finite-element calculations with ABAQUS code
have shown that such a situation is induced when the variable
exploitation Joad E is applied in a centered manner on 60% of
the bridge span [19].
3.2.3. Simulation procedure
Such multiscale analysis has been performed by means of
an additional coupling between finite element code ABAQUS
and previous micromechanics-probabilistic coupling (Figure 2).
Indeed, reliability assessment of the footbridge requires sev-
eral interactions between the micro, macro, and structural
scales:
• Homogenization steps to derive the effective mechanical behavior of the composite rod Ceff and the stress concen
-tration tensor (A)f from microstructural parameters
U
J
and Pact ) through Eqs. (3) and (6);• Finite-element calculations to determine the macroscopic axial tension stress a applied to the rod according to the
geometry of the rod (</J), the composite rod effective
behav-ior Cefü and the structural Joad applied to the footbridge (W and E);
• Localization steps to derive the average local stress over
the fiber phase
(a)j
through Eq. (5) from the macroscopic stress a applied to the rod.As for the Material study, comparison of
(a)j
witha
j
(n) allowsfinally to estimate criterion (1O).
4. Micromechanical-based reliability analysis
4.1. Reference point
Deterministic and statistical data of the problem were provided
by manufacturers of composites constituents (Toray, Bostik),
composite materials (Toray Carbon Fibers Europe), and struc-
tural footbridge (Freyssinet).
Elastic properties of matrix and fiber were following: Er
=
2800 MPa, Vr
=
0.4, Ef=
230,000 MPa, Vr=
0.3. Randomvariables follow anormal law for which mean value and standard
deviation are respectively denoted
X;
and Sx,. Ali distributionparameters are detailed in Table 1and will be considered as the
reference point in what follows. Without specific data, we assume
also a normal distribution for the loads. Regarding the Material
investigation, the study is centered around the operating point
F
= 76 kN that corresponds to a security level approved in civilengineering structures
(/3
greater than 3 or, equivalently, failureprobability P1 greater than 10-3). Precisely, one obtains in this
case
13;:,fr
=
3.0514. For the Structure study, data related to theown weight W and exploitation load E are fixed, respectively, by
FE code (ABAQUS)
• Pae1 "'" r/J Il W <> E
•
•
•
•
x,.
ITable 2. Scope of the distribution parameters of random variables around the reference point.
Random variables X; sx, f
Fiber yield strength (MPa) Fiber volume fraction(%) Active liber fraction(%)
Rod diameter (mm) cr{(n)
r,
Pact <f> (4384, 5356]• [64,70]b [90, 100]c [5.8, 6.2]d [0,243.5] [0,0.5] (0,1] [0,0.05] Axial load (kN) Weight (kN/m) F w (9.052, [64.6,12.247]• 87.4]• [0,3.8] [0,0.532] Exploitation (kN/m) E (6.865, 9.288]• (0,0.404] ·± 10%;b± 5%; <± 5.:ZOA>; d± 3%; ± 15%of x;•'
;
1(0,150%] of5;.'.
1the geometry and materials of the footbridge and by European standards (19, 22]. This leads to a value
{J;
1e/
=
18.90 far abovethe previous case, since it includes a safety margin to account for anchorage effects and durability aspects.
From the sensitivity analysis provided by the FORM method, one could get some information on the origin of the scatter
in the material response and about the respective influence of each design parameter. Indeed, FORM procedure allows obtain- ing elasticities, that is derivatives of
fJ
according to distribution parameters, such as mean value ( : , ) or standard deviation ( SfxJ,aa: )
at the design point P* [l]. As said before, it helps above
-/3
/3
,
:
(%) 10.
0.
•
"'
"'"
"'" IC•
... 5 IC•
X -'r (%) IC X ."' 80 85 90 95 100 105 110 115 120(a)
1ateria
l
st
ud
y
-/3
p
;,
(%)x
.
x
rc
f (%) I 80 85 90 95 100 105 110 115 120(b)
Structur
e
st
ud
y
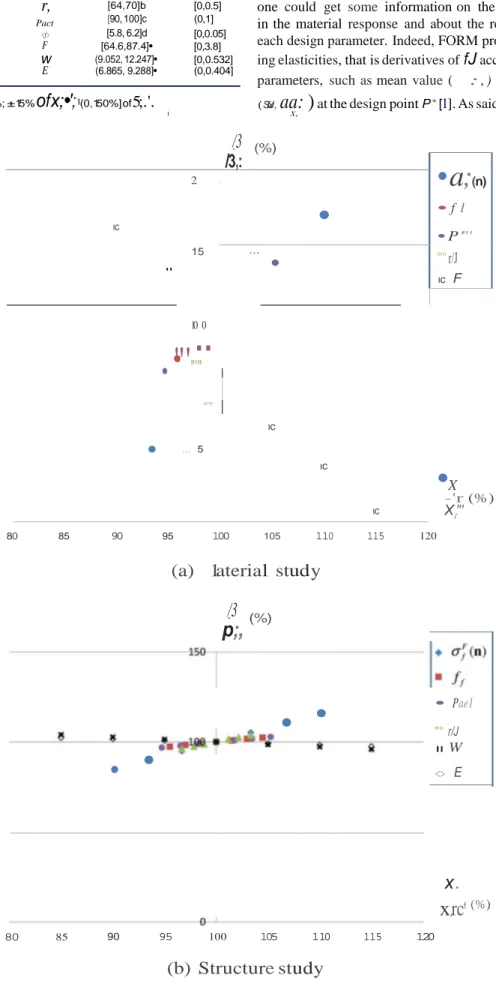
Figure 3. Evolution of reliability index f3 around the reference point with respect to the mean value
x
;1
x
;•
'of each
random variable X;.•
a
;
(n) •f 1 • P'"' "'" r/J IC F IC 2 1•
15...
..
•
"
x,
all to identify variables of the problem whose deviation has a weak influence on the reliability and that can be considered as deterministic (see details in [13, 15, 18]). Yet, such analysis is not a practical tool for engineers to bring out the consequences of design choices. We intend in what follows to illustrate an alter- native representation for reliability assessment, which highlights specific advantages of the micromechanics-based approach.
4.2. Investigation of new solutions
New design solutions are investigated by means of evolutions around the basic design of the reference point. Acceptable solu- tions should respect the materials and manufacturing machines capabilities and the model assumptions. Table 2 illustrates the
fJ
/J
,'!.,
(%)scope of the distribution parameters of variables considered in the present study (range ratio relative to the reference point is indicated for clearness). Uniform range has been assumed for the standard deviation (note that Sx, = 0 corresponds to the deterministic case).
Reliability analyses of several configurations have been per- formed. Evolution according to each distribution parameter of each random variable is considered independently, other parameters being fixed to the reference point. On the numerical point of view, explicit formulation of the Mori-Tanaka scheme and the small number of variables lead to a reasonable number of calls to fonction G for the estimation of the reliability index {3: around 50 calls to G for the Material study and between 200 and 1000 for the Structure analysis. In this latter case, the more
Il 100
s
s
(%) x, 0 50 100 150 -400fJ
/3
_
1
(%)(a)
Material
stud
y
0 50 100 150
s
s
!.r
!c
..[_ (%)(b)
Structur
e
study
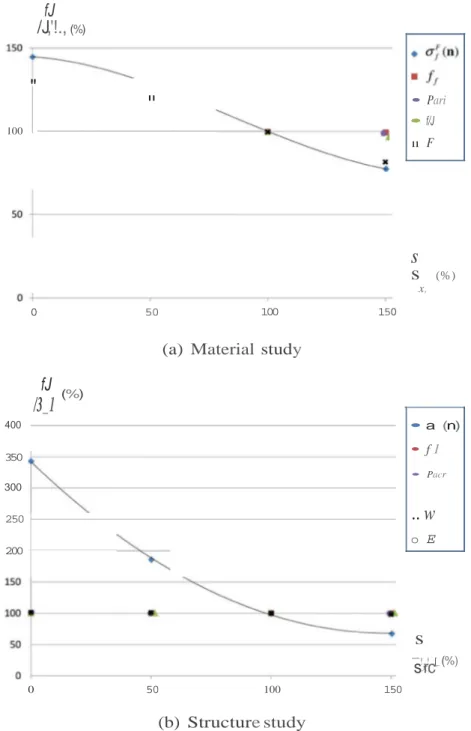
Figure 4. Evolution of reliability index f3 around the reference point with respect to the standard deviation Sx/ St of each random variable X;.
• Pari • f/J 11 F 350 300 250 200 • a (n) • f 1 • Pacr
..
w
o E•
•
important number of calls is related to the very weak failure
probability.
5. Results and discussion
The evolution of index ,B according to the mean value of each
random variable is depicted on Figure 3. An increase (respec-
tively decrease) of ,B with X; is obtained for strength variables
(resp. loading variables). For both the Material and Structure
studies, we obtain a quasi-linear evolution of ,B with respect to
mean values
X;
of random variables. A similar evolution can beobserved for
fJ
and Pact variables, which stands in agreementwith the model adjustment defined in Eq. (9). The most influ-
ential design parameters (corresponding to the steepest slopes
/31' (%)
P,,,,
of ,8-curves) differ according to the context: the most significant
influence is obtained for <jJ at the composite rod scale (Figure 3a)
and for
aJ
(n) at the structure scale (Figure 3b).For designers, such result provides guidelines to reach or to
respect a reliability level. Just focusing on the composite mate-
rial (Figure 3a), the reliability index
f3':/a
1 = 3.0514 at therefer-ence point can be increased of 15% (that is to ,B = 3.5) either
by an increase of 2% of the mean fiber yield strength (that is
with
a
j
(n) = 4970 MPa) or with an increase of 1% of the mean rod diameter (that is with <i) = 6.07 mm). Regarding now thefootbridge reliability (Figure 3b), the same increase of 2% in
aj
(n) only leads to an increase of 3% of index ,B (that is upto
,B
= 19.50) compared to,B';
/
= 18.90 at the reference point.150
"
•
•
100•
•
•
•
•
50 -•
•
0 64 65 66 67 68 69 70(a)
UJ ,
Pact )f
J (%) -200f3
/3
m"
a!
t (%).
" f f = 70%"
•
• f f = 67% 150•
•
•
• f f = 64%"
•
•
100"
•
"
•
•
50"
•
•
•
•
0 -F a1 (n) (MPa) 4300 4500 4700 4900 5100 5300 5500(b)
(uf (
n
)
ft )
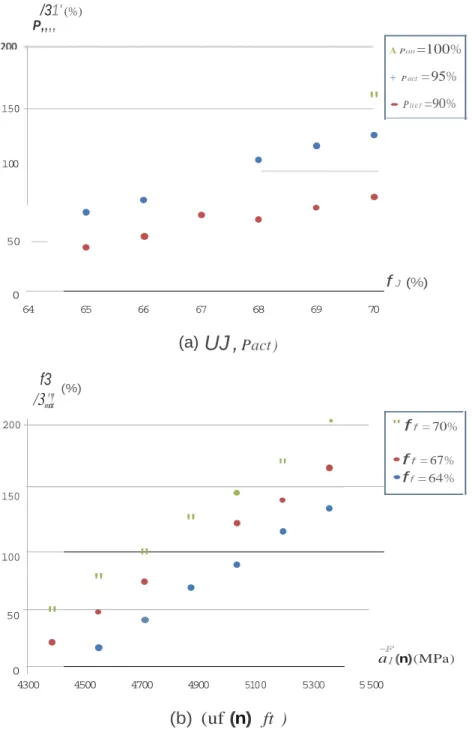
Figure 5. Material study-Cross-analyses of the evolution of reliability index fJ with respect to the mean values of couple of parameters.
A P an =100% + P act = 95%
•
.
Impact of the mean rod diameter is even lower with an increaseof 1.3% of
f3
for the same increase of 1% of efj.Such analysis provides also the safety margin related to load- ing variables. For instance, we note that an increase of 6% of
p P.';! <%>
400
350 -
---•
-the mean macroscopic load on -the rod (that is with F = 80.6
kN) leads to a decrease of 40% of index
f3
(leading to a remain-ing value of
f3
= 2). On the other hand, the structure reliabilitylevel is again less sensitive to the mean values of loads W and
•
•
300
-250
200
•
-..
E. If the micromechanics-based reliability approach allows to 150
•
•
•
•
account for the influence of multiscale parameters, this shows 100 •
-
----
.
•
that the modeling of the composite material inside its structural
application modifies the amplitude ofvariation of
f3
and, accord-ingly, the design recommendations .
..
..
..
..
0
(mm)
Considering now the effect of the standard deviation, the
influence on the reliability of the uncertainties on variables is
given on Figure 4.Obviously, more (resp. less) the variables tend
to be reproducible, more reliability increases (resp. decreases).
In agreement with the sensitivity analysis presented in [18], the
influence of the scatter on manufacturing process parameters
CJJ ,
Pact> and 1J ) can be neglected. Optimization of thestruc-ture is here mainly based on the reproducibility of the fiber yield
strength in which the /3-curves exhibit a polynomial depen-
dence. For the same mean value as the reference point, a highly
reproducible a-J (n) (with Sx; 0) can increase the reliability
index of 44% for the Material study (Figure 4a) and of 220%
for the Structural analysis (Figure 4b). For such an application
case, this result confirms then the main importance of the fiber strength in the composite performance, both regarding its mean
value and deviation. Also, the variability of the macroscopic
load F plays, as before, an important role at the material scale
(Figure 4a) but influence of the scatter of structural loads W and
E can be neglected for the footbridge (Figure 4b). This last result
is in line with safety conditions since the control over loads is
quite difficult in such civil engineering cases.
Cross-analyses between random variables provide also
extended design solutions, including combined change on
parameters at different scales. Figure S illustrates the com-
bined investigation of mean manufacturing process parameters
(namelythe fiber content and the active fiber fraction) and mean
material parameters (namely the fiber yield strength) for the
Material study. As shown on Figure Sa, the reliability index
f3
can be improved of l S% either:
• by increasing the fiber content (+2% with
j
1=
68.S%)while keeping the current manufacturing process,
• or by keeping the fiber content and improving the manu -facturing process (+2.3% of the mechanically active fiber
such that Pact = 97.2%).
Including now material features (Figure Sb), same reliability
improvement can be obtained either:
• by using fibers with higher strength (+6.4% with
aj
(n) =Sl80 MPa) and a reduced fiber content (-4.S% with
f
f =64%),
• or with an higher fiber content (+4.S% with
f
f=
70%)and lower strength fiber (-2% with
aj
(n) = 4770 MPa).Obviously, such a kind of cross-analysis can be clone also on
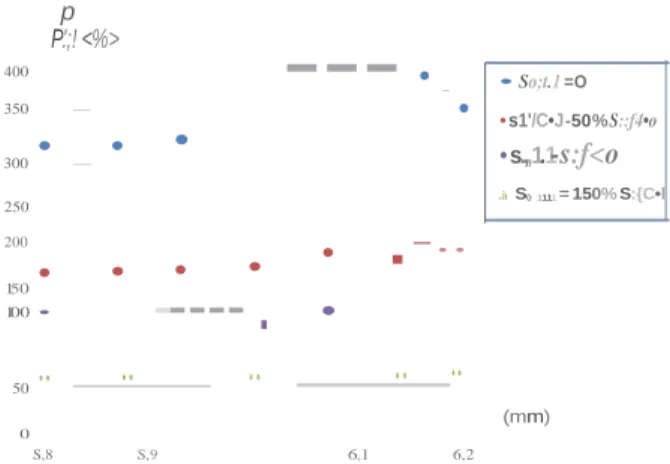
standard deviations of variables or even between mean value and deviation of different parameters according to the needs and possible actions of designers. An example on the Structure case is presented on Figure 6 with the cross-influences of the
S,8 S,9 6,1 6,2
Figure 6. Structure study-Cross-analysis of the evolution of reliability index.B with respect todistribution parameters of two variables: the mean value ofthe rod diam-eter cf> and the standard deviation of the liber yield strength
af
(n).mean value of a manufacturing process (the rod diameter) and of the standard deviation of a material parameter (the fi.ber yield strength). For such an application, one can demonstrate that the main quality effort should be put on the reproducibility of the fi.ber yield strength whatever the geometry of the rod.
6. Conclusion
Modeling the variability of design parameters is now abso-
lutely required to develop the use of composite materials. For these materials mainly governed by their microstructure, the association of reliability methods with micromechanics allows to address such issues in a relevant way. Based on two well- established frameworks, the coupled approach extends the scope
of design variables from the micro to the structural scale and
gives a physical justification to the reliability criterion.This arti-
cle has illustrated some innovative tools for design and opti- mization provided by this method. The ability to investigate
the influence on the reliability level of several features at differ-
ent scales, eventually in a combined way, provides an enriched
and efficient assessment method for structures. Modifications of components and morphology of materials, manufacturing pro- cess, and geometry can be considered and investigated, either for material optimization or structure optimization. Moreover,
results have shown the importance of the scale effect. Indeed,
reliability analysis should rely on the integration of the corn-
posite part within the whole structure to get a clear view of the
consequences of design choices. Association of such structural
reliability analysis with economic issues (including the prices of
materials and manufacturing, see [23] for instance) will provide
at the end a sound basis to fully guide optimization .
References
[l] M. Lemaire, A. Chateauneuf , and J.C. Mitteau, Structural Reliability, lst Edition, ISTE Ltd, London, 2009.
[2] M. Chiachio, J. Chiachio, and G. Rus, Reliability in composites-A selective review and survey of current development, Composites Part B, vol. 43, pp. 902-913, 2012.
[3] A.J.Sobey, J.I.R. Blake, and R.A.Shenoi, Monte Carlo reliability anal-
ysis of tophat stiffened composite plate structures under out of plane loading, Reliab. Eng. Syst. Saf., vol. llO, pp. 41-49, 2013.
•So;t.1 =O • s1'/C•J -50% S::f4•o • s.,,1.1 -s:f<o .à S0 1111 = 150% S:{C•l
•
..
50[4] D.M. Frangopol and S. Reœk, Reliability of fi.ber reinforced oompos- ite laminate plates, Probab. Eng.Mech., vol 18, pp. 119-137, 1997. [5] P.F. Liu and J.Y. Zheng, Strength reliability analysis of Aluminium-
carbon fiber/epoxy composite laminates, J. Loss Prev. Process Ind.,
vol. 23, pp. 421-427, 2010.
[6] M.R. Motley and Y.L. Young, Influence of uncertainties on the
response and reliability of se1f-adaptative composite rotors, Compos.
Struct, vol. 94, pp.114-120, 2011.
[7] H. Pang, T.Yu, and B. Song. Failure m.echanism analysis andreliability assessment of an aircraft slat, Eng. Pail. Anal., vol. 60, pp.261-279, 2016.
[8] Z. Chen, F. Yang, and S.A. Meguid, Multi-level modeling of woven
glass/epoxy composite for multilayer printed circuit board applica- tions, Int. J. Solids Struct., vol 51,pp.3679-3688, 2014.
[9] L. Dormi.eux, D. Kondo, and F.J. Ulm, Microporom.echanics, lst
Ecli-tion, W:tley & Sons, Chichester, UK, 2006.
[10] G. Soni, S. Gupta, R. Singh, M. Mitra, W. Yan, and B.G. Falzon,
Study of localized damage in oomposite laminates using micro-
macro approach, Compos. Struct.,vol 113,pp. 1-11, 2014.
[11] S.-P.Lee, J.-W. fin, and K.-W. Kang,Probabilistic analysis for
mechan-ical properties of glass/epoxy composites using homogenization
method and Monte Carlo simulation, Renewable Energy, vol 65, pp.
219-226, 2014.
[12] G. Mustafa, A. Suleman, and C. Crawford, Probabilistic microme- chanical analysis of oomposite material stiffness properties for awind turbine blade, Compos. Struct., vol 131, pp. 905-916, 2015. [13] H. Welemane and H. Dehmous, Reliability analysis and microme-
chanics: A ooupled approach for oomposite failure prediction, Int. J.
Mech. Sei., vol. 53,pp. 935-945, 2011.
[14] V:M.K. Akula, Multiscale reliability analysis of a composite stiffened
panel, Compos. Struct.,vol. 116, pp. 432-440, 2014.
[15] H. Dehmous and H. Welemane, Multi-scale reliability analysis of
composite structures-Application to the Laroin footbridge, Eng.
Pail. Anal., vol 18, pp. 988-998, 2011.
[16] A. Shaw, S. Sriramula, P.D. Gosling. and M.K. Chryssanthopoulos, A critical reliability evaluation of fibre reinforced composite materials
based on probabilistic micro and macro-mechanical analysis, Com-
posites Part B, vol 41, pp. 446-453, 2010.
[17] J. Chiachio, M. Chiachio, S. Sankararaman, A. Saxena, and K. Goebel, Condition-based prediction of time-dependent reliabil- ity in composites, Reliab. Eng. Syst. Saf., vol. 142, pp. 134-147, 2015.
[18] H. Dehmous, M. Karama, and H. Welemane, Contribution of
a micromechanics-based approach for reliability assessment, ALT 2014: Proceedings of the 5th International Conference on &:celer- ated Llfe Testing and Degradation Models, pp. 20-27, June 11-13, Pau, France, 2014.
[19] H. Dehmous, Fiabilité et micromécanique des matériaux
composites-Application à la passerelle de Laroin, Ph.D. The- sis, Institut National Polytechnique de Toulouse, Tarbes, France, 2007.
[20] T. Mori and K. Tanaka, Average stress in matrix and average elastic energy of materials with misfitting inclusions, Acta Metall., vol. 21, pp. 571-574, 1973.
[21] S. Nemat-Nasser and M. Hori, Micromechanics: Overall Properties of Heterogeneow Materials, Elsevier, Amsterdam, 1993.
[22] AFNOR, European standard NF EN 1991-1, Actions on structures,
France, 2003.
[23] C.H. Park. A. Saouab, J. Bréard, W.S. Han, A. Vautrin, and W.I. Lee, An integrated optimisation for theweight, the structural performance
and the cost of composite structures,Compas. Sei. Technol., vol 69,