Research Paper
Determination of the free-ion concentration of rare earth elements by an ion-exchange
technique: implementation, evaluation and limits
Sébastien Leguay,A Peter G. C. CampbellA and Claude FortinA,B
AInstitut National de la Recherche Scientifique, Centre Eau Terre Environnement, 490 rue de la Couronne, Québec, QC, G1K 9A9, Canada.
BCorresponding author. Email: [email protected]
Environmental context. The lanthanides are a group of heavy elements (from lanthanum to lutetium) increasingly
used in many electronic consumer products and little is known about their environmental mobility and toxicity. In natural systems, these elements will bind to natural organic matter but metal toxicity is usually defined by the free metal ion concentration. Here, we propose a method based on sample equilibration with an ion-exchange resin to measure the free lanthanide ion concentration in the presence of natural organic matter.
Abstract. An ion-exchange technique that employs a polystyrene sulphonate ion-exchange resin was developed
for determining environmentally relevant free-ion concentrations of Ce, Eu, La and Nd. Owing to the high affinity of rare earth elements (REE) for the selected resin, this method requires the addition of an inert salt to increase the concentration of the counter-ions (i.e. cations that are exchanged with REE bound to the resin). The use of a batch equilibration approach to calibrate the resin allowed the implementation of the ion-exchange technique at reasonably low ionic strength (I = 0.1 M). Several ligands were used to test the selectivity of the method, which proved to be highly selective for the free metal ion in presence of the tested cationic and anionic complexes (REE–nitrate, REE– malic acid and REE–nitrilotriacetic acid systems) and operational for very low proportions of REE3+, owing to the strong REE–resin interactions. The ion-exchange technique was also implemented to determine [Eu]inorg in the presence of natural humic matter (Suwannee River Humic Acid) and the results were compared with those obtained using dialysis bags and those calculated with chemical equilibrium models. At pH 4.00, the measured [Eu]inorg values were in fairly good agreement with those predicted with the Windermere Humic Aqueous Model and Stockholm Humic Model, whereas the Non-Ideal Competitive Absorption model appeared to underestimate the [Eu]inorg. However, the inorganic europium concentrations were strongly underestimated (4 < [Eu]inorg, IET/[Eu]inorg, calc < 18) with the three prediction models at higher pH (5.3 and 6.2).
EN15136 S. Leguay et al.
Free lanthanide ion concentrations measurements
Introduction
The lanthanides, commonly known as rare earth elements (REEs), are a group of heavy elements (from lanthanum to lutetium) displaying similar chemical behaviour but various physical properties. The latter characteristic makes them attractive in many industrial applications, and they are already used in many current technologies (e.g. television, computers).[1] Moreover, the interest in these elements has grown considerably with the emergence of renewable technologies, such as wind turbines, hybrid vehicles or photovoltaic thin films.[2] Modern mining ventures need to mitigate environmental impacts and it is essential to be able to assess the toxicological risks of the REEs for aquatic biota.
The key role of the free-ion species (Mz+) as a predictor of the bioavailability and toxicity of metals has
been well established for many divalent cations (Cu2+, Zn2+, Cd2+, Pb2+).[3] Recently, the toxicity of trivalent lutetium (Lu3+) to a marine bacterium (Vibrio fischeri) in the presence of several synthetic ligands was successfully explained by the free-ion activity model.[4] Predictions of this model may sometimes deviate from the experimental results in the presence of some natural ligands, such as amino acids[5] or the hydroxyl ion,[6] but several studies performed under field conditions have shown that the free-ion activity ([Mz+]) remains a key parameter for predicting metal bioaccumulation processes.[7–10]
Lanthanide free ion concentrations ([REE3+]) can be estimated using a computer speciation model (e.g. the Windermere Humic Aqueous Model or WHAM),[11] but the results are sensitive to the quality of the thermodynamic data and the input parameters (e.g. competitor cations, fraction of active humic
substances).[12,13] Moreover, such computer programs are in constant evolution and require validation by comparison with analytical results. However, analytical methods used for this purpose in the past for the lanthanides have relied on size-exclusion approaches, which do not allow one to distinguish between the REE bound to inorganic or small organic ligands (with molecular masses lower than 3 to 5 kDa) from the free lanthanide ion (REE3+).[14] This limitation is due to the lack of specific analytical techniques to determine [REE3+] at environmentally relevant concentrations. Some research has investigated the possible use of ion selective electrodes (ISE) for the lanthanide ions, but the proposed electrodes remain at the development stage and are not sensitive enough for environmental applications.[15] In the case of divalent ions (Ni2+, Cu2+, Zn2+, Cd2+ and Pb2+), more selective techniques have been developed to meet these environmental constraints. Among them, the permeation liquid membrane (PLM) technique, the Donnan membrane technique (DMT) and the equilibrium ion-exchange technique (IET) appear as the most promising methods because they offer the possibility of dealing with several metals simultaneously.
The IET is very attractive owing to its low cost. Moreover, it has been tested in comparative studies that were carried out under laboratory and field conditions, involving Cd, Co, Cu, Ni and Zn, and in the presence of many synthetic or natural ligands.[16–20] This technique is based on establishing an equilibrium
between the free metal ion contained in solution and the binding sites on the resin, in the presence of competitor cations (e.g. Na+, Ca2+, Mg2+). The resin can be equilibrated with the solution in two ways: in a column (flow-through) or in a batch equilibration approach.[21] The first approach involves passing the solution through a column containing the cation-exchange resin until equilibrium is reached. The second consists of allowing contact between a fixed volume of the sample with the resin for a period long enough to attain equilibrium. For the column equilibration approach, changes in metal concentration and
speciation can be avoided by passing enough solution through the column until equilibrium is achieved. However, the volume required to equilibrate the resin greatly increases with the metal affinity for the resin. In contrast, the batch equilibration approach allows equilibration of the resin with a small volume of solution, but the concentration of metal in solution will decrease and the amount of metal bound to the resin will reflect the metal speciation after equilibrium with the resin. The extent of equilibrium perturbation depends on the degree of metal complexation and the affinity of the metal for the resin.[21] For both approaches, problems may be overcome by increasing the concentrations of the competitor ions or reducing the resin mass.[17,22]
The objective of the present work was to evaluate the capacity of the IET to determine the free-ion concentrations of trivalent lanthanides (La3+, Ce3+, Nd3+ and Eu3+), while dealing with the above-mentioned experimental constraints. The column equilibration and batch equilibration techniques were compared in order to select the more appropriate approach. The two approaches were tested by using model ligands and their operating limits are discussed. The free Eu ion concentration ([Eu3+]) was determined in the presence of Suwannee River Humic Acid (SRHA) and the results were compared with those obtained by using equilibrium dialysis and with thermodynamic equilibrium models.
Experimental methods
Reagents, sample preparation and general protocols
Prior to use, all plasticware was soaked in 10 % HNO3 v/v for at least 24 h, rinsed a minimum of five times with deionised water and three times with ultrapure water (18 MΩ cm, MilliQ3O/Milli-Q2 system, Milli-Q Gradient A10, Bedford, MA) before being dried under a Class 100 laminar flow hood. All handling was carried out with powder-free latex gloves in order to minimise any contamination. All stock and exposure solutions were prepared with ultrapure water. All chemicals were at least of analytical grade. A stock solution of humic acid (HA) was prepared by dissolving the SRHA Standard II from the International Humic Substances Society (catalogue number 2S101H, USA) in 0.01 M NaOH solution. This solution was then kept at room temperature in the dark for 24 h before being filtered through a polyethersulphone filter membrane (PES, 0.45 μm, VWR). The concentration of humic acid of the stock
solution was determined by total organic carbon analysis (TOC-5000A, Shimadzu). The stock solution was then kept in the dark at 4 °C to prevent humic acid degradation by photooxidation.
Stock and intermediate solutions of the REE were acidified with HNO3 to pH 2.0 to prevent losses of the REE from solution by adsorption or precipitation. All other stock solutions were prepared by
dissolving the appropriate amount of reagents in ultrapure water. Given the highly hygroscopic nature of perchlorate sodium salts, the concentration of the NaClO4 stock solution (~1.6 M) was verified by gravimetric titration. In order to avoid localised formation of lanthanide hydroxide precipitates, the exposure solutions were adjusted to the desired pH with 2 % v/v HNO3 (trace metal grade) or 1 M NaOH (prefiltered <0.45 μm with a PES filter membrane) before adding an aliquot of the lanthanide stock (or intermediate) solution. When the addition of the aliquot had an effect on the pH value, the solution was readjusted with 0.01 M NaOH. All exposure solutions were then left to equilibrate at least overnight before being filtered with polycarbonate membrane filters (<0.20 μm, Millipore) and then kept in polypropylene (PP) or high density polyethylene (HDPE) containers (Nalgene).
The pH of the exposure solutions was measured before and after equilibrium experiments with a glass combination electrode (Fisher Scientific Accumet Gell-filled Polymer Body pH/ATC double junction) plugged into a radiometer pH meter (PHM210). The glass electrode was calibrated using pH standard solutions (National Institute of Standards and Technology - NIST certified, Fisher). When necessary, exposure solutions were readjusted to the desired pH with 0.01 M NaOH before initiating resin equilibrium experiments. No pH buffer was used in order to avoid possible formation of REE–buffer complexes.[23] REE concentrations in all exposure media were determined by inductively coupled plasma mass spectrometry (ICP-MS). The ICP-MS (Thermo instrument model X7, Waltham, MA) was calibrated using standard solutions (140–051–631, SCP Science, Montreal) and the accuracy of the calibration curve was checked using a certified multielement solution (C00–061–406, SCP Science). The correction for the signal drift of the ICP-MS was performed through the use of an internal standard (Rh) and the monitoring of the REE concentrations of the certified multielement solution. Measured concentrations of the
multielement solution were always within 10 % of the certified values. The limit of quantification (LOQ) was: from 50 to 168 pM for La, from 48 to 253 pM for Ce, from 44 to 123 pM for Nd, and from 34 to 126 pM for Eu (LOQ = [Blank] + 10 × [s.d.blank]).
Standard additions were also performed to ensure there was no matrix effect. The polystyrene sulphonate exchange resin (Dowex 50W-8X, 50–100 mesh, Sigma) was treated before use to remove inorganic and organic impurities, as described by Cantwell et al.[21]
IET methods General theory
The ionic exchange technique is based on the equilibrium between binding sites of a cation exchange resin (R), trace metal ions (
M
z1) and all major cations (Catz2; e.g. Na+, Ca2+) that are contained in the solution of interest. This reaction can be described as follows: 2 1 2 1 R Cat R M Cat M 2 1 2 1 z Z z Z z z z z (1) 2 1 2 1 1 1 ] Cat R [ ] M [ ] Cat [ ] M R [ z 2 C IE z z z z z z é K (2) where C IE
K
= the cation exchange equilibrium constant; [R M] 1z = the concentration of the resin active sites occupied by a trace metal ion (mol g–1); [R Cat]
2
z = the concentration of the resin active sites occupied by major cations (mol g–1);
1
z
= the charge of a trace metal ion; andz
2 = the charge of major cations. If concentrations of major cations (counter-ions) are high enough, the exchange of the trace metal ion does not significantly affect the concentrations of major cations on the resin. In that case, the] M /[ ] M R [ 1 1 z
z ratio, called the distribution coefficient ( M
pH I,
λ ; expressed in L g–1), does not depend on the trace metal concentration. In other words, for given electrolyte conditions, this ratio remains constant whatever the free metal ion concentration. Thus, a distribution coefficient that has been measured with solutions of known
[
M
z1]
(calibration solution) can be used to determine the free ion concentrations of all solutions with the same electrolyte conditions (the influence of concentration and nature of major cations and pH is described elsewhere[20]), based on the concentration of trace metal bound to the resin according to the following equation:
z1
2 1 M oH I,M
R
M
λ
z Z
(3)Trace metal conditions can be considered to be satisfied when the sites occupied by major cations (counter-ions) far exceed those occupied by the trace metal ion ([Rz1M]/[Rz2Cat]1%). The choice of a cationic resin with a quite low selectivity for the metal, such as a resin functionalised with sulphonate groups, allows this condition to be achieved with fairly low concentrations of counter-ions.
Column equilibration approach
The experimental setup for the miniaturised IET is described in detail in a previous publication.[17] Briefly, the required solutions are selected by computer-controlled six-way rotary valves (Bio-Chem Fluidics) and carried to a column containing ~9 mg (precisely weighed) of dried resin by a peristaltic pump (Minipuls 3, Gilson). In the column equilibration experiments, the resin was: (1) rinsed by passing 1.5 M HNO3 for 4 min using a flow rate of 5 mL min–1 through it; (2) converted to the sodium form by passing 1.0 M NaOH for 4 min at 5 mL min–1; (3) rinsed with ultrapure water for 10 min at 5 mL min–1; (4) pre-equilibrated by passing 50 mL of the electrolyte solution at 2 mL min–1; and (5) exposed to 300 mL of sample at a flow rate of 0.5, 2 or 5 mL min–1. The resin was then rinsed with ultrapure water at 5 mL min–1 for 30 s. Once ultrapure water had been flushed from the experimental assembly, REEs
adsorbed on the resin were eluted with ~10 mL (volume precisely determined by differential weighing) of 1.5 M HNO3 with a flow rate of 0.5 mL min–1. This last step was repeated three times to ensure that all REEs had been eluted from the resin (between 95 and 98 % of REEs adsorbed on the resin were generally eluted within the first 10 mL). Note that a very small part of the sample may still be trapped in the smaller interstices after the rinsing step. However, this is only likely to affect the results when the [REE]/[REE3+] ratios are very high. For each experiment, the REE concentrations in the solutions entering and exiting the column and in the eluates were determined by ICP-MS analyses. In addition, the pH of the exposure solution after passing the sample through the resin was checked just before the elution step.
The concentration of REE bound to the resin was calculated with the following relation:
r eluate eluate tot, 3REE
REE
R
m
V
(4)where: [R3REE] = the quantity of REE adsorbed to the resin (mol·g–1); [REE]tot,eluate = the
concentration of REE in the eluate (mol L–1);
V
eluate = the volume of the eluate (L); andm
r = the mass of the cationic resin (g). Therefore, free lanthanide ion concentrations [REE3+] (mol L–1) or distribution coefficient can be calculated with Eqn 5 by combining Eqn 3 and Eqn 4:
r Eu pH I, eluate eluate tot, 3 REE REE m V
(5) Batch-equilibration approachOne of the key variables for the IET is the preconditioning of the resin. Thus, the sequence of the batch equilibration approach was developed with the aim of reproducing as far as possible the conditions that were used for the column equilibration approach. Thus, the resin was precisely weighed (~9 mg) in a
50-mL polypropylene centrifuge tube (Sarstedt) and successively put in contact with the required solutions according to the following sequence: (1) 10 mL of 1.5 M HNO3 for 4 min; (2) 10 mL of ultrapure water for 30 s; (3) 20 mL of 1.0 M NaOH for 4 min; (4) 10 mL of ultrapure water for 30 s; (5) 10 mL of electrolyte solution for 2 min (five times); (6) 50 mL of sample until equilibrium was reached. In batch experiments, step 6 was performed only once, whereas it was repeated six times in the repeat-batch approach (i.e. a maximum volume of 300 mL was arbitrarily chosen). The times indicated in the above sequence mean the times during which the solutions were shaken using a wrist-action shaker (Wrist Action® Burrell, VWR). Preliminary experiments performed in the presence and absence of humic acid showed that equilibrium with the sample (step 6) was reached after 24 h based on observations made at 5, 24, 72 and 168 h (see Fig. S1 in the Supplementary material). The tubes were wrapped with aluminium foil for all experiments involving the humic acid to avoid any potential photooxidation.
Between each step, the resin was centrifuged (1500 rpm; 500 g; 21°C) for 10 min and the supernatant solution was carefully removed with a 10-mL pipette, taking care not to remove any resin beads from the tube. For each experiment, the total concentration of the REE was measured before and after equilibrium had been reached. Indeed, when a small volume of solution is in contact with the resin, a ‘new’
equilibrium is reached in solution due to the decrease in REE concentration as the metal ions
progressively bind to the resin. In the rest of the text, the decrease of the REE concentration due to the resin is referred to as equilibrium disturbance (or perturbation). The REE concentrations were determined by ICP-MS analyses. The concentration of the REE bound to the resin was calculated by using the mass balance:
r sol eq tot ini tot 3REE
REE
REE
R
m
V
(6) where ini tot ] REE[ = the initial concentration of the REE (mol L–1); eq tot ] REE
[ = dissolved lanthanide concentration at equilibrium (mol L–1); and
sol
V
= sample volume (50 mL). The combination of Eqn 3 and Eqn 6 leads to the relation between the initot ] REE
[ after contact with the resin and the distribution coefficient of the REE:
r REE pH I, sol eq tot ini tot eq 3REE
REE
REE
m
V
(7)When a large proportion of the REE is associated with a ligand in solution, the initial and equilibrium concentrations may be indistinguishable within experimental accuracy. In that case, the concentration of the REE bound to the resin can be calculated with Eqn 4, where the REE concentration in the eluate is
determined after the following additional steps: after being rinsed two times with 10 mL of ultrapure water; the resin is placed in contact with 10 mL of 1.5 M HNO3 for 5 h. This last step is repeated three times for a total run time of 15 h and total elution volume of 30 mL. Between 90 and 96 % of the REE adsorbed on the resin was generally eluted within the first 10 mL and ~99 % with the second elution.
Equilibrium dialysis method
The equilibrium dialysis experiments were performed using 5-mL cylindrical dialysis bags with a molecular mass cut-off of 100 Da (Float-A-Lyzer®G2, Spectra/Por, Cole Parmer). In order to
precondition the membrane, the dialysis bag was pretreated as follows: (1) filled with isopropanol (10 % v/v) and submerged in the same alcohol solution for 10 min to remove glycerine; (2) thoroughly flushed with ultrapure water; and (3) filled and submerged in ultrapure water for 15 min (this step was repeated at least two times). In a typical experiment, a 250-mL polypropylene cylindrical jar (Thermo Scientific Nalgene, Fisher) was filled with 200 mL of a solution containing 2 mg C L–1 SRHA, various europium concentrations and all the components of the electrolyte solution: 0.1 M NaNO3 and the major ions of the MHSM-1 mixture (Modified High-Salt Medium for algal growth; [K+] = 2.22 mM; [NH
4+] = 937 μM; [Mg2+] = 81.2 μM; [SO42–] = 81.2 μM; [Ca2+] = 68.0 μM). The dialysis bag was filled with the electrolyte solution and submerged in the jar (using a flotation ring). The jar was then sealed and placed in an opaque box to protect the humic acid from light. Finally, the box was placed on an orbital shaker until osmotic equilibrium was reached between the solutions outside and inside the dialysis bag. Substances with a molecular mass lower than 100 Da, such as the free europium ion and inorganic and small organic europium complexes, diffuse through the permeable membrane until their activities inside the bag equal those in the outside solution. In contrast, substances with a molecular mass larger than 100 Da, such as almost all metal–SRHA complexes, are retained outside the bag. The SRHA from the International Humic Substances Society contains very few humic acids with a molecular mass lower than 500 Da and almost no humic substances with a molecular mass lower than 100 Da.[24] Given the low SRHA concentrations used in our experiments, the contribution of these substances was considered to be negligible. We thus assume that the dialysis bags contained only inorganic europium species, whereas both organic and inorganic europium species were present in the outside solution. Preliminary experiments performed over a period of 5 days showed that equilibrium was reached within the first 24 h (n = 3). In order to evaluate europium adsorption on the experimental device, additional experiments (n = 3) were performed
according to the method described above but without humic acid, also over a period of 5 days. The results obtained showed a small loss of the total dissolved europium concentration (~5 ± 1 %) due to adsorption. With humic acid, no loss of dissolved europium was observed. Note that the dialysis bags were only used for experimental conditions under which the proportion of the inorganic europium (Eu3+ + EuNO
expected to be higher than 5 %. Under such conditions, dialysis experiments can be easily carried out over a wide range of environmentally relevant europium concentrations with the certainty that the free europium concentration (inside the bags) does not fall below the detection limit.
Calculation of metal speciation
For the experiments performed in the presence of the model ligands (NTA, nitrilotriacetic acid; Mal, malic acid; Cit, citric acid), free-ion concentrations of REEs were calculated using both MINEQL+ 4.62[25] and Visual MINTEQ version 3.1 computer programs.[26] The thermodynamic data for the
MINEQL+ 4.62 software were mainly from Martell et al.,[27] which have been extrapolated to zero ionic strength using the Davies equation (b = 0.3). The other information sources[28–30] are indicated in Table 1. The default thermodynamic database was used for the calculations performed with the Visual MINTEQ computer programme, except for Ce-NTA and Ce-Mal (missing in the database) and Eu(OH)(NTA)– complexes (because an obvious error was noted: log KEu(OH)(NTA) = 20.08). For the cited complexes, the data listed in Table 1 were also used with Visual MINTEQ.
In the present work, NO3 ion concentrations were fairly high (0.1–0.5 M) and the REE(NO3)2+ complex fraction was not negligible. In practice, the REE concentration measured at equilibrium allows the determination of the overall distribution coefficient of the REE (
D
I,REEpH3 = the distribution coefficient when the speciation of the REE is not taken into account), as follows:r eq inorg REE pH I,
]
REE
[
3m
D
(8)where [REE]eqinorg refers to the concentration of inorganic REE species (REE3+ + REE(NO
3)2+). Then, the REE
pH I,
value is calculated using the molar fraction of REE (xREE3) obtained with MINEQL+ 4.62 (Table 2). 3 3 3 REE REE pH I, REE pH I, x D
(9)The WHAM model version 7.0[11]) and the SHM (Stockholm Humic Model) and NICA Donnan (Non-Ideal Competitive Adsorption) models (available in Visual MINTEQ 3.1) were used to calculate the proportion of europium binding by the SRHA. The dissolved organic matter to dissolved organic carbon ratio was considered to be equal to 1.90.[31] Activity coefficients were calculated using the Davies equation with all software programs.
Results and discussion
Repeat-batch v. column equilibration approaches (Eu) Repeat-batch equilibration approach
Method description. In a first set of experiments, we used a column equilibration approach with the 0.1 M NaNO3 medium but equilibrium was not reached after the resin had been in contact with 300 mL of the calibration solution (more details are available in Supplementary material B). This result is due to the slow kinetics of exchange of Eu with Na bound to the resin.
The repeat-batch approach consists of repeating the batch equilibration step with the same resin (without any intervening elution step) with successive volumes of the same (fresh) calibration solution. This approach allows the construction of a breakthrough curve corresponding to the minimum volume required to reach equilibrium. This was carried out (as described in the Experimental section) to
overcome the long equilibration times encountered with the column equilibration approach. The europium concentration remaining in solution at equilibrium ( eq
tot ] Eu
[ ) was plotted as a function of the volume of the calibration solution that had been equilibrated with the resin (Fig. 1a). In 0.1 M NaNO3 medium, ([Eu]initot = 7.8 × 10⁷ M), only 2 % of the total dissolved europium remained in solution ( eq
tot ] Eu
[ = 1.6 × 10⁹ M) when the resin was equilibrated with 50 mL of the calibration solution. The eq
tot ] Eu
[ increased as the resin was in contact with successive volumes of the fresh calibration solution, but even after six successive equilibrations (300 mL total solution), ~90 % of the europium was still captured by the resin ( eq
tot ] Eu
[ =
7.7 × 10⁹ M). This result indicates that a very large volume of solution would be required to satisfy the requirement that eq tot ] Eu [ = ini tot ] Eu [ .
Additional experiments were performed with higher concentrations of counter-ions (0.3 and 0.5 M NaNO3) to determine the electrolyte conditions that would allow this criterion ([Eu]eqtot =
ini tot ] Eu
[ ) to be attained with a reasonable volume of the calibration solution. A considerable increase of the ionic strength was required to obtain eq
tot ] Eu [ = ini tot ] Eu
[ with less than 300 mL (150 mL in the 0.5 M NaNO3 + 2.5 × 10³ M Ca(NO3)2 medium).
Ionic strength and Eu pH I,
. As expected, Eu pH I,
values decreased with the increase of the counter-ion concentrations (Table 3), as has been observed in previous work involving several metal ions such as Zn,[17] Cu[17] or Ni.[21,22] However, at constant ionic strength, the EupH I,
values remained constant as]
Eu
[
3 increased (Table 3). Thus, even if eq tot ] Eu[ differs from ini tot ] Eu
determined in all tested media (at constant I) can be used for determining
[
Eu
3]
in the presence of ligands. However, as can be noted in Table 3, the
EuI,pH value was ~2 orders of magnitude higher for the 0.1 M NaNO3 + 0.5 × 10³ M Ca(NO3)2 medium than for the 0.5 M NaNO3 + 2.5 × 10³ M Ca(NO3)2 medium, whereas the ionic strength was only two times lower. Considering that calcium, sodium and magnesium concentrations in natural fresh water range from 0.3 to 3, 0.3 to 4.0, and 0.1 to 1.0 mM[32] respectively, the implementation of the IET for the lanthanides under environmental conditions without adding inert salts appears difficult in comparison with divalent metals.[20]Approach selection
Comparison of the column and repeat-batch equilibration methods. In order to ensure the ‘equivalence’ of both methods, we attempted to calibrate the cation-exchange resin using the 0.5 M NaNO3 + 2.5 × 10³ M Ca(NO3)2 medium, with a slow flow rate of 0.5 mL min–1 (to maximise the Eu exchange between the resin and the solution). As anticipated from the results of the repeat-batch
experiments, equilibrium was reached after ~150 mL of calibration solution had been passed through the column (Fig. 1b). Considering the high ionic strength used here, this represents a quite large volume, reflecting strong interactions between the cationic resin and Eu. For comparison, Vigneault and Campbell[33] reached equilibrium with 160 mL of a Cd solution containing a counter-ion concentration approximately 50 times lower ([Na+] = 104 M; [Ca2+] = 2.5 × 10⁴ M and [Mg2+] = 1.5 × 10⁴ M) than in the present work; and only 100 mL of solution was required in an algal growth medium (I = 20 meq L–1) in the case of Ag+.[34]
The Eu pH I,
determined at two different Eu concentrations agreed well with the mean value obtained in the repeat-batch experiments (last line of Table 3). These results indicate that both approaches are comparable, as long as the resins have been preconditioned in the same way. The choice between the two approaches is thus a matter of compromise. The column equilibration method reduces the risk ofexperimental errors (e.g. resin loss when the supernatant solution is removed in the repeat-batch process) and, once the equilibrium has been reached, does not disturb the chemical equilibrium between the ligand and Eu3+.[21] However, for environmental applications (e.g. for natural surface waters or for exposure media for ecotoxicological studies), it is important to reduce, as much as possible, the ionic strength so as to limit its effects on metal speciation. Moreover, in the case of lanthanides, correction of ion activity coefficients using the Davies equation is not recommended by the OECD-AEN (Organisation for Economic Co-operation and Development – Nuclear Energy Agency) guidelines for ionic strengths greater than 0.1 M.[35]
To evaluate the volume of solution required to reach equilibrium in the 0.1 M NaNO3 medium, we propose a very simple model that only requires the DI,EupH value (determined with the batch experiments),
sol
V
,m
r and the Eu mass balance at equilibrium (Eqn 10):
r eq, 3 sol eq, tot eq,Eu
V
R
Eu
m
n
i
i
i
(10)The value of
Eu eq,toti (mol L–1) after i equilibration steps between the resin and a fixed volume ( solV
, L) of the fresh calibration solution can be calculated from the molar quantity of europium (neq,i, mol) by combining Eqns 10 and 3:
r Eu pH I, sol eq, eq, tot Eu m D V n i i (11)At the first equilibration step (i = 1), one takes:
solini tot
eq,1
Eu
V
n
(12)For the other steps, the molar quantity can be determined by the following equation:
r 1 , eq 3 sol ini tot eq, Eu V R Eu m n i i (13)where the eq, 1 3Eu] R
[ i (L g–1) is the europium adsorbed on the resin at the step i – 1. The model was applied to predict
[
Eu
]
eq,i/[
Eu
]
ini for the different electrolyte conditions tested in the repeat-batch experiments (Fig. 1a). The variation of the predicted[
Eu
]
eq,i/[
Eu
]
ini agreed with the experimental values for the four electrolyte conditions. The model can thus be used to estimate the minimum volume required to equilibrate the resin using the column equilibration approach. Eqns 11–13 were used to calculate
eq,i totEu for each time the resin is in contact with a fixed volume (V = 50 mL) of the fresh calibration solution until we found
Eueq,toti =
Eu initot. It was estimated that at least 15 or 6 L of the calibration solution would be required for calibrating the resin with the 0.1 M NaNO3 or the 0.1 M NaNO3 + 5.0 × 10⁴ M Ca(NO3)2 media respectively. Given these very large volume requirements to reach equilibrium with REEs, the use of the repeat-batch method appears more reasonable from a logistical point of view, even if it involves dealing with the chemical equilibrium disturbance.Determination of REE3+ concentration in the presence of ligands Method validation and limits
Resin selectivity. In order to evaluate the resin selectivity for the free ion species, the Eu overall distribution coefficient ( Eu3
pH I,
D
) was measured in NaClO4 and NaNO3 media at 0.1 and 0.5 M ionic strength. Assuming that the proportion of europium bound as the EuClO42+ complex is close to zero (
3 3 4 Eu pH I, Eu pH , NaClO
D
), the free Eu3+ proportion in the NaNO3 medium was theoretically calculated using the 3 3 3 4 Eu pH , NO Eu pH , NaClO
D
D
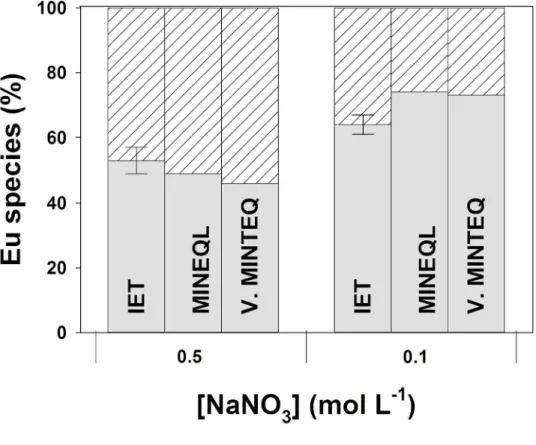
ratio. Only slight differences were observed between the experimentally determined and theoretically calculated Eu3+ proportions (Fig. 2: from –8 to –10 % at I = 0.1 M and from 4 to 9 % at I = 0.5 M), suggesting that interactions between the cationic EuNO32+ complexes and the resin are very weak (negligible). This test was only performed for Eu because the formation constant for EuNO32+ was considered to be more reliable than those for LaNO32+, CeNO32+ and NdNO32+.[27]For the rest of the present work,
REEI,pH3 values for La, Ce, Nd and Eu have been calculated with Eqn 9 and the data listed in Tables 2 and 3. The given values of [REE3+] (experimental and calculated) thus depend on the formation constants of these nitrate complexes and are subject to change if new estimates of these constants become available in the future.Resin calibration. Distribution coefficients for Eu,
EuI,pH3, were determined over the pH range from 3.78 to 6.87 in the presence and absence of La, Ce and Nd (in MHSM-1 medium + 0.1 M NaNO3). The presence of the other lanthanides had no effect on the
EuI,pH3 value, indicating that the IET can be used with natural waters in which all lanthanides occur together. However, the
EuI,pH3 values determined were surprisingly scattered for 6.00 < pH < 6.87, with values ranging from 26 to 539 (see Fig. S3 in the Supplementary material). Fortin et al.[18] observed poor reproducibility in the calibration for Cu at pH values higher than 7.5, and suggested that this may be caused by the binding of the Cu(OH)+ species to the resin. In the present study, this hypothesis cannot explain the dispersion of the
EuI,pH3 values because the proportion of EuOH2+ species should be negligible under the experimental conditions (2.5 %). Lead et al.[36] also observed a decrease in the Eu distribution coefficient at pH > 6.00, which is inconsistent with the thermodynamic data available in the literature. We hypothesise that the formation of unidentified colloidal forms of Eu may explain the calibration difficulties at pH > 6.00. Indeed, in a recent study using single-particle inductively coupled plasma mass spectrometry (SP-ICP-MS), El-Akl et al.[37] have clearlyshown the presence of cerium nanoparticles at pH > 6.00 in the absence of complexing ligands, which is not predicted by thermodynamic calculations ([Ce]tot ~3.6 × 10⁸ M).
Despite the variability of the results with Eu above pH 6.0, we assumed that
REEI,pH3 values do not vary with pH. To verify this hypothesis, the distribution coefficient values for La, Ce, Nd and Eu weredetermined over the pH range from 3.78 to 5.55 (Table 3). These values were then used for determining the free-ion concentrations of La, Ce, Nd and Eu in the presence of model ligands, even at pH > 6.0.
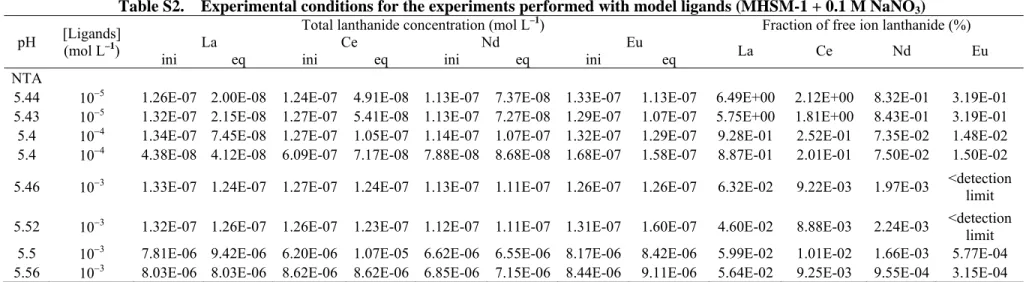
Malic acid. In this set of experiments, ligand concentrations were always much higher than lanthanide concentrations ( ini
tot ] REE
[ 100[ligand]; concentrations are available Table S2 in the Supplementary material); the proportion of free metal ions did not vary with the metal concentration. Thus, the solution equilibrium disturbance can be corrected by a simple cross product (
) ] REE /[ ] REE ([ ] REE [ ] REE [ eq tot eq 3 ini tot ini
3 . The REE3+ proportions experimentally determined at equilibrium were compared with the REE3+ proportions calculated using the initial REE concentrations (squares in Fig. 3). Measured and calculated values were in reasonable agreement for all four lanthanides and the two tested ligand concentrations ([Mal] = 104 and 103 M), indicating that the cationic REEMal+ complexes do not affect the response of the IET. It should nevertheless be noted that, at pH > 6.00, the experimental results were fairly scattered at the lowest ligand concentration (where [REE3+] > 10 %·[REE]tot), whereas no significant dispersion was observed at [Mal] = 103 M (where [REE3+] < 5 %·[REE]tot). The IET should thus be used cautiously at pH values > 6.0 if a large proportion of the REE is not bound to a ligand (i.e. in poorly buffered systems). However, in natural waters at such pH values, the lanthanides are expected to be mainly associated with humic substances, which are ubiquitous in the aquatic environment.
NTA. Finally, we evaluated the ability of the IET to determine [REE3+] when [REE]
tot/[REE3+] ratios are very high. This is a key parameter for lanthanides because the proportion of free metal ions is often lower than 1 % in natural waters.[12,14,38] The free metal ion concentrations of La, Ce, Nd and Eu were thus determined in the presence of NTA (105 M [NTA] 103 M) at pH = 5.50 ± 0.05. Predicted and measured values were in agreement for nearly all tested concentrations of NTA. We only noted discrepancies between measured and calculated [Eu3+] values for the highest NTA concentration (103 M); measured values were four to six times higher than those calculated. For this NTA concentration, [Eu] (~105 M) was approximately five to six orders of magnitude higher than [Eu3+] (~2 × 10¹¹ M), and [R3Eu] was relatively low (~8 × 10⁹ M). Under such conditions, Eu contained in the supernatant solution remaining in the tube (~100 µL) may substantially contribute to the apparent [R3Eu], which would lead to
an overestimation of the [Eu3+]. Indeed, the rinsing step with milli-Q water greatly decreases the ionic strength and thus provokes a strong increase in the affinity of the REE3+ for the resin. It is therefore reasonable to assume that a large fraction of Eu3+ contained in the rinse solution was adsorbed on the resin. Given the above-mentioned ratio, it is most likely that the dilution factor (~100 µL of the remaining solution in 10 mL of milli-Q water) was not high enough to avoid interferences due to this phenomenon. The results suggest that the IET can be used with confidence for [REE]tot/[REE3+] 105. Beyond this ratio, the IET could probably be successfully used at lower ionic strengths, although the calibration of the resin would be difficult and a new experimental design would be required (larger volume of calibration solutions or the use of very-well-characterised ligand for buffering the [Eu3+]).
Determination of [Eu3+] in the presence of humic acid
Correction for the solution equilibrium disturbance by using the repeat-batch approach. We tested the ability of the IET to determine the free-ion concentration of Eu – which is the most-documented element among the REEs – in the presence of the SRHA. Some previous studies[12,14,38] reported that the proportion of REE-HA complexes can vary from ~85 % to more than 99 % in natural fresh water, with pH and total dissolved REE concentrations ranging from 4.7 to 7.7 and 4 × 10¹⁰ to 6 × 10⁷ M
respectively (in the presence of competitor ions: Al and Fe). The first set of experiments (2 mg C L–1 SRHA, [Eu]tot = 4 × 10¹⁰ to 5 × 10⁷ M, pH = 4.00 and MHSM-1 + 0.1 M NaNO3) was performed with the aim of testing the IET for [Eu3+]/[Eu]
tot ratios higher than 1 %. Under these conditions, the variation of the dissolved Eu concentration due to the presence of resin was from ~1 to 35 % ( eq
tot ] Eu [ / ini tot ] Eu [ ; Eqn 6). Although the total active site concentration of SRHA was always much larger than that of Eu ([COOH] ~2 × 10⁵ M for 2 mg C L–1 SRHA[31]), the variation of the Eu concentration could not always be corrected by a simple cross product [Eu] [Eu] ([Eu] /[Eu]eq)
tot eq ini ini tot ini
inorg . Indeed, that correction model may lead to an underestimation of [Eu3+]ini (Fig. 4a) when the perturbation (the decrease of the Eu concentration due to the binding of the free metal ion on the resin) is higher than 8 % ( ini
tot ] Eu
[ 4 × 10⁸ M). We thus implemented a new approach to take into consideration equilibrium disturbance by the resin. It consisted of using the repeat-batch approach to plot [EuHA]eq as a function of eq
tot ] Eu
[ . The equation describing the linear relationship (least-squares regression method) between [EuHA]eq and eq
tot ] Eu
[ was
then used to calculate the EuHA concentration under the initial experimental conditions ([EuHA]ini). Finally, the [Eu3+]ini could be calculated ([Eu3+]ini = ini
tot ] Eu
[ – [EuHA]ini). This correction is based on the following equation:
tot 1 cond HA Eu 1 1 EuHA K (14)which is obtained by combining the expression of the conditional binding constant of the [EuHA] complex (Kcond ; Eqn 15) and the europium mass balance (Eqn 16):
Eu
HA EuHA 3 cond K (15)
Eu
Eu
3
EuHA
(16)where [HA] (mol L–1) is the concentration of the involved binding sites under the experimental conditions (unknown). This correction model has been successfully applied to our experimental data (Fig. 4b). For unknown solutions, it is supported by the linearity of the experimental plot of [EuHA]ini v. eq
tot ] Eu
[ (see Fig. S4 in the Supplementary material).
Inorganic Eu concentrations were also determined by using dialysis bags and the results support those obtained with the IET under our experimental conditions (pH 4.00; 3 % [Eu3+]/[Eu]
tot 33 %) (Fig. 5). Note that in the rest of the text, [Eu]inorg refers to the inorganic europium concentration (EuNO3+ + Eu3+) for simplicity. Dialysis experiments do not distinguish between the Eu bound to the inorganic ligand (NO3–) and the Eu3+ ion.
Comparison between IET results and model predictions. The results obtained were then compared with inorganic europium concentrations calculated with WHAM VII ([Eu]inorg,WHAM_VII). Mean values determined with IET were fairly consistent with those calculated with WHAM VII (Fig. 5), with a [Eu]inorg,WHAM_VII/[Eu]inorg,IET ratio ranging from 1.1 to 2.4. However, we noted limited agreement between values calculated with the two chemical equilibrium models; e.g. values calculated with the NICA Donnan model (available in Visual MINTEQ 3.1) were from 1.6 to 7.3 times lower than those determined with WHAM VII. Predicted values clearly depend strongly on the metal speciation software used and its thermodynamic database.[18]
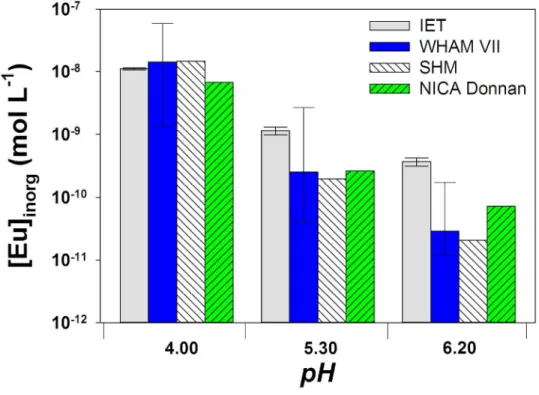
At pH 5.3 and 6.2 (where [Eu]inorg/[Eu]tot < 1 %), the three models seemed to underestimate the inorganic Eu concentration (Fig. 6). The gap between predicted and measured values increased with the pH, indicating that the model may overestimate the pH dependence of Eu-HA complexation. The
uncertainties in the binding parameters have been integrated into WHAM VII.[39] The consideration of the uncertainties (±1 s.d.) leads to a wide range of predicted inorganic Eu concentrations, with values from 2.7 × 10⁹ to 4.0 × 10¹¹ M for pH 5.3 and from 1.7 × 10¹⁰ to 1.2 × 10¹¹ M for pH 6.2. The [Eu]inorg,IET
was within the range of predicted concentrations when using this option at pH 5.3, but not for pH 6.3. Yet, by plotting –log [Eu]inorg as a function of –log ν (ν = the moles of Eu bound per gram of SHRA), we observe that our results agree with the data from Caceci[40] (Fig. 7). Indeed, the linear extrapolationsA of our results at pH 5.3 and 6.2 match with these data, which were obtained at pH 5.0, 5.5 and 6.0 and selected, among few other data sets, to calibrate WHAM VII. The observed divergences between measured and calculated values as well as the wide range of predicted concentrations highlight the need for developing analytical techniques to determine [REE3+] ion concentrations in natural waters, in which the proportion of REE3+ is often lower than 1 %.
Conclusions
The applicability of the IET to determine free ion concentrations of selected REEs (La, Ce, Nd and Eu) has been examined for environmentally relevant concentrations. The results indicate that the calibration of the IET for freshwater conditions, without increasing the ionic strength by adding inert salts, may require an unreasonably large volume of the calibration solution. Resin calibration using the batch equilibration approach rather than the column equilibration method allowed us to limit the increase of the ionic strength to 0.1 M (Na+). In this case, we showed that the equilibrium perturbations (by the resin) can be corrected by using the repeat-batch approach. Furthermore, the resin calibration was difficult at pH higher than 6.00. We hypothesise that this was probably owing to the formation of colloidal particles.
Owing to the strong interactions between the resin and the REEs, the implementation of the IET was more difficult for the REEs than for commonly studied transition elements (Cu, Zn, Cd, Ni). However, this high affinity of the REEs for the resin makes the IET very sensitive and applicable to
environmentally relevant concentrations, even when the proportion of the REE3+ is very low. Moreover, the presence of cationic complexes, such as REENO32+ or REEMal+, did not seem to interfere with the free-ion measurements.
The measured [Eu3+] values were in fairly good agreement with those predicted by WHAM VII and SHM for pH 4.00 (Eu3+ proportion 5 %). However, the predicted values were much lower than those measured for pH 5.3 and 6.2 (where the Eu3+ proportion is 1 %). Consideration of the uncertainties in the binding parameters in WHAM VII led to a wide range of predicted [Eu3+] values, indicating quite high uncertainties in predicting [Eu3+]. These observations underline the need for developing selective analytical techniques.
The present study also shows that the use of the repeat-batch approach allows extension of the applicability of the IET to metals that have strong affinity for the exchange resin.
Acknowledgements
The authors thank Julie Perreault for technical support. We are also grateful for the valuable assistance of Cédrick Beaubien during laboratory work. Environment Canada, The Natural Sciences and Engineering Research Council of Canada and the Fonds de recherche du Québec – Nature et technologies are acknowledged for funding this work. C. Fortin and P. G. C. Campbell are supported by the Canada Research Chair Programme.
References
<edb> [1] S. P. Castor, J. P. Hedrick, Rare Earth Elements (Ed. volume IM) 2006, pp. 769 (Society for Mining, Metallurgy, and Exploration: Littleton, CO).</edb>
<bok> [2] D. Bauer, D. Diamond, J. Li, M. Mc Kittrick, D. Sandelow, D. Telleen. Critical Materials Strategy
2011 (US Department of Energy).</bok>
<edb> [3] P. G. C. Campbell, C. Fortin, Biotic ligand model, in Encyclopedia of Aquatic Ecotoxicology (Eds J.-F. Férard, C. Blaise) 2013, pp. 237-245 (Springer: Dordrecht, Netherlands).</edb>
<jrn> [4] L. Weltje, L. Verhoof, W. Verweij, T. Hamers, Lutetium speciation and toxicity in a microbial bioassay: testing the free-ion model for lanthanides. Environ. Sci. Technol. 2004, 38, 6597.
doi:10.1021/es049916m</jrn>
<jrn> [5] G. Yang, Q.-G. Tan, L. Zhu, K. J. Wilkinson, The role of complexation and competition in the biouptake of europium by a unicellular alga. Environ. Toxicol. Chem. 2014, 33, 2609. doi:10.1002/etc.2722</jrn> <jrn> [6] A. Crémazy, P. G. C. Campbell, C. Fortin, The Biotic Ligand Model can successfully predict the
uptake of a trivalent ion by a unicellular alga below pH 6.50 but not above: possible role of hydroxo-species. Environ. Sci. Technol. 2013, 47, 2408. doi:10.1021/es3038388</jrn>
<jrn> [7] I. Lavoie, M. Lavoie, C. Fortin, A mine of information: benthic algal communities as biomonitors of metal contamination from abandoned tailings. Sci. Total Environ. 2012, 425, 231.
doi:10.1016/j.scitotenv.2012.02.057</jrn>
<jrn> [8] L. Hare, A. Tessier, The aquatic insect Chaoborus as a biomonitor of trace metals in lakes. Limnol. Oceanogr. 1998, 43, 1850.</jrn>
<jrn> [9] L.-Z. Li, D.-M. Zhou, P. Wang, H. E. Allen, S. Sauvé, Predicting Cd partitioning in spiked soils and bioaccumulation in the earthworm Eisenia fetida. Appl. Soil Ecol. 2009, 42, 118.
doi:10.1016/j.apsoil.2009.02.007</jrn>
<jrn> [10] E. Strady, I. Kim, O. Radakovitch, G. Kim, Rare earth element distributions and fractionation in plankton from the north-western Mediterranean Sea. Chemosphere 2015, 119, 72.
doi:10.1016/j.chemosphere.2014.05.049</jrn>
<jrn> [11] E. Tipping, S. Lofts, J. E. Sonke, Humic Ion-Binding Model VII: a revised parameterisation of cation-binding by humic substances. Environ. Chem. 2011, 8, 225. doi:10.1071/EN11016</jrn>
<jrn> [12] O. Pourret, M. Davranche, G. Gruau, A. Dia, Organic complexation of rare earth elements in natural waters: evaluating model calculations from ultrafiltration data. Geochim. Cosmochim. Acta 2007, 71, 2718. doi:10.1016/j.gca.2007.04.001</jrn>
<jrn> [13] K. K. Mueller, S. Lofts, C. Fortin, P. G. C. Campbell, Trace metal speciation predictions in natural aquatic systems: incorporation of dissolved organic matter (DOM) spectroscopic quality. Environ. Chem. 2012, 9, 356. doi:10.1071/EN11156</jrn>
<jrn> [14] J. W. Tang, K. H. Johannesson, Speciation of rare earth elements in natural terrestrial waters: assessing the role of dissolved organic matter from the modeling approach. Geochim. Cosmochim. Acta 2003, 67, 2321. doi:10.1016/S0016-7037(02)01413-8</jrn>
<jrn> [15] H. A. Zamani, R. Kamjoo, M. Mohammadhosseini, M. Zaferoni, Z. Rafati, M. R. Ganjali, F. Faridbod, S. Meghdadi, Europium(III) PVC membrane sensor based on
N-pyridine-2-carboxamido-8-aminoquinoline as a sensing material. Mater. Sci. Eng. C 2012, 32, 447. doi:10.1016/j.msec.2011.11.017</jrn> <jrn> [16] I. Worms, D. F. Simon, C. S. Hassler, K. J. Wilkinson, Bioavailability of trace metals to aquatic microorganisms: importance of chemical, biological and physical processes on biouptake. Biochimie 2006, 88, 1721. doi:10.1016/j.biochi.2006.09.008</jrn>
<jrn> [17] C. Fortin, P. G. C. Campbell, An ion-exchange technique for free metal ion measurements (Cd2+, Zn2+): applications to complex aqueous media. Int. J. Environ. Anal. Chem. 1998, 72, 173.
doi:10.1080/03067319808035889</jrn>
<jrn> [18] C. Fortin, Y. Couillard, B. Vigneault, P. G. C. Campbell, Determination of free Cd, Cu and Zn concentrations in lake waters by in situ diffusion followed by column equilibration ion-exchange. Aquat. Geochem. 2010, 16, 151. doi:10.1007/s10498-009-9074-3</jrn>
<jrn> [19] J. Werner, Speciation and determination of low concentrations of Cd2+ and Zn2+ in humus-rich waters by an ion-exchange method. Sci. Total Environ. 1987, 62, 281. doi:10.1016/0048-9697(87)90511-0</jrn> <jrn> [20] A. Crémazy, S. Leclair, K. K. Mueller, B. Vigneault, P. G. C. Campbell, C. Fortin, Development
of an in situ ion-exchange technique for the determination of free Cd, Co, Ni, and Zn concentrations in freshwaters. Aquat. Geochem. 2015, 21, 259. doi:10.1007/s10498-015-9254-2</jrn>
<jrn> [21] F. F. Cantwell, J. S. Nielsen, S. E. Hrudey, Free nickel ion concentration in sewage by an ion-exchange column-equilibration method. Anal. Chem. 1982, 54, 1498. doi:10.1021/ac00246a012</jrn> <jrn> [22] I. A. M. Worms, K. J. Wilkinson, Determination of Ni2+ using an equilibrium ion-exchange
technique: important chemical factors and applicability to environmental samples. Anal. Chim. Acta 2008, 616, 95. doi:10.1016/j.aca.2008.04.004</jrn>
<jrn> [23] Z. M. Anwar, H. A. Azab, Ternary complexes formed by trivalent lanthanide ions, nucleotides, and biological buffers. J. Chem. Eng. Data 2001, 46, 613. doi:10.1021/je000187+</jrn>
<jrn> [24] N. Her, G. Amy, D. Foss, J. W. Cho, Variations of molecular weight estimation by HP-size exclusion chromatography with UVA versus online DOC detection. Environ. Sci. Technol. 2002, 36, 3393.
doi:10.1021/es015649y</jrn>
<unknown>[25] W. D. Schecher, D. Mc Avoy, Environmental Research Software, Version 4.62 1997 (Hallowell, ME).</unknown>
<bok> [26] J. P. Gustafsson, Visual MINTEQ, Version 3.1 2014 (KTH, Division of Land and Water Resources Engineering: Stockholm).</bok>
<bok> [27] E. A. Martell, R. M. Smith, R. J. Motekaitis, Critical Stability Constants of Metal Complexes Database, Version 8. 0 2004 (US Department of Commerce: Gaithersburg, MD).</bok>
<jrn> [28] G. D. Klungness, R. H. Byrne, Comparative hydrolysis behavior of the rare earths and yttrium: the influence of temperature and ionic strength. Polyhedron 2000, 19, 99. doi:10.1016/S0277-5387(99)00332-0</jrn> <jrn> [29] F. J. Millero, Stability constants for the formation of rare-earth inorganic complexes as a function
of ionic strength. Geochim. Cosmochim. Acta 1992, 56, 3123. doi:10.1016/0016-7037(92)90293-R</jrn> <bok> [30] C. F. Baes, R. E. Mesmer, The Hydrolysis of Cations 1976 (Wiley, New York).</bok> <jrn> [31] J. D. Ritchie, E. M. Perdue, Analytical constraints on acidic functional groups in humic
substances. Org. Geochem. 2008, 39, 783. doi:10.1016/j.orggeochem.2008.03.003</jrn>
<edb> [32] J. Buffle, W. Stumm, General aquatic chemistry, in Chemical and Biological Regulation of Aquatic Systems (Eds J. Buffle, R. R. De Vitre) 1994, pp. 1-42 (CRC Press: Lewis MI).</edb>
<jrn> [33] B. Vigneault, P. G. C. Campbell, Uptake of cadmium by freshwater green algae: effects of pH and aquatic humic substances. J. Phycol. 2005, 41, 55. doi:10.1111/j.1529-8817.2005.04068.x</jrn>
<jrn> [34] Z. Chen, P. G. C. Campbell, C. Fortin, Silver binding by humic acid as determined by equilibrium ion-exchange and dialysis. J. Phys. Chem. A 2012, 116, 6532. doi:10.1021/jp212403r</jrn>
<edb> [35] I. Grenthe, F. Mompean, K. Spahiu, H. Wanner, Guidelines for the extrapolation to zero ionic strength, in OECD Nuclear Energy Agency, Data Bank 2013, (Nuclear Energy Agency: Issy-les-Moulineaux, France).</edb>
<jrn> [36] J. R. Lead, J. Hamilton-Taylor, A. Peters, S. Reiner, E. Tipping, Europium binding by fulvic acids. Anal. Chim. Acta 1998, 369, 171. doi:10.1016/S0003-2670(98)00230-X</jrn>
<jrn> [37] P. El-Akl, S. Smith, K. J. Wilkinson, Linking the chemical speciation of cerium to its bioavailability in water for a freshwater alga. Environ. Toxicol. Chem. 2015, 34, 1711.
doi:10.1002/etc.2991</jrn>
<jrn> [38] J. Viers, B. Dupre, M. Polve, J. Schott, J. L. Dandurand, J. J. Braun, Chemical weathering in the drainage basin of a tropical watershed (Nsimi-Zoetele site, Cameroon): comparison between organic-poor and organic-rich waters. Chem. Geol. 1997, 140, 181. doi:10.1016/S0009-2541(97)00048-X</jrn>
<jrn> [39] S. Lofts, E. Tipping, Assessing WHAM/Model VII against field measurements of free metal ion concentrations: model performance and the role of uncertainty parameters and inputs. Environ. Chem. 2011, 8, 501. doi:10.1071/EN11049</jrn>
<jrn> [40] M. S. Caceci, The interaction of humic acid with europium(III). Complexation strength as a function of load and pH. Radiochim. Acta 1985, 39, 51. doi:10.1524/ract.1985.39.1.51</jrn>
Received 30 June 2015, accepted 7 October 2015
Table 1. Formation constants of the rare earth element (REE) complexes (± s.d.; ?? indicates unknown uncertainty)
Equilibrium Formation constant values
La Ce Nd Eu Ln3+ + H2O = LnOH2+ + H+ –8.7 ± 0.3A –8.3 ± 0.1A –8.2 ± 0.2A –7.9 ± 0.3A Ln3+ + NO 3– = LnNO32+ 0.71 ± ??B 0.81 ± ??B 0.91 ± ??B 1.22 ± ?? Ln3+ + SO 42– = LnSO4+ 3.64 ± 0.02 3.64 ± 0.03 3.66 ± 0.02 3.67 ± ?? Ln3+ + 2SO 42– = Ln(SO4)2– 5.30 ± ?? 5.10 ± ?? 5.40 ± ?? 5.4 ± ?? Ln3+ + CO 32– = LnCO3+ 6.98 ± ?? 7.31 ± ?? 7.53 ± ?? 7.73 ± 0.2 Ln3+ + 2CO 32– = Ln(CO3)2– 11.86 ± ?? 12.32 ± ?? 12.73 ± ?? 13.19 ± 0.1 Ln3+ + CO 32– + H+ = LnHCO3+ 12.35 ± ??C 12.28 ± ??C 12.16 ± ??C 11.93 ± ??C Ln3+ + Mal2– = LnMal+ 5.66 ± ??D ?? 6,06 ± ??D 6,14 ± ??D Ln3+ + 2Mal2– = LnMal 2– 8.88 ± ??D ?? 9.66 ± ??D 9.83 ± ??D Ln3+ + NTA3– = LnNTA 12.41 ± 0.1D 12.64 ± 0.1D 13.04 ± 0.1D 13.29 ± 0.2D Ln3+ + 2NTA3– = Ln(NTA) 23– 19.78 ± 0.2D 20.60 ± 0.2D 21.45 ± 0.2D 22,58 ± 0.2D Ln3+ + NTA3– + H 2O = LnOHNTA+ + H+ 4.31 ± ??D 4.42 ± ??D 4.90 ± ??D 5,10 ± ??D Ln3+ + Cit3– = LnCit 9.18 ± 0.30D 9.35 ± 0,03D 9.51 ± 0.20D 9.46 ± 0.18D Ln3+ + 3OH– = Ln(OH) 3(s) –21.7 ± 0.50D –19.90 ± 0.90D –18.80 ± 0.70D –17.5 ± 0.70D 2Ln3+ + 3CO 32– = Ln2(CO3)3(s) 34.4 ± 0.10D – 33.0 ± ??D 32.3 ± ??D Ln3+ + CO 32– + H2O = LnOHCO3 + H+ – – 7.71 ± ??D
AMeans (±s.d.) from the values given in Millero,[29] Baes and Mesmer[30] and Klungness and Byrne.[28] BData from Visual MINTEQ database.
CData from Millero.[29]
DData from Martell et al.[27] extrapolated to zero using the Davies equation. Table 2. Molar fraction of REE3+ ([REE3+]/([REE3+]+[REENO3
2+
])) ions at various concentrations of nitrate ions in the experiments performed without organic ligands, as calculated using MINEQL+
and the formation constants listed in Table 1 REE, rare earth element
Medium 0.1 M NaNO3 0.3 M NaNO3 0.5 M NaNO3
3 La x 0.89 0.83 0.74 3 Ce x 0.87 0.78 0.70 3 Nd x 0.83 0.74 0.63 3 Eu x 0.73 0.59 0.48
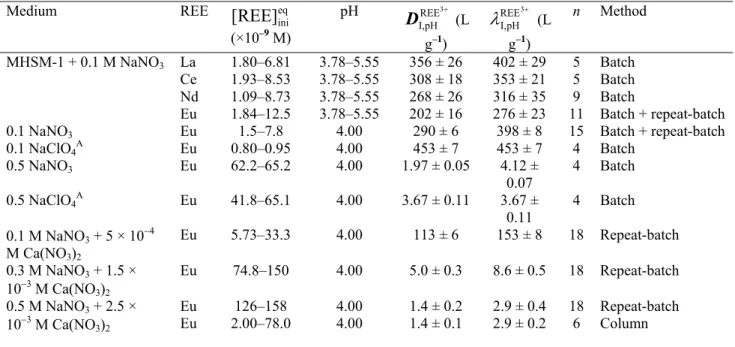
3 REE pH I,
D
are the experimental values. 3 REE pH I,
values have been calculated using Eqn 9 and the xREE3 values listed in Table 3
Medium REE eq ini
]
REE
[
(×10–9 M) pH REE3 pH I,D
(L g–1) 3 REE pH I,
(L g–1) n Method MHSM-1 + 0.1 M NaNO3 La 1.80–6.81 3.78–5.55 356 ± 26 402 ± 29 5 Batch Ce 1.93–8.53 3.78–5.55 308 ± 18 353 ± 21 5 Batch Nd 1.09–8.73 3.78–5.55 268 ± 26 316 ± 35 9 Batch Eu 1.84–12.5 3.78–5.55 202 ± 16 276 ± 23 11 Batch + repeat-batch 0.1 NaNO3 Eu 1.5–7.8 4.00 290 ± 6 398 ± 8 15 Batch + repeat-batch 0.1 NaClO4A Eu 0.80–0.95 4.00 453 ± 7 453 ± 7 4 Batch 0.5 NaNO3 Eu 62.2–65.2 4.00 1.97 ± 0.05 4.12 ± 0.07 4 Batch 0.5 NaClO4A Eu 41.8–65.1 4.00 3.67 ± 0.11 3.67 ± 0.11 4 Batch 0.1 M NaNO3 + 5 × 10⁴ M Ca(NO3)2 Eu 5.73–33.3 4.00 113 ± 6 153 ± 8 18 Repeat-batch 0.3 M NaNO3 + 1.5 × 10³ M Ca(NO3)2 Eu 74.8–150 4.00 5.0 ± 0.3 8.6 ± 0.5 18 Repeat-batch 0.5 M NaNO3 + 2.5 × 10³ M Ca(NO3)2 Eu 126–158 4.00 1.4 ± 0.2 2.9 ± 0.4 18 Repeat-batch Eu 2.00–78.0 4.00 1.4 ± 0.1 2.9 ± 0.2 6 Column AIn the NaClO4 media, xREE3 = 0 (see text paragraph ‘Resin selectivity’).
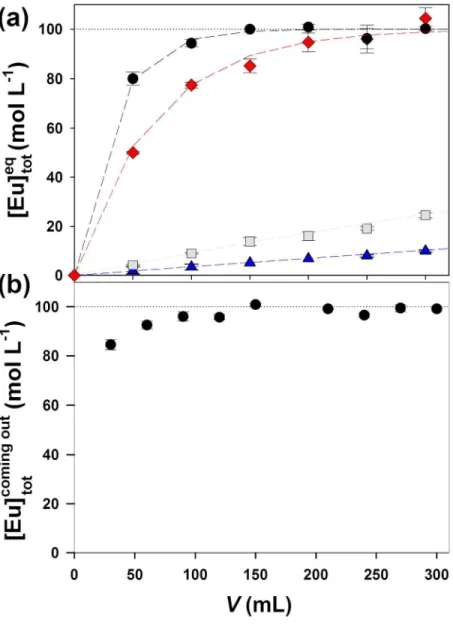
Fig. 1. Percentage of Eu remaining in solution at equilibrium (a: repeat-batch equilibration approach) and eluting
from the column (b: column equilibration approach) as a function of the volume of the calibration solution (mr ~9– 10 mg). The experiments were performed using solutions containing various concentrations of counter-ions: 101 M Na+ (blue triangles); 101 M Na+ + 5 × 10⁴ M Ca2+ (grey squares); 3 × 101 M Na+ + 1.5 × 10³ M Ca2+ (red diamonds); 5 × 101 M Na+ + 2.5 × 10³ M Ca2+ (black circles). Dashed lines represent the results calculated by using the Eu distribution coefficient and the model described in the text (Eqn 11 to Eqn 13).
Fig. 2. Comparison between the europium species distribution (%Eu3+ for lower bars and %EuNO32+ for upper bars) in 0.5 and 0.1 M NaNO3 media as determined with the ion-exchange technique (IET) and calculated using MINEQL+ 4.6 and Visual MINTEQ 3.1 (pH = 4.00).
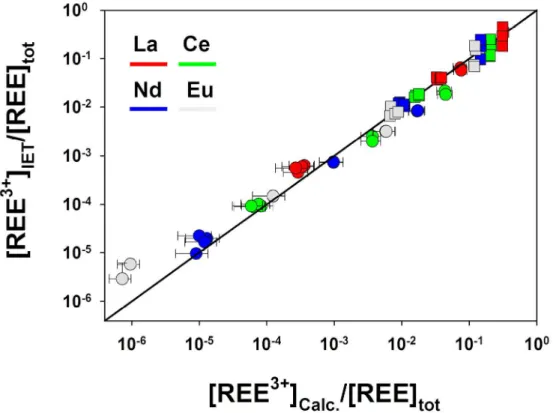
Fig. 3. Comparison between measured and calculated proportions of REE3+ ions in the presence of NTA (circles)
and malic acid (squares) in the MHSM-1 + 0.1 M NaNO3 medium. The experiments with NTA were performed at pH = 5.5 ± 0.1 and 105 M [NTA] 103 M. Those with malic acid were performed at 5.55 < pH < 6.80 and 104 M [Mal] 103 M. [REE3+]
calc were calculated by using both MINEQL+ 4.6 and Visual MINTEQ 3.1, and averaged for drawing the graph. [REE3+]
calc ranges (vertical error bars) were calculated using the uncertainties available in Martell et al.[27] Each point represents a single experiment. More details are available in Table S2.
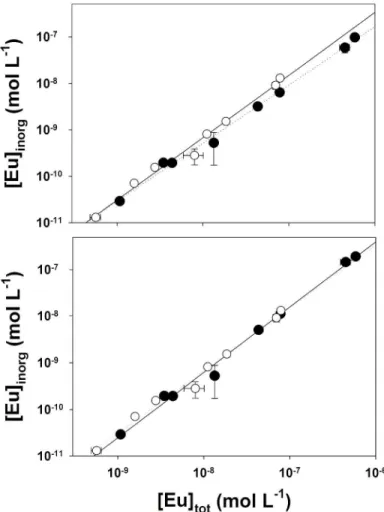
Fig. 4. Free Eu3+ ion concentrations as a function of the total dissolved Eu concentration as measured at
(a), and repeat-batch approach (b). Measurements were done with the following initial conditions: 2 mg C L–1 of SRHA, [Eu]tot = 1–500 × 109 M, in the MHSM-1 + 0.1 M NaNO3 medium and pH 4.00. Lines are the best linear regressions of [Eu]inorg v. [Eu]tot for data as measured at equilibrium (dotted lines) and after correction (straight lines).
Fig. 5. Comparison between measured (with the ion-exchange technique (IET) in black and dialysis bags in red)
and calculated inorganic Eu concentrations (Eu3+ + EuNO
32+) in the presence of 2 mg C L–1 of Suwannee River Humic Acid (SRHA), [Eu] = 1–500 × 109 M, in the MHSM-1 + 0.1 M NaNO3 medium at pH 4.00. The best linear regressions are shown with a straight line for data obtained with dialysis bags and a dashed line for IET results.
Fig. 6. Comparison between ion-exchange technique (IET)-measured inorganic europium concentrations (Eu3+ +
EuNO32+) and those calculated using WHAM VII, SHM and NICA Donnan prediction models in the presence of 2 mg C L–1 of Suwannee River Humic Acid (SRHA), [Eu]
tot = 8.8 ± 0.7 × 10⁸ M, in MHSM-1 + 0.1 M NaNO3 medium. Error bars denote experimental standard deviations for IET results whereas they indicate the range of inorganic Eu concentration calculated taking into account the uncertainties in the binding parameters for WHAM VII results.
Fig. 7. Log [Eu3+] as a function of –log ν (ν = moles of Eu per gram of HA), at various pH values in 0.1 M ionic
strength media, as determined in the present (Suwannee River Humic Acid, SRHA) and Caceci’s works (Aldrich Humic Acid).[40] The black lines represent the best linear (least-squares method) regressions of the data of the present work.
Supplementary material
Time required to equilibrate the cation exchange resin (batch-approach)
Fig. S1. Europium remaining in solution as a function of time in the batch approach ([Eu]initot ~8.5 × 10⁸ M ; V = 50 mL ; mr ~9 mg) in the absence (black
circles) or presence of 2 mg C L–1 of Suwannee River Humic Acid (blue triangles).
Evaluation of the column equilibration method
A necessary condition for determining the free metal ion concentration by using the ion-exchange technique is that equilibrium must be reached between resin-bound metal and the free metal ion concentration in solution. In the column-equilibration approach, the solution is passed through the column with a constant flow rate until the equilibrium is achieved. One of the attractive aspects of the IET is the low cost of this method. The stronger the affinity between the resin and the metal, the higher the required volume to attain the equilibrium. In the case of Eu3+, a high specific
affinity for the resin was anticipated owing to its high valence state (+3). The evaluation of the column equilibration was thus performed in a fairly strong electrolyte in order to reduce the interactions between Eu3+ and the resin (0.1 M NaNO
3; pH 4.0) at 5 and 2 mL min–1 (n = 3) with a
calibration solution containing 7.7 (±0.2) × 108 mol L–1 of europium. Fig. S1 represents the Eu concentration of the solution coming out (effluent)
of the column as a function of volume of the calibration solution passed through the resin. Whatever the flow rate, the Eu concentration rapidly increased from 0 to 15 mL of solution (first step) and then remained constant (from 15 to 300 mL). The observation of a plateau generally indicates that equilibrium has been reached, but this is not the case in the present work because the concentration of the solution coming out is lower than the initial concentration ( ini
tot
] Eu [ ).
The rapid increase in the Eu concentration within the first 15 mL of effluent may reflect the presence of two types of sites: the outer sites that are more accessible would be filled first, and then the less-accessible inner sites would gradually be occupied by the europium in the solution diffusing into the resin pores. Additional experiments (n = 3) implementing the same experimental design (but without resin) have shown that the first step was not caused by europium adsorption onto the tube walls, and seem to confirm our hypothesis of a two-step binding process.
Moreover, the proportion of exchanged europium increased as the flow rate decreased, suggesting that the plateaus were due to diffusion-limited Eu exchange from the bulk solution to the resin or through the resin pores (Fig. S2). The decrease in flow rate increases the contact time between
![Fig. 5 - Comparison between measured (with the IET in black and dialysis bags in red) and calculated inorganic Eu concentrations (Eu 3+ + EuNO 3 2+ ) in the presence of 2 mg C L -1 of SRHA, [Eu] = 1 – 500 × 10 -9](https://thumb-eu.123doks.com/thumbv2/123doknet/2949590.80135/31.918.181.736.201.607/comparison-measured-black-dialysis-calculated-inorganic-concentrations-presence.webp)
![Fig. 7 - -Log [Eu 3+ ] as a function of -Log ν (ν = moles of Eu per gram of HA), at various pH values in 0.1 M ionic strength media, as determined in the present (SRHA) and Caceci’s works (Aldrich Humic Acid) [40]](https://thumb-eu.123doks.com/thumbv2/123doknet/2949590.80135/33.918.185.733.206.619/function-various-values-strength-determined-present-caceci-aldrich.webp)