Open Archive TOULOUSE Archive Ouverte (OATAO)
OATAO is an open access repository that collects the work of Toulouse researchers and
makes it freely available over the web where possible.
This is an author-deposited version published in :
http://oatao.univ-toulouse.fr/
Eprints ID : 13507
To link to this article : doi:10.1016/j.scitotenv.2015.01.078
URL :
http://dx.doi.org/10.1016/j.scitotenv.2015.01.078
To cite this version : Martínez-Santos, Miren and Probst, Anne and
García-García, Jon and Ruiz-Romera, Estilita Influence of
anthropogenic inputs and a high-magnitude flood event on metal
contamination pattern in surface bottom sediments from the Deba
River urban catchment. (2015) Science of the Total Environment,
vol. 514 . pp. 10-25. ISSN 0048-9697
Any correspondance concerning this service should be sent to the repository
administrator:
[email protected]
Influence of anthropogenic inputs and a high-magnitude flood event on
metal contamination pattern in surface bottom sediments from the Deba
River urban catchment
Miren Martínez-Santos
a, Anne Probst
b,c, Jon García-García
a, Estilita Ruiz-Romera
a,⁎
aDepartment of Chemical and Environmental Engineering, University of the Basque Country, Alameda Urquijo z/g, Bilbao 48013, Basque Country, Spain bUniversité de Toulouse, INP, UPS, EcoLab (Laboratoire Ecologie Fonctionnelle et Environnement), ENSAT, Avenue de l'Agrobiopole, 31326 Castanet Tolosan, France cCNRS, EcoLab, 31326 Castanet Tolosan, FranceH I G H L I G H T S
• Untreated wastewaters effluents increased the organic matter content in sediments • Untreated industrial inputs increased the metal concentration in sediments • Anthropogenic inputs and high-magnitude floods determined the metal distribution • Fine sediments gives a better insight into the state of pollution for most metals
a b s t r a c t
Keywords: Urban catchment Metals Sediments Anthropogenic inputs High-magnitude floodThe purpose of this study was to assess the influence of anthropogenic factors (infrastructure construction and industrial and wastewater inputs) and hydrological factors (high-magnitude flood events) on metal and organic contamination and on the source variability of sediments taken from the Deba River and its tributaries. The pollution status was evaluated using a sequential extraction procedure (BCR 701), enrichment factor, individual and global contamination factors and a number of statistical analysis methods. Zn, Cu and Cr were found to have significant input from anthropogenic sources, with moderately severe enrichment, together with an extremely high potential risk of contamination. The principal scavenger of Cu and Cr was organic matter, whereas Zn was uniformly distributed among all non-residual fractions. For Fe, the anthropogenic contribution was more obviously detected in bulk sediments (b2 mm) than in fine fractions (b63 μm). Finally, the recent construction of a rail tunnel traversing Wealden Facies evaporites, together with intense rainfalls, was the main reason for the change in the source variability of bottom sediments and metal distribution in headwaters. The occurrence of a high-magnitude flood event resulted in a washout of the river bed and led to a general decrease in fine-grained sediment and metal concentrations in labile fractions of channel-bottom sediments, and a consequent downstream transfer of the pollution.
1. Introduction
Since the beginning of industrialization and uncontrolled urbanisa-tion in many catchments, rivers have faced several water and sediment quality problems. Metals are considered to be serious inorganic pollut-ants because of their toxic effects on life in aquatic systems (Zhuang et al., 1994; Yang et al., 2009; Naji et al., 2010). During the 19th and 20th centuries the main sources of metals in aquatic environments were anthropogenic inputs, especially in urban catchments, mainly from industrial or urban effluents (Suthar et al., 2009; Gupta et al.,
2010; Buzier et al., 2011; Maceda-Veiga et al., 2012), mining activities (Elbaz-Poulichet et al., 2001; Salvarredy-Aranguren et al., 2008; Resongles et al., 2014) and atmospheric deposition (Bur et al., 2009). According toTaylor and Owens (2009), many previous anthropogenic sources dominate the contaminant load in urbanised river catchments. Nevertheless, the presence of metals and suspended particulate matter in aquatic environments may also have a natural origin, such as geolog-ical weathering, soil erosion and landslides (Roos and Åström, 2005; Göransson et al., 2009; Nystrand et al., 2012). Additionally, sediment sources, which are a direct result of human activities, also include the construction of urban infrastructures such as railway lines, road and channel networks, tunnels, and dams, among others. Some studies have assessed the effect of infrastructure construction on the retention
⁎ Corresponding author.
E-mail address:[email protected](E. Ruiz-Romera).
and generation of sediments and on the source variability of those sediments (Rijsdijk et al., 2007; Dai et al., 2008; Wu et al., 2012; Velísková and Dulovičová, 2008). In the present study, the effect of tunnel construction on the source variability of sediments on river bed has been investigated.
It has been widely reported that most of the metals in aquatic sys-tems are associated with the particulate phase; over 99% of pollutants are stored in fine-grained sediments and complexed to organic matter and oxides (Carter et al., 2006; Violintzis et al., 2009; Devesa-Rey et al., 2010a; Bartoli et al., 2012), which act as a vector and reservoir of contaminants (Owens and Xu, 2011). Variations in water and sedi-ment physicochemical conditions could therefore play an important role in their mobilisation in the dissolved phase, where they become more bioavailable and disclose toxic chemical forms (Eggleton and Thomas, 2004; Roussiez et al., 2013).
Although sediment-associated metals accumulate in the river during periods of low discharge, they are resuspended and transported downstream during flood events (Ciszewski, 2001), especially during higher-magnitude floods, where the risk of metal mobilisation in-creases. Great attention should therefore be paid to the hydrological processes and the transport of sediment-associated metals during flood events. These high-magnitude floods are caused by heavy rain episodes, which can episodically flush large amounts of sediments into the river, particularly when there is important runoff (Old et al., 2003; Zabaleta et al., 2007).
The estuary of the Deba River and its impact on the Bay of Biscay have been investigated for nutrients (Borja et al., 2006), sediment-associated metals (Legorburu et al., 2013) and dissolved metals in ma-rine waters (Tueros et al., 2008); however, no study has addressed the occurrence and distribution of metals in the bottom surface sediments of the Deba River catchment, which is one of the most polluted rivers in the province of Gipuzkoa (Basque Country). This is affected by vari-ous factors.
a) Deba River is characterised by heavy industrial development and a population increase along it and its tributaries over recent decades. Surface waters receive untreated wastewater inputs from the mu-nicipality of Ermua, treated effluents from three wastewater treat-ment plants and partially treated effluents from several sewers that end up in the Bay of Biscay (Table 1).
b) About 6773 m3y− 1of untreated industrial effluents are discharged into the Deba River and its tributaries. According to data provided by Gipuzkoa Provincial Council around 19 t y− 1of suspended sedi-ments (SS), 1.4 t y− 1of iron, and 687, 104, 56 and 5 kg y− 1of zinc, nickel, chromium and copper, respectively, are discharged with these industrial effluents (Table 1).
c) As part of the project for a new high-speed rail line, work on the construction of the 4.7 km Albertia tunnel mobilised large amounts of sediments. Sections with the presence of sulphated facies (anhy-drites and gypsum) were detected during the top heading excavation of this tunnel (Peña and Rodenas, 2011) and sediments of different lithological origin and chemical composition were consequently ex-posed to being washed-off during rain episodes.
In this context, this paper aims to: i) determine the sites with the highest potential of risk from sediment-associated metals and identify their source of contamination; ii) assess the impact of natural or anthro-pogenic disturbances such as the occurrence of a high-intensity flood and construction of a high-speed rail on source variability and change in metal composition in river-bottom sediments.
2. Study area
This study was conducted in the Deba River Catchment (538 km2), from headwaters to the Altzola gauging station, in the province of Gipuzkoa (NE of Spain,Fig. 1). The station was considered as the outlet of the catchment because the lower part of this catchment is influenced
Table 1
Data of physicochemical characteristics of anthropogenic inputs were analysed and reported by Gipuzkoa Water Consortium (A) and Gipuzkoa Provincial Council (B); A) data of treated (TE) and partially treated (PTE) effluents from wastewater plants and sewers; B) data of untreated industrial effluents (UIE). EC (electrical conductivity), SSC (suspended sediment concentration) and SS (suspended sediment load), COD (chemical oxygen demand). The detection limits (bd.l.) are 5 mg L−1for SSC, 1 mg L−1for Fe and 0.5 mg L−1for the rest of the dissolved metals.
A) Sewers or wastewaters plants Sampling period Degree of treatment pH EC (μS/cm) SSC (mg L− 1) COD (mg O2L− 1) Fe (mg L− 1) Mn (mg L− 1) Zn (mg L− 1) Cu (mg L− 1) Cr (mg L− 1) Ni (mg L− 1) Pb (mg L− 1) Apraitz Jan 2011– Dec 2012 T.E. 6.4–7.2 353–775 bd.l. −33 22–83 bd.l. −2.31 b d.l. bd.l. bd.l. b d.l. bd.l. b d.l. Mekolalde Feb 2011– Dec 2012 T.E. 7.3–7.9 361–730 bd.l. −30 20–102 bd.l. −1.2 b d.l. bd.l. bd.l. b d.l. bd.l. b d.l. Epele May–Dec 2012 T.E. 7.2–7.7 520–876 6–34 21–968 bd.l. b d.l. bd.l. bd.l. b d.l. bd.l. b d.l.
Arrasate sewer Jan–Sep 2011
P.T.E. 8.0–8.3 945–1157 213–791 559–914 bd.l. −11.3 b d.l. bd.l. bd.l. b d.l. bd.l. b d.l. Oñati sewer Jan–Sep
2011
P.T.E. 7.0–7.7 611–1169 165–728 621–1552 bd.l. −1.12 b d.l. bd.l. −0.56 bd.l. b d.l. bd.l. b d.l. B)
Location River Degree of treatment
Main industrial activities Discharge (m3y− 1) COD (kg O2y− 1) SS (kg y− 1) Fe (kg y− 1) Cr (kg y− 1) Zn (kg y− 1) Ni (kg y− 1) Cu (kg y− 1) Eskoriatza Deba River U.I.E. Smelting factories and automotive
industries
90 514 1167 178 4.0 1.0 10 –
Aretxabaleta Deba River U.I.E. Metallurgical factories 648 114 59 1.0 – 1.0 – –
Arrasate Deba River U.I.E. Metallurgical and electrical appliance factories
1052 1741 2032 63 21 14 53 1.0
Bergara Deba River U.I.E. Galvanising factories, steel industries, machines construction
336 2934 3724 539 22 544 8.0 1.0
Soraluze Deba River U.I.E. Galvanising factories 1780 2947 2133 6.0 – 58 18 –
Elgoibar Deba River U.I.E. Construction of machinery 75 2075 2217 13.0 – – – –
Oñati Oñati stream U.I.E. Steel industries, metallurgical and automotive industries
1262 3365 4905 487 1.0 61 5.0 3.0
Eibar Ego stream U.I.E. Metallurgical and smelting factories 1530 2346 2779 78 8.0 8.0 10 –
by seawater when the tide rises. The Deba River, which crosses the catchment from South to North, receives inflows from several tribu-taries, the most significant being the Ego and the Oñati. The highest point of the catchment lies at 1320 m a.s.l. (the peak of Botreaitz) and its lowest is at sea level (0 m a.s.l., Bay of Biscay), while the Altzola gaug-ing station is located at 25 m a.s.l.
The catchment is characterised by a maximum slope of 40% (in headwaters). The main bedrock in the southern part of the catchment is an alternation of limestones and lutites (Fig. 1). In this part, anhydrite and gypsum deposits alternate with silt, mudstone, sandstone and lime-stones in Wealden Facies evaporites (IGME, 1987; Ábalos et al., 2008; Iribar and Ábalos, 2011). The idea that large volumes of evaporites Paris Madrid Lisboa Bilbao Donostia-San Sebastián Vitoria-Gasteiz 0 10 20 km
Altzola gauging station
High-speed line and
Albertia tunnel
Urban areas
Sampling point
Sewage treatment plants:
(1) Apraitza
(2) Mekolalde
(3) Epele
Basaltic rocks
Alternation of limestones and lutites
Marls
Carbonate rocks (limestones and
dolomites)
Lithological map:
BAY OF BISCAY
D
b
e
a
river
Eskoriatza
Arrasate
Oñati
Bergara
Eibar
Ermua
Elgoibar
Deba
o
Eg
M zmela
a
O
ñati
eb
r
v
r
D
a
i
e
N NE E W S SE NW SW NAlbertia
tunnel
0 5 10 KmSoraluze
M1
D2
O1
D3
E1
D4
Botraeitz (1320 m) 0.0 m 25 mAntzuola
Elgeta
Aretxabaleta
1
2
3
D1
O2
A1
Angiozar
Leintz Gatzaga
Alternation of limestones and lutites
with anhydrite and gypsum deposits
(Wealden Facies)
occupy the core of major geological structures in this part of the Basque–Cantabrian basin has prevailed during the last decades (Ábalos et al., 2008). Occurrence of gypsum in different rock series (Early Cretaceous Wealden Facies and Triassic Keuper facies) was recognised in several works of the area (tunnel excavation,Peña and Rodenas, 2011; exploration wells). Here evaporitic rocks (mainly gypsum and anhydrite) appear in different ways: diapiric structure (Leintz Gatzaga,Fig. 1), interlayered with the most usual sedimentary rocks, sandstones and mudstones (Supraurgonian Complex, Aptian-Albian), and filling fractures in fault zones. Even though evaporite outcrops are rare in the area, the presence of saline springs supplies an indirect evi-dence of their occurrence (Iribar and Ábalos, 2011). Saline springs are common in this area, which have a high Na+, Cl−and SO
4
2−concentration with an important presence of dissolved H2S (Iribar and Ábalos, 2011). The middle part of the catchment consists mainly of marls, and in the north, carbonate rocks dominate (EVE, 1989).
Soils in the catchment are predominantly Cambisols (66%) and Acrisols (25%). This head catchment has been reforested for industrial purposes with Pinus spp. (37%); autochthonous forest occupies around 27%, and farmlands and pastures only 11%. However, the primary indus-tries in this catchment are metallurgical, automotive industry, galvanising factories (a layer of zinc is bound to steel in order to protect it against the corrosion), smelting factories and electrical appliance factories, which are concentrated in the urban areas located along the river (Table 1and
Fig. 1).
The Deba catchment is considered to be one of the catchments most polluted by municipal and industrial wastewaters in the province of Gipuzkoa (Borja et al., 2006). The three most impor-tant urban areas are Eibar, Arrasate and Ermua, where 50% of all inhabitants live.
In order to avoid contamination of river water with municipal wastewater, three sewage treatment plants have been built in recent years (Fig. 1). Those plants collect urban and industrial effluents, which are previously treated before discharging them into the river water. Before Epele plant was put in continuous operation (May 2012), the rich-organic wastewaters of Arrasate and Oñati towns were discharged into Deba River and Oñati stream by means of two sewers (Table 1). Despite being one of the largest towns in the area, the un-treated sewage effluents of Ermua are discharged directly into the Ego stream. In addition to industrial activities and urban impact, as part of construction of a new high-speed rail line, a 4786 m tunnel (the Albertia tunnel) was built between April 2009 and July 2011 (Fig. 1) and large amounts of sediment were consequently extracted and deposited around the tunnel, where there is a slope of 20%.
Hydrological (discharge, Q) and meteorological data (precipitation and temperature) have been measured and recorded every 10 min since October 1995 in the Altzola gauging station (Fig. 1) by Gipuzkoa Provincial Council (www4.gipuzkoa.net/oohh/web/esp/04_01.asp). Mean annual precipitation and temperature for the last seventeen years (1996–2013) are 1486 mm and 13.6 °C, respectively. The wettest period is from November to January and the driest and hottest months are usually in summer (June–September). During the research period, both hydrological years (2010–2011 and 2011–2012) were unusually dry, 1154 and 1205 mm, respectively. However, 248 mm of rainfall was recorded in November 2011, representing 21% of precipitation for this hydrological year. The mean recorded discharge was 8.25 and 9.34 m3s− 1for the first and second years, respectively. Mean discharge was 10.61 m3s−1for the 1996–2013 period. Both sampling campaigns, 11th of October 2011 and 17th of October 2012, were carried out in the same hydrological period, low flow period (1.57 and 1.84 m3s− 1 respectively) with longer residence time, in an attempt to diminish the influence of hydrological pattern over the physicochemical charac-teristics of water and sediments.
A 50-year high-intensity flood event occurred in the Deba River from the 5th–9th of November 2011. During this flood event, rainfall was exceptionally high from the 5th–6th of November (213 mm) and a
maximum discharge of 438 m3s−1was monitored at the Altzola gauging station.
3. Materials and methods 3.1. Field methodology
Surface bottom sediment (SBS) samples were collected (Fig. 1) from four sampling points (D1, D2, D3 and D4) along the main river bank and from five sampling points (M1, O1 and O2, A1, and E1) in the Mazmela, Oñati, Angiozar and Ego tributaries, respectively, during the sampling campaign of October 2011. These sampling points were chosen in an attempt to locate the pollution sources in the main river and tributaries from headwaters to the outlet. SBS were again collected in October 2012 at the same sampling sites, except D1, O2 and A1, which were used as background-reference sites because they were not influenced by anthropogenic pollution sources. SBS were collected using a plastic spoon and sealed in clean polyethylene bags.
Water samples were also taken in polyethylene bottles at all sam-pling points. Electrical conductivity (EC), pH and redox potential (Eh) were measured in situ using a Crison EC-Meter Basic 30+, Crison Micro pH 2000 and Hach ORP/Redox sonde MTC101 with Ag/AgCl electrode, respectively. All water and sediment samples were stored and refrigerated in the dark and transported to the laboratory of Chem-ical and Environmental Engineering (University of the Basque Country) in the same day.
In addition, precipitation (P, mm) and discharge (Q, m3s− 1) were continuously monitored in the Altzola gauging station in order to deter-mine the magnitude of flood events during the study period. This station comprises a crump-profile single-crested weir. Turbidity (TRB, NTU) was also measured in this station using a Solitax infrared backscattering turbidimeter (Dr. Lange devices). Turbidimeters are commonly used to estimate continuous suspended sediment flux (Gippel, 1989; Brasington and Richards, 2000). Several authors (Lewis, 1996; Zabaleta et al., 2007) have satisfactorily used the good relationship between turbidity and suspended particulate matter (SPM) to calculate the continuous time series of SPM from continuous turbidity series. This method was used to calculate the SPM exported during the flood events throughout the entire hydrological year (2011–2012). These three variables (P, Q and TRB) were electronically logged at 10-min intervals.
An automatic water sampler (SIGMA 900) was installed in the gaug-ing station and programmed to start pumpgaug-ing 24 water samples of about 800 mL when TRB in the stream rose to 100 NTU, thus ensuring that flood events were monitored. The pumping frequency was 2 h in all flood events (seven in hydrological year 2011–2012). Water samples were taken to the laboratory for determination of SPM and dissolved and particulate organic carbon (DOC and POC).
3.2. Laboratory methodology
SBS were air-dried and ground with a pestle and mortar for homog-enization. For texture analysis, sediment samples were sieved through a stainless steel sieve to distinguish the percentage of gravel (N2 mm), sand (63–2000 μm) and mud (b63 μm) fractions. However, the percent-ages of sand (63–2000 μm) and fine fraction (b63 μm) were also recalculated taking only the bulk fraction (b2 mm) into account. The moisture content of the sediment samples was determined by heating at 105 ± 2 °C in glass plates at constant weight. All data reported in this paper were calculated on a dry-weight basis.
Chemical analyses were performed on sediment samples in the laboratory of Chemical and Environmental Engineering (University of the Basque Country). Total carbon (TC), nitrogen (TN), and sulphur (TS) were analysed in the fine sediment using a TruSpec CHNS deter-minator (Leco Corporation). Volatile solids were determined using a muffle furnace as described in Method 2540 E of the Standard Methods (APHA-AWWA-WPCF, 1998). After incineration at 500 °C,
the percentage of weight loss was considered to be representative of total organic carbon (TOC). Total inorganic carbon (TIC) was calculated by the difference between TC and TOC.
Although the fine fraction (b63 μm) has been proven to be the most chemically active sediment phase (Förstner and Salomons, 1980; Ruiz et al., 1991; Ruiz and Romero, 1992; Zhang et al., 2002), it was also con-sidered appropriate to measure the pseudo-total metal content in the bulk fraction (b2 mm) of October 2011. An ETHOS 1, Millestone micro-wave digestion system was used to digest three replicates of each SBS sample (0.5 g) in Teflon vessels with concentrated HNO3:HClO4(3:1.5) to determine of pseudo-total content. The digested samples were heated by increasing the temperature to 180 °C for 10 min and kept at that temperature for an additional 25 min (USEPA, 2007). After digestion, all samples were filtered through a 0.45 μm Milipore nitrocellulose filter, and diluted to 100 mL with Milli-Q water. For controlling analytical methods a NBS sediment sample was additionally used (Buffalo River sediment, USA). With this technique, all metals were also measured with mean values close to the certified contents and variation coefficients lower than 8% with the exception of Pb (17% with 0.5 g of sample) (Ruiz et al., 1991).
A sequential extraction method was performed on the fine fraction (b63 μm) of the sediments. Three replicates of each sample point were analysed. This method is based on the procedure used byTessier et al. (1979)but modified byBaffi et al. (1998), with improvements made in accordance with the European Community Bureau of Reference (BCR 701). This extraction was divided into four operationally defined fractions.
(1) Exchangeable, water and acid-extractable fraction (F1, soluble species, carbonates and exchangeable metals): About 0.5 g of the sample was continuously shaken at 30 rpm for 16 h at 20–22 °C with 20 mL (0.11 M) of acetic acid (CH3COOH). (2) Reducible fraction (F2, Fe/Mn oxyhydroxides): The residue from
step 1 was continuously shaken at 30 rpm for 16 h with 20 mL (0.5 M) of hydroxyl-ammonium chloride (NH2OH·HCl) adjusted to pH 2 with HNO3.
(3) Oxidisable fraction (F3, organic matter and sulphides): The residue from (2) was first oxidised with 10 mL of H2O2in a water bath at 85 °C till almost dry (about 1 h). This step was repeated again. After cooling, 25 mL of 1 M ammonium acetate (NH4CH3COO, pH 2 with HNO3) was added and shak-en for 16 h at 30 rpm.
(4) Residual fraction (F4, remaining, non-silicate bound metals): The residue from (3) was digested in a 15 mL combination of HNO3:HClO4 (3:1.5), as described above in pseudo-total metal digestion.
At the end of each extraction, the extractable fraction was separated by centrifugation at 3000 rpm for 40 min. The supernatant was pipetted and stored in polyethylene bottles in the fridge (4 °C) until analysis.
Finally, the metals under consideration (Fe, Mn, Cu, Cr, Ni, Pb and Zn) in the extracts and pseudo-total digestion were determined by ICP-OES (Perkin Elmer Optima 2000) and by using an Ultrasonic Nebu-lizer (CETAC, U5000AT+) for those metals with a lower concentration (Cr, Cu, Ni and Pb). The percentage of recovery in each extraction step, taking into account pseudo-total digestion, was also calculated for each metal. For all elements, the recovery ranged between 92% and 117%. The detection limit for these metals was: Pb (1 μg g− 1), Mn (0.5 μg g− 1), Fe and Mn (0.4 μg g− 1) and Cr, Cu and Ni (0.1 μg g− 1).
Water samples collected at all sampling points were filtered through 0.45 μm filters. One replicate of each sample was acidified to pH b 2 with HNO3(65%) for dissolved metals (Fe, Mn, Cu, Zn, Pb, Ni and Cr), base cations (Ca2+, Mg2+, Na+and K+) and silica analysis using ICP-OES, which was connected to an Ultrasonic Nebulizer to reduce the detection limit at 0.1 μg L− 1for metals. Anions (Cl−, NO
3 −and SO
4 2−) were
measured in the non-acidified replicate using ion chromatography (DIONEX ICS 3000). Alkalinity was determined in the unfiltered sample by titration with HCl (APHA-AWWA-WPCF, 1998). All water samples showed an Ion Balance Error (IBE) between 10% and− 10% with the ex-ception of D1 (− 14%).
DOC and TOC were respectively analysed in one filtered and one non-filtered replicate of each sample collected during the flood events using a Total Organic Carbon Analyzer (TOC-L Shimadzu). POC was calculated by the difference between TOC and DOC. Addi-tionally, SPM content was also measured using the preweighed 0.45 μm Millipore nitrocellulose filters of the previously filtered samples. Organic carbon data obtained from seven flood events during hydrological years 2011–2012 were used to calculate exportations during floods.
3.3. EF, ICF and GCF calculations
The Enrichment Factor (EF) is a useful tool for determining the degree of anthropogenic metal pollution. The enrichment of a given element in sediments relative to a background-reference site is an indi-cation of contribution from anthropogenic sources. The EF concept was developed byChester and Stoner (1973)and has subsequently been applied by numerous authors to soils (Hernandez et al., 2003), river sediments (Tam and Yao, 1998; N'guessan et al., 2009) and estuary or coastal sediments (Violintzis et al., 2009; Legorburu et al., 2013). The EF for the element M can be calculated in accordance with Eq.(1), where [M]sand [R]sare the concentrations of the element M and the ref-erence element R in sediment samples, while [M]rfand [R]rfare the mean concentration obtained from three non-contaminated reference sites (D1, O2 and A1,Fig. 1). As a reference element, Fe was selected be-cause, in this catchment, it is predominately bound to the residual frac-tion in the fine sediment (as shown below, seeSection 4.2.) and it could therefore be considered as a lithogenic component.
The Individual and Global Contamination Factors (ICF and GCF, respectively) of metals integrate all the data obtained by sequential ex-traction. Determination of these factors is an important aspect, indicat-ing the degree of risk of metal contamination to the environment in relation to retention time in sediments: a high value means a low reten-tion time and, consequently, a higher risk to the environment (Naji et al., 2010). The ICF for the various sampling sites was calculated from the result of the fractionation study, dividing the sum of the first three extractions (F1, F2and F3, constituting the non-residual fraction) by the residual fraction (F4) for each site (Eq.(2)). The GCF is equal to the sum of individual factor (Ikem et al., 2003; Naji et al., 2010), as shown in Eq.(3).
E F ¼ ðM½ "s= RM ½ "sÞ ½ "rf= R½ "rf
ð Þ ð1Þ
IC F ¼CnonC0 − residualresidual ð2Þ
GC F ¼Xni¼1ICFi ð3Þ
3.4. Statistical methods
A Shapiro–Wilk test was carried out to check whether variables were normally distributed. Spearman correlation analysis (non-parametric test) and Principal Component Analysis (PCA) were per-formed to establish relationships and behaviour of the metals and other elements in water and sediments. PCA with an eigenvalue greater than 1 was subjected to an orthogonal varimax rotation. This maximises the variance to obtain a pattern of loadings for each factor that is as di-verse as possible, thus lending itself to easier interpretation. A Cluster Analysis using Euclidean squared distance and aggregation Ward's
method was also performed to discriminate metal contents in the fractions isolated using sequential extraction and to identify groups of samples which contain similar contamination levels. The hierarchical method of the cluster analysis used in this study has the advantage that it does not require any prior knowledge of the number of clusters, which is a prerequisite of the non-hierarchical method. Statistical pro-cessing of the data was performed using SPSS software 20.0.
4. Results
4.1. Physicochemical parameters and pseudo-total metals of river waters, sediments and effluents
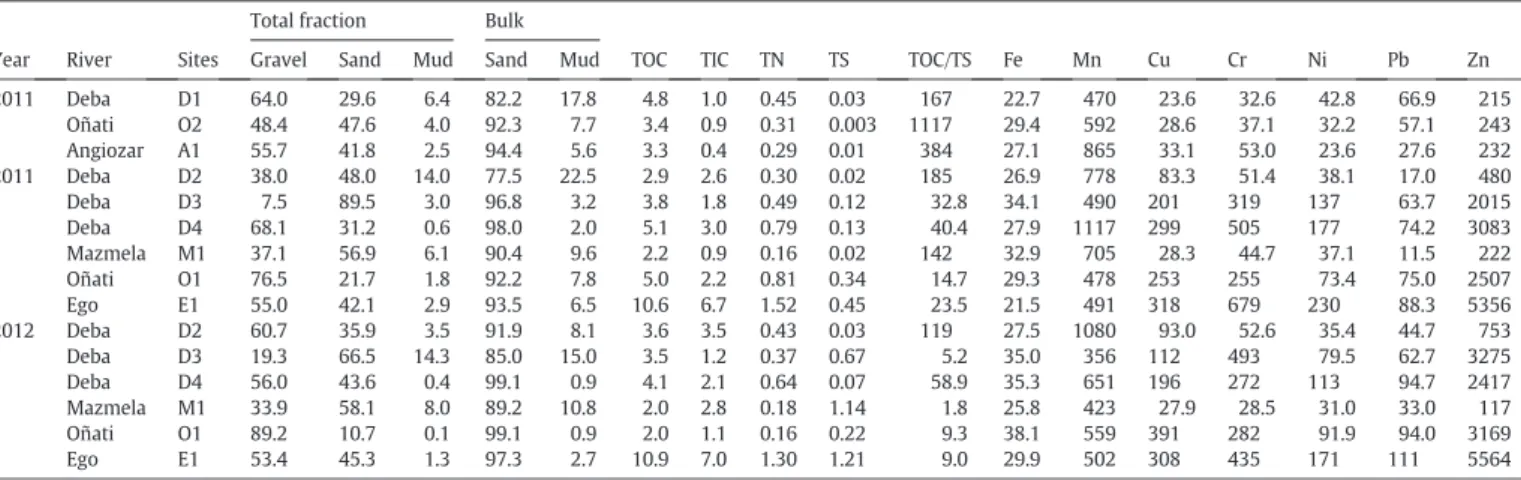
Some physicochemical parameters were analysed in the different water samples (pH, Eh, EC, ions and dissolved metals,Table 2). In sur-face sediments, texture data are given as a percentage of gravel (N2 mm), sand (63–2000 μm) and mud (b63 μm) considering all sedi-ment fractions (Table 3). At the same time, sand and mud percentages were also recalculated taking into consideration only the bulk fraction (b2 mm). In the fine sediments (b63 μm), TN, TS, TC, TOC, and TIC and pseudo-total metals were measured and the TOC/TS ratio was cal-culated. Pseudo-total metals were also determined in the bulk sediment (b2 mm) fraction in 2011 and the ratios of metal concentration in fine fraction versus bulk fraction were calculated (Table 4).
Surface waters exhibited relatively low concentrations of dissolved metals (Table 2), usually below the detection limit (1 μg L− 1), while fine fraction (b63 μm) of sediments contributed highly to the pseudo-total metal content in surface bottom sediments, especially Zn (Table 3). On the other hand, untreated industrial effluents (about 6773 m3 y− 1) contribute significantly to the total metal content (Fe N Zn N Ni N Cr N Cu), the organic matter load (16,035 kg O2y− 1) and the suspended sediment load (19,017 kg y− 1) in rivers (Table 1). Concerning treated and partially treated wastewaters discharged into the surface waters they cannot be considered as significant source of metals, usually below 0.5 mg L− 1for Mn, Zn, Cu, Cr, Ni and Pb, and b 1.0–11.32 mg L− 1for Fe (Table 1). However, partially treated waste-waters from Arrasate and Oñati sewers contributed to increase of the organic matter (559–1552 mg O2L− 1) and suspended sediment con-centration (165–791 mg L− 1) in water from January to September 2011. Apart from that, untreated wastewaters from Ermua town were spilled directly into Ego stream; physicochemical characteristics of those effluents were reflected in E1 sampling point (Tables 2 and 3).
Water samples collected during the high-magnitude flood event were used to calculate exportations of SPM, POC and DOC. This event mobilised 1360 t of SPM, more than 45% of the total amount exported throughout the entire hydrological year (2011–2012) in the Deba catch-ment. The organic matter shows similar behaviour, with 3.61 t km−2of
POC and 1.19 t km− 2of DOC exported, representing 60% and 29% of the flux of POC and DOC exported during flood events in this year. 4.1.1. Spatial and temporal distribution
The pH in the water for this study period varies between 7.6 (O1) and 8.5 (A1) (Table 2), indicating a weakly alkaline environment but well-buffered surface waters. Redox potential shows positive values (50–263 mV) at most of the water sampling points and negative values in O1 and E1. The most reducing conditions were measured at E1 (− 106 mV) during the drier season of October 2011, when discharge at the gauging station was very low (1.57 m3s− 1). The highest values of electric conductivity (1109–2570 μS/cm) and most of the major ions (Ca2+, Mg+2, Na+, K+, Si, Cl−and SO
4
2−,Table 2) are found in headwaters (D1, D2 and M1) which could be influenced by groundwa-ter circulation from rocks holding evaporites (Ábalos et al., 2008; Iribar and Ábalos, 2011). Diffuse discharge of groundwater flows from evapo-ritic deposits, with high content of Na+, Cl−and SO
4
2−, into wetlands has also been observed relatively near from this study area by other au-thors (Martínez-Santos et al., 2012). On the contrary, the lowest values of dissolved metals are found in headwaters and the highest ones in D3 (560 μg L− 1of Zn), D4 and E1. There is a general increase of dissolved Fe and Zn in 2012.
The results of texture analysis of all surface sediments are shown in
Table 3. The gravel fraction (around 50%) is the major fraction in the sediment samples studied. This is followed by the sand fraction, with a mean mass percentage of 45%, while the mud fraction is the smallest fraction with a percentage of 5%. The sand and mud fractions follow the same pattern in the main river and its tributaries when they are recalculated according to the bulk fraction; however, the mass percent-age of both fractions increases (Table 3). Texture data of surface bottom sediments changed in some locations from 2011 to 2012 (Table 3), so that midstream (D3) the percentage of fine fraction increased consider-ably from 3.2% to 15%, while upstream (D2) this sediment fraction di-minished in a similar proportion, from 22.5% to 8.1%. It is worth noting the major decrease of fine fraction (7.8% to 0.9%) from the first to the second campaign in the Oñati stream (O1).
Percentages of TN, TS and total organic and inorganic carbon (TOC and TIC) range from 0.16% to 1.52%, 0.003% to 1.21%, 2.01% to 10.93% and 0.39% to 7.04%, respectively (Table 3). Taking into account the two years of sampling, all these elements are found in higher percentages in the tributaries, especially in E1, which shows the highest contents of TOC (10.9%), TIC (7%), TS (1.21%) and TN (1.52%). In general terms, total sulphur content was markedly increased in some locations in 2012, M1 (0.02% to 1.14%), E1 (0.45% to 1.21%) and D3 (0.12% to 0.67%). On the other hand, the Oñati stream has the greatest temporal variability; while in 2011 it was remarkable for its high contents in all these elements (TOC, TIC, TN and TS), the following year O1 point
Table 2
Electrical conductivity (μS cm−1), pH, redox potential (Eh, mV), ions (mg L−1), total alkalinity (Alk., meq L−1) and dissolved metals (μg L−1) were measured in water samples taken in both sampling campaigns. D1, O2 and A1 were considered as background-reference sites. The detection limit (d.l.) is below 0.1 μg L−1for all dissolved metals.
Year River Sites EC pH Eh Ca Mg Na K Si Cl NO3 SO4 Alk. Fe Mn Cu Zn Pb Ni Cr
2011 Deba D1 1109 8.3 263 86.0 12.9 83.2 1.6 4.8 252 1.0 92.5 3.0 5.4 1.0 bd.l. bd.l. bd.l. bd.l. bd.l. Oñati O2 304 8.3 183 54.7 2.5 20.8 1.0 1.8 6.2 2.7 14.2 2.6 0.9 1.0 bd.l. 1.8 bd.l. bd.l. bd.l. Angiozar A1 363 8.5 156 57.4 5.9 23.3 1.7 4.3 14.1 4.1 19.1 3.1 2.9 2.0 bd.l. bd.l. bd.l. bd.l. bd.l. 2011 Deba D2 2570 8.4 190 143 19.8 392 6.8 2.9 570 4.7 271 3.5 7.6 22.8 0.7 10.3 bd.l. 2.2 bd.l. Deba D3 711 8.0 181 77.5 6.6 44.9 5.8 2.9 93.4 2.9 64.4 3.8 75.1 61.1 0.9 16.1 bd.l. 9.1 1.1 Deba D4 583 8.1 161 71.6 5.7 36.8 5.6 3.0 59.1 15.9 58.9 3.2 18.2 19.1 0.8 6.0 bd.l. 12.7 3.0 Mazmela M1 1174 8.2 247 138 24.6 70.5 6.4 4.4 119 3.5 297 4.8 2.6 4.5 bd.l. bd.l. bd.l. bd.l. bd.l. Oñati O1 349 7.7 − 29 57.6 3.4 22.5 1.7 2.0 10.0 0.8 21.0 3.0 49.5 38.1 0.6 7.6 1.5 1.6 bd.l. Ego E1 716 7.7 − 106 76.3 3.9 38.6 8.8 3.6 45.0 0.0 70.4 4.4 41.4 84.9 bd.l. 19.8 bd.l. 30.0 13.0 2012 Deba D2 1747 8.2 191 133 17.4 183 5.1 2.4 338 2.2 214 3.4 89.1 34.0 1.2 10.6 bd.l. 2.1 0.7 Deba D3 535 7.8 50 80.8 5.4 30.8 4.8 2.6 48.5 8.7 52.2 2.9 90.4 34.3 1.4 560 bd.l. 36.5 3.8 Deba D4 504 8.1 133 71.2 5.2 26.1 4.7 2.3 39.0 8.4 44.3 2.9 91.6 24.9 1.3 55.7 bd.l. 16.3 3.7 Mazmela M1 1171 8.2 164 157 29.8 69.7 7.2 6.5 77.8 1.7 315 4.7 41.9 12.1 bd.l. 0.7 bd.l. 1.0 bd.l. Oñati O1 317 7.6 − 80 59.4 3.0 10.5 1.8 1.5 10.3 2.6 16.3 2.7 88.3 59.7 bd.l. 21.2 bd.l. 2.0 0.5 Ego E1 584 7.7 − 83 82.8 4.3 22.1 8.3 3.9 29.4 1.7 33.2 4.6 38.4 77.5 0.5 35.3 bd.l. 19.1 2.3
presented the lowest concentrations of TIC (1.1%), TOC (2.0%) and TN (0.16%). The total sulphur content still remained quite high (0.22%).
The Ego stream shows the highest concentrations of pseudo-metals except for Fe, Mn and Cu in the fine fraction of sediments, Cr (679 μg g− 1), Ni (230 μg g− 1), Pb (111 μg g− 1) and Zn (5564 μg g− 1). The lowest pseudo-metal concentrations in fine sediments were mea-sured in the headwaters of the Deba River (D1) and tributaries (M1, O2 and A1), followed by D2 (Table 3). Therefore, O1 and D3 present interme-diate concentrations between downstream (E1 and D4) and upstream sampling points. There is no difference in the spatial distribu-tion of Fe; its concentradistribu-tion is similar in the fine sediments of the main river and of the tributaries. Finally, the same metal concentration pattern was repeated for the two years in fine sediments from the Deba catchment, so that Fe is the dominant metal followed by Zn N Mn N Cr N Cu N Ni N Pb, except at the upstream sites where Mn N Zn. Ratios of metal concentration in fine fraction (b63 μm) versus bulk sediment (b2 mm) at each sampling point are shown inTable 4. The values of this ratio vary between locations but, focusing on the mean value, we can see that Fe alone has values of b1 at all sampling points with the exception of E1, indicating lower concentrations in the fine sediment than in the bulk; Mn has almost the same mean value in both fractions with a ratio of about one; however, five metals (Cu, Ni, Cr, Pb and Zn) have mean values of N1, indicative of higher concentra-tions in the fine fraction. Comparing the mean values of this ratio in the Deba River to its tributaries (Table 4), the fine fraction has higher metal concentrations in the main river. On the other hand, apart from
Fe (r2= 0.49,Table 4), metal concentrations in both fractions are well correlated, suggesting that most of the metals followed the same trend in both fractions of all sampling points.
TOC/TS refers to the ratio of total organic carbon (TOC) to total sulphur (TS) percentages in sediment. Sulphate reduction below an ox-ygenated water column typically has TOC/TS ratios in the range of 1.5 to 5.0. Except at M1, O1 and E1 where these values were close in 2012, this ratio is much higher in all the sampling points. A dramatic temporal de-crease in the TOC/TS ratio was observed at M1 (142 to 1.8) and D3 (32.8 to 5.2) from October 2011 to 2012 (Table 3). This decrease was mainly caused by the increase in TS, whereas TOC content remained fairly stable. This suggests that sediments might be deposited under periodic anoxia, although the redox potential measured in water indicates oxygenated conditions.
4.2. Metal distribution in the fine fraction of the sediments
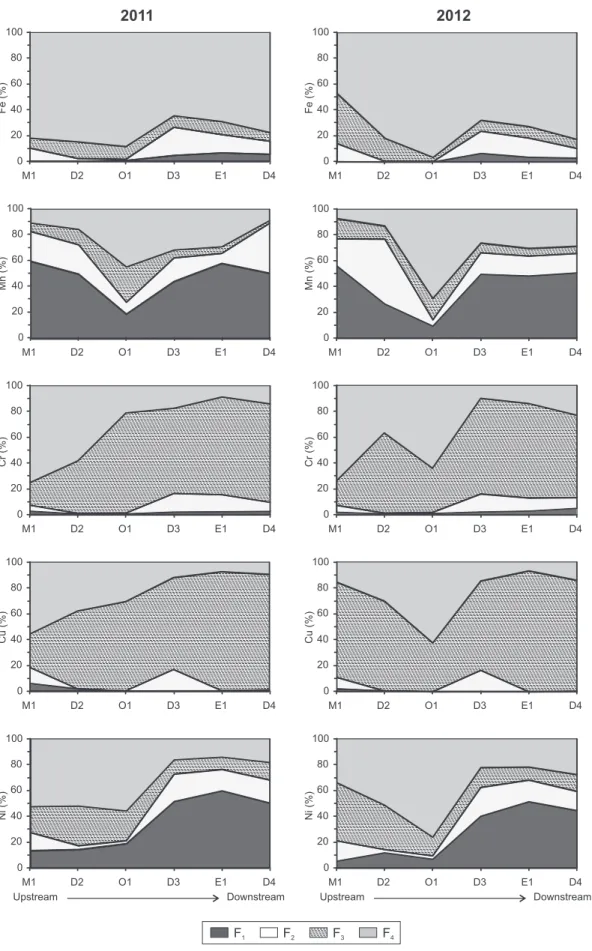
Table 5shows the mean Fe, Mn, Cr, Cu, Ni, Pb and Zn concentrations and percentages (in parentheses) of the four fractions discriminated by sequential extraction in the fine fraction of sediment for all sampling stations and the two sampling periods. A Cluster Analysis using Euclidean distance and aggregation Ward's method was also carried out to identify different groups of metals according to their distribu-tion in those four fracdistribu-tions for each sampling year. The results of the Cluster Analysis show the same pattern metal groups for the two years (Fig. 2), so that two main groups can be distinguished.
(i) One group includes Cu, Cr and Pb, which are found predominant-ly in the potentialpredominant-ly most mobile fractions (F1,2,3). These metals are predominantly extracted in F3(38.4–71.1%,Table 5), indicat-ing that organic matter and/or sulphides are the major sinks for these metals, followed by residual fraction (24–39.2%). Less than 9% of Cu and Cr are represented in the other non-residual phases (F1,2). Copper presents a pronounced tendency for complexation with sediment organic matter due to its high affinity to humic substances (Jain et al., 2007; Pacifico et al., 2007; Davutluoglu et al., 2011a), while Pb is likely to form sta-ble organic complexes and/or to be bound to sulphides (Tüzen, 2003). Chromium presents similar high concentrations and frac-tionation profiles to Cu (Fig. 3andTable 5), suggesting that both metals originate from the same anthropogenic source.
Table 4
Ratio of metal concentration in fine fraction (f, b63 μm) versus bulk fraction (b, b2 mm) were calculated in each sampling site in October 2011. The relationship (r2) between metal concentration in fine sediments and bulk sediments was also calculated. N is the number of samples considered.
River Sites Fe f/b Mn f/b Cu f/b Ni f/b Cr f/b Pb f/b Zn f/b Deba D1 0.82 1.12 1.10 1.30 1.42 3.87 1.36 Deba D2 0.48 1.01 1.30 0.95 1.35 0.86 1.15 Deba D3 0.48 1.00 2.64 1.58 3.15 1.51 2.70 Deba D4 0.54 1.05 1.35 1.76 3.27 1.28 2.39 Mazmela M1 0.87 1.20 1.75 1.52 2.14 0.78 1.45 Oñati O1 0.69 0.89 1.46 1.34 1.53 1.89 1.48 Oñati O2 0.52 0.89 1.33 1.11 1.61 2.28 1.25 Angiozar A1 0.49 0.78 1.06 0.78 1.29 0.96 0.99 Ego E1 1.15 1.11 1.31 1.17 1.24 1.61 1.03 r2(N = 9) 0.49 0.84 0.93 0.92 0.78 0.79 0.87 Table 3
Gravel, sand and mud (%) are calculated for total fraction (N2 mm–b63 μm) and bulk fraction (b2 mm). Total organic and inorganic carbon (TOC and TIC, %), total nitrogen (TN, %), total sulphur (TS, %) and pseudo-total metals (Fe (mg g−1); Mn, Cu, Cr, Ni, Pb and Zn (μg g−1)) were analysed in fine sediments (b63 μm) of all sampling sites. TOC/TS ratio was calculated. D1, O2 and A1 are considered as background-reference sites.
Total fraction Bulk
Year River Sites Gravel Sand Mud Sand Mud TOC TIC TN TS TOC/TS Fe Mn Cu Cr Ni Pb Zn
2011 Deba D1 64.0 29.6 6.4 82.2 17.8 4.8 1.0 0.45 0.03 167 22.7 470 23.6 32.6 42.8 66.9 215 Oñati O2 48.4 47.6 4.0 92.3 7.7 3.4 0.9 0.31 0.003 1117 29.4 592 28.6 37.1 32.2 57.1 243 Angiozar A1 55.7 41.8 2.5 94.4 5.6 3.3 0.4 0.29 0.01 384 27.1 865 33.1 53.0 23.6 27.6 232 2011 Deba D2 38.0 48.0 14.0 77.5 22.5 2.9 2.6 0.30 0.02 185 26.9 778 83.3 51.4 38.1 17.0 480 Deba D3 7.5 89.5 3.0 96.8 3.2 3.8 1.8 0.49 0.12 32.8 34.1 490 201 319 137 63.7 2015 Deba D4 68.1 31.2 0.6 98.0 2.0 5.1 3.0 0.79 0.13 40.4 27.9 1117 299 505 177 74.2 3083 Mazmela M1 37.1 56.9 6.1 90.4 9.6 2.2 0.9 0.16 0.02 142 32.9 705 28.3 44.7 37.1 11.5 222 Oñati O1 76.5 21.7 1.8 92.2 7.8 5.0 2.2 0.81 0.34 14.7 29.3 478 253 255 73.4 75.0 2507 Ego E1 55.0 42.1 2.9 93.5 6.5 10.6 6.7 1.52 0.45 23.5 21.5 491 318 679 230 88.3 5356 2012 Deba D2 60.7 35.9 3.5 91.9 8.1 3.6 3.5 0.43 0.03 119 27.5 1080 93.0 52.6 35.4 44.7 753 Deba D3 19.3 66.5 14.3 85.0 15.0 3.5 1.2 0.37 0.67 5.2 35.0 356 112 493 79.5 62.7 3275 Deba D4 56.0 43.6 0.4 99.1 0.9 4.1 2.1 0.64 0.07 58.9 35.3 651 196 272 113 94.7 2417 Mazmela M1 33.9 58.1 8.0 89.2 10.8 2.0 2.8 0.18 1.14 1.8 25.8 423 27.9 28.5 31.0 33.0 117 Oñati O1 89.2 10.7 0.1 99.1 0.9 2.0 1.1 0.16 0.22 9.3 38.1 559 391 282 91.9 94.0 3169 Ego E1 53.4 45.3 1.3 97.3 2.7 10.9 7.0 1.30 1.21 9.0 29.9 502 308 435 171 111 5564
(ii) The second group is composed of Mn, Ni, Zn and Fe. This cluster could be separated into two sub-clusters:
a) The first sub-group is composed of Mn, Ni and Zn. These metals are distributed, to a greater or lesser extent, among all four fractions (Table 5). The greatest proportion of Mn is mainly as-sociated with F1(up to 46.8%), followed by residual (F4), reduc-ible (F2) and oxidizable (F3) fractions (up to 29.2, 20.6 and 10.1%, respectively). Manganese tends to be present in less thermodynamically stable phases in the sediments (Tessier et al., 1979; Sakan et al., 2009). The relative predominance of Mn in the exchangeable fraction is due to this element being reduced in bottom sediments. Although Ni is mostly bound to the residual fraction (F4), especially in October 2012 (38.9%), it is closely associated to the exchangeable/carbonate fraction, F1(up to 34.4%). More than 30% of Ni is bound to F2,3(Table 5). The distribution of Zn in non-residual fractions (F1,2,3) is simi-lar (between 25.6% and 31.8%) and the lowest proportion is found in the mineral lattice of the sediment (F4b 15%). A rela-tive Zn uniformity among fractions was also found byPacifico et al. (2007)andDevesa-Rey et al. (2010a).
b) The second sub-group is exclusively composed of Fe. In con-trast, the largest proportion of Fe is associated with residual fraction (F4N 74.8%), so that this metal is strongly retained in the lattice of mineral in the fine sediment fraction and conse-quently this metal cannot be remobilized under normal condi-tions encountered in nature. This result accords with data reported by other investigators, who found that 67–90% of the total Fe was in the residual fraction (Tüzen, 2003; Jain et al., 2007; Yuan et al., 2004).
Regarding spatial–temporal changes in the metal distribution (Fig. 3), two sampling points in particular (M1 and O1) show a strong temporal variation in metal content in the different phases. In the case of M1, a general relative increase of Fe, Cu, Ni and Zn concentration was observed in the F3fraction in the second sampling year. At O1, in-deed, the proportion of all metals diminishes in the mobile fractions (F1,2,3) and increases in the residual phase (F4) in 2012, whereas the previous year most metals (Cr, Cu, Pb and Zn) were mainly bound to F3. The temporal variation of metal distribution, from F3to F4, might be linked to a decrease in organic matter content, 5% and 2% in October 2011 and October 2012 respectively (Table 3).
At sampling points E1, D3 and D4, there are slight temporal varia-tions in the percentage of metals and their distribution among the four fractions between the two years (Fig. 3). Nevertheless, the mid-(D3) and downstream (E1 and D4) sampling points show the highest proportions in the mobile fractions of Cu, Cr and Pb (first group of pre-vious classification) and Mn, Ni and Zn (first sub-group).
4.3. Spearman's correlation and principal component analysis (PCA) In order to determine affinities between physicochemical water, sediment parameters and metal distribution and thus improve our un-derstanding of their origin and behaviour in the Deba River catchment, Spearman's correlation matrix were performed, as shown inTable 6. This parametric test was carried out after the results of non-normally distributed data given by Shapiro–Wilks test. Dissolved metals were not included in this analysis since many values were below the de-tection limit (Table 2).
Some elements (Ca2+, Mg2+, Na+, Cl−, SO 4
2−, alkalinity and, to a lesser extent, K+and Si) present a significant positive correlation to one another and to EC in water (Table 6a). Nevertheless, they all show negative correlations, mostly statistically insignificant, with pseudo-total metals (Cu, Ni, Cr, Pb, Zn and Fe) in fine sediments. Most of the pseudo-total metals (Ni, Pb, Cu, Cr, and Zn), in turn, display a strong negative correlation with the pH and Eh of the water, but a positive cor-relation with TOC, TN and TS in fine sediments (Table 6a). A very sig-nificant correlation (r = 0.97) between TOC and TN indicates that the main origin of nitrogen is the mineralisation of organic matter. To a less-er extent, TIC is also positively correlated with TOC, TN and TS.
A significant positive correlation between Fe2and Cu2, Ni2, Pb2, and Cr2metals (0.71 b r b 0.76) implies that these elements are bound to Fe oxides/hydroxides, which could play an important role in complexation of these metals (Table 6b). The absence of a good correlation between these metals and Mn2suggests that the Mn oxides/hydroxides do not play a dominant role in sorption of these metals; indeed, Mn is
Table 5
Total metal content and distribution in fine sediments for all sampling sites (N = 6) of each year. The mean and standard deviation (±SD) data are presented in μg g−1dry weight (dw) for all metals, except for Fe (mg g−1). The values in parentheses show percentage of elemental concentration, where the highest percentage for each metal is shown in bold. Sum: F
1+ F2+ F3+ F4;
the total was determined by microwave assisted acid digestion; recovery: (Sum/Total)*100.
Year Metal F1:exch/carbonates F2:reducible F3: oxidizable/sulphides F4: residual Sum Total %Recovery
2011 Fe 0.89 ± 0.93 (2.8) 3.0 ± 2.4 (9.8) 2.7 ± 0.4 (9.2) 23.2 ± 4.1 (78.2) 29.7 28.8 103 Mn 339 ± 278 (46.8) 181 ± 239 (19.7) 53.7 ± 38.5 (9.9) 125 ± 43.0 (23.6) 699 678 103 Cr 6.8 ± 7.5 (1.8) 33.0 ± 42.0 (6.6) 246.6 ± 233 (59.0) 49.9 ± 27.3 (32.6) 336 309 109 Cu 0.51 ±0.63 (1.3) 6.5 ± 12.9 (5.1) 146.2 ± 115 (68.1) 28.7 ± 13.3 (25.6) 182 197 92 Ni 52.6 ± 54.6 (34.4) 17.5 ± 16.8 (12.4) 15.7 ± 6.5 (18.1) 26.9 ± 8.1 (35.1) 113 116 98 Pb 2.3 ± 2.4 (2.1) 13.8 ± 12.5 (16.8) 55.7 ± 74.4 (42.8) 36.5 ± 26.5 (38.2) 108 103 106 Zn 903 ± 827 (30.7) 983 ± 1095 (29.8) 576 ± 692 (26.1) 108 ± 68.2 (13.4) 2569 2277 113 2012 Fe 0.74 ± 0.89 (2.3) 2.7 ± 2.3 (9.0) 3.8 ± 3.0 (13.9) 23.9 ± 9.0 (74.8) 31.2 31.9 98 Mn 213 ± 88.0 (40.1) 144 ± 186 (20.6) 61.2 ± 39.0 (10.1) 171 ± 148 (29.2) 590 595 99 Cr 6.4 ± 6.1 (1.9) 27.5 ± 35.7 (6.6) 190.3 ± 185.7 (54.3) 75.6 ± 74.9 (37.2) 300 261 115 Cu 0.30 ± 0.34 (0.6) 4.6 ± 9.2 (4.4) 112 ± 112 (71.1) 20.2 ± 8.8 (24.0) 137 128 106 Ni 31.0 ± 33.1 (26.5) 12.4 ± 11.2 (12.5) 14.4 ± 1.6 (22.1) 31.7 ± 21.9 (38.9) 89.5 86.9 103 Pb 1.8 ± 1.6 (2.1) 17.0 ± 21.9 (20.4) 31.4 ± 20.7 (38.4) 28.5 ± 13.8 (39.2) 78.8 67.4 117 Zn 720 ± 638 (25.6) 952 ± 1033 (31.8) 579 ± 650 (27.8) 259 ± 424 (14.8) 2511 2549 98 25 20 15 10 5 0 Cu Cr Pb Ni Mn Zn Fe
2011
2012
Euclidean distance and aggregation Ward’s method
Fig. 2. Cluster analysis of metals according to their distribution in the four fractions for each sampling year.
0 20 40 60 80 100 M1 D2 O1 D3 E1 D4 Fe (%) 0 20 40 60 80 100 0 20 40 60 80 100 0 20 40 60 80 100 M1 D2 O1 D3 E1 D4 0 20 40 60 80 100 0 20 40 60 80 100 0 20 40 60 80 100 0 20 40 60 80 100 0 20 40 60 80 100 0 20 40 60 80 100 Fe (%) Mn (%) Mn (%) Cr (%) Cu (%) Cr (%) Cu (%) Ni (%) Ni (%)
2011
2012
Upstream Downstream Upstream Downstream
F1 F2 F3 F4
M1 D2 O1 D3 E1 D4 M1 D2 O1 D3 E1 D4
M1 D2 O1 D3 E1 D4 M1 D2 O1 D3 E1 D4
M1 D2 O1 D3 E1 D4 M1 D2 O1 D3 E1 D4
M1 D2 O1 D3 E1 D4 M1 D2 O1 D3 E1 D4
Fig. 3. Metal distribution in the four fractions considered by BCR 701 (F1, exchangeable/carbonates; F2, reducible; F3, oxidizable/sulphides; F4, residual) for both sampling campaigns and all sites.
predominantly bound to F1(Table 5). The positive correlation of Mn1 and Mn2with the pH and Eh of water (r N 0.77) could be explained by continuous changes in the potential redox which favour solubilisation of Mn compounds and favour the adsorption of this metal to the F1 frac-tion (Devesa-Rey et al., 2010a). On the other hand, Cu3, Ni3, Pb3, and Cr3 also show a strong positive correlation with TOC (0.73 b r b 0.95), thus suggesting selective adsorption of these metals into the organic matter. Finally, the positive correlation between the residual fraction of some metals (Ni4–Mn4, Ni4–Cr4, Fe4–Zn4, and Fe4–Mn4, 0.58 b r b 0.74) is like-ly to be the consequence of a common origin in rock minerals.
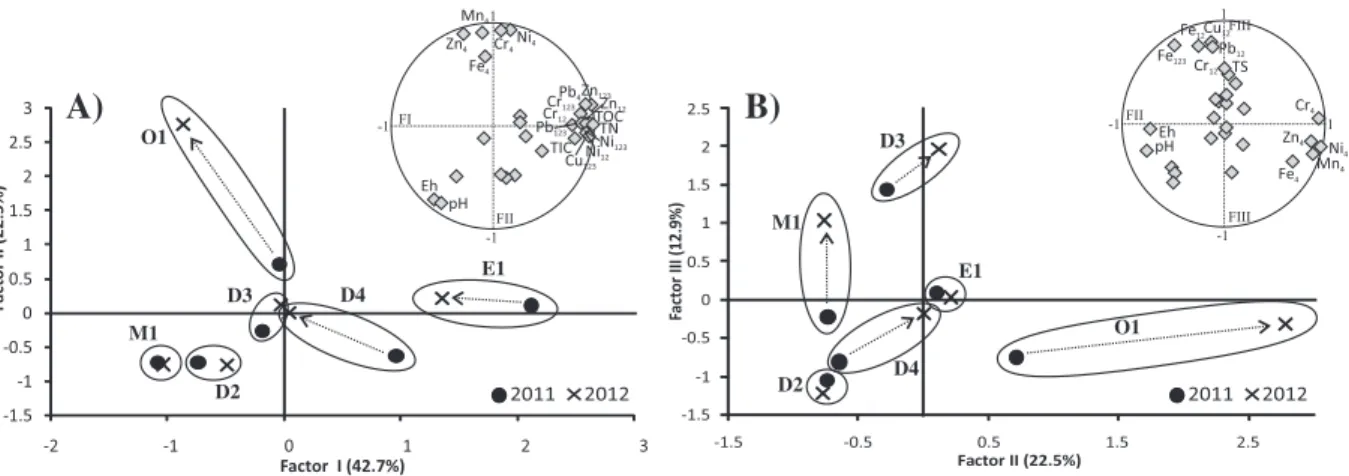
A Principal Component Analysis (PCA) was performed with the re-sults of metal fractions (Table 5), all data included inTable 3, except tex-ture data and total metal concentrations, and pH and Eh of water (Table 2). However, instead of considering all metal fractions individu-ally, the sum of non-residual fractions was taken into account in the PCA. The non-residual fractions considered can be summarised as: F12 (F1, exchangeable-carbonates, plus F2, bound to Fe and Mn oxides/hy-droxides) and F123(F12plus F3, bound to organic matter and sulphides). The residual fraction (F4) is also included, but individually.
The factorial planes I–II (Fig. 4a) reflect the most important informa-tion, with Factor I (43% of the variance) characterised by TIC, TOC, and TN, and the non-residual fractions (Cu123, Ni12, Ni123, Cr12, Cr123, Pb123, Zn12and Zn123) and residual fraction of Pb4, and Factor II (23%) positive-ly characterised by almost all residual fractions (Ni4, Cr4, Fe4, Zn4and Mn4) and negatively by Eh and pH. Factor I therefore represents the sorption of Cu, Ni, Cr, Pb and Zn by mutual substrates, such as carbon-ates, oxides/hydroxides, and organic matter/sulphides, and Factor II represents the elements that are retained in the crystal lattices of min-erals and, consequently, have low mobility. It can clearly be seen that the sediment samples with higher organic matter and labile metal fractions are distributed towards the positive side of Factor I. These sed-iment samples are progressively followed, in decreasing order of organ-ic matter and labile forms, by E1, D4, O1, D3, D2 and M1. Content of organic matter and non-residual metal forms diminishes in E1, D4 and O1 sediments from the second year (2012). On the other hand, only one sediment sample (O1) from the 2012 sampling stands on the
positive side of Factor II. The O1 site shows a strong temporal change in chemical composition from 2011 to 2012, suggesting that most metals were bound to mobile fractions in 2011 and to non-mobile frac-tion (F4) in 2012.
On the factorial planes II–III (Fig. 4b), Factor III (13%) is characterised by the association of Cu12, Pb12, Fe12and Fe123with TS (oxidisable and/ or reducible fractions of S). Sediments collected at M1 and D3 show a significant increase in these elements in 2012 along this axis, which means that they are principally associated with the carbonate and Fe/ Mn oxide fractions but, in the case of Fe, also with the organic/sulphide fraction. As mentioned above, Factor II is characterised by the residual fractions. Thus, Ni, Cr, Zn, Mn and Fe are predominantly bound to the structure of minerals at O1 and, to a lesser extent, at D4 in 2012, with a relative loss of non-residual fractions.
4.4. Contamination assessment
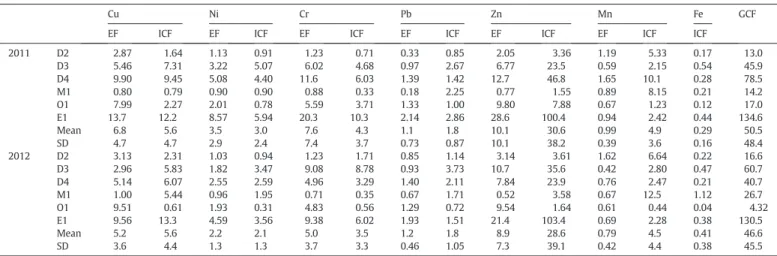
Fig. 5 shows the results of metal enrichment factors (EFs) for all locations considered in the two years. There is no general consen-sus concerning threshold of natural variability but some authors (Hernandez et al., 2003; Roussiez et al., 2013) have suggested that EF N 2 is indicative of a probable anthropogenic influence. Taking this threshold as a reference, it can clearly be seen from these plots that median EF values of Pb (b1.2) and Mn (b0.9) are below this limit. The median Ni value, however, is distributed around the limit of natural variability, especially for the second year of sam-pling. In contrast, the median EF value for Cu (4–7), Cr (5–6) and Zn (around 8) far exceeds the natural threshold. This range of values is considered by some authors (Acevedo-Figueroa et al., 2006; Sakan et al., 2009; Guo et al., 2014) as a moderately severe enrichment (from 5 to 10). It is worth noting the high EF values of Cr (20) and Zn (28), which are considered by the previous authors as a severe (10–25) and very severe (25–50) anthropogenic enrichment.
Regarding temporal variability, a decrease in anthropogenic influ-ence is observed in all metals except Zn, to a greater (Cu) or lesser (Mn and Pb) extent, between 2011 and 2012 (Table 7). The locations
0 20 40 60 80 100 0 20 40 60 80 100 0 20 40 60 80 100 Pb (%) Pb (% ) Zn (%) Zn (%) 0 20 40 60 80 100
2011
2012
Upstream Downstream Upstream Downstream
F1 F2 F3 F4
M1 D2 O1 D3 E1 D4 M1 D2 O1 D3 E1 D4
M1 D2 O1 D3 E1 D4 M1 D2 O1 D3 E1 D4
T a b le 6 Sp ea rm an 's co rr el at io n co ef fi ci ent s (r ); A ) am on g phy si co ch em ic al ch ar ac te ri st ic s of w at er an d fi ne se dim en t pa ra m et er s (N = 15 ); an d B) m et al di st ri bu ti on (N = 12 ). Co rr el at io n is si gn ifi ca nt (p ) at th e 0. 01 le ve lf or bo ld nu m be rs an d 0. 05 fo r it al ic s. TO C, to ta lo rg ani c ca rb on ;T IC ,t ot al in or ga ni c ca rb on ; TN ,t ot al ni tr og en ;T S, to ta ls ul ph ur ;E C, el ec tr ic al co nd uc ti vi ty; Eh, po te nt ia lr ed ox ; A lk ., al ka lini ty . A) Fine sedim ents (N = 15) Water (N = 15) TOC TIC TN TS Fe Mn Cu Cr Ni Pb Zn EC pH Eh Ca 2 + Mg 2 + Na + K + Si Cl − NO 3− SO 4 2− Alk . Fine sedim ent (N = 15) TOC 1.00 TI C 0 .54 1.00 TN 0 .97 0 .62 1.00 TS 0.34 0 .63 0.42 1.00 Fe − 0.16 − 0.28 − 0.16 0.08 1.00 Mn − 0.06 0.02 − 0.12 − 0 .59 − 0.01 1.00 Cu 0.46 0.50 0 .52 0 .52 0.35 0.06 1.00 Cr 0 .57 0.42 0 .59 0.50 0.30 0.03 0 .86 1.00 Ni 0 .69 0 .52 0 .71 0 .54 0.24 − 0.11 0 .80 0 .84 1.00 Pb 0 .65 0.40 0 .67 0 .57 0.31 − 0.23 0 .74 0 .60 0 .77 1.00 Zn 0 .56 0.51 0 .60 0 .59 0.37 − 0.07 0 .91 0 .91 0 .80 0 .73 1.00 Water (N = 15) EC − 0.08 0.38 − 0.08 − 0.02 − 0.49 0.10 − 0.36 − 0.26 − 0.10 − 0.46 − 0.33 1.00 pH − 0.38 − 0.43 − 0.44 − 0 .77 − 0.45 0.38 − 0 .84 − 0 .70 − 0 .73 − 0 .76 − 0 .82 0.32 1.00 Eh − 0.36 − 0.37 − 0.44 − 0 .68 − 0.24 0.24 − 0 .80 − 0 .73 − 0 .56 − 0 .70 − 0 .81 0 .52 0 .76 1.00 Ca − 0.20 0.35 − 0.20 0.19 − 0.31 − 0.14 − 0.39 − 0.32 − 0.13 − 0.40 − 0.30 0 .92 0.20 0.45 1.00 Mg − 0.37 0.02 − 0.39 − 0.18 − 0.36 0.11 − 0 .63 − 0.48 − 0.41 − 0 .69 − 0 .64 0 .84 0 .56 0 .68 0 .82 1.00 Na − 0.11 0.19 − 0.11 − 0.21 − 0 .52 0.10 − 0.49 − 0.34 − 0.19 − 0 .56 − 0.48 0 .93 0.47 0 .68 0 .80 0 .86 1.00 K 0.13 0 .69 0.20 0.49 − 0.21 − 0.01 0.27 0.32 0.38 − 0.01 0.27 0 .63 − 0.26 − 0.22 0 .62 0.37 0.38 1.00 Si 0.02 0.06 − 0.07 0.10 − 0 .57 − 0.13 − 0.47 − 0.25 − 0.15 − 0.34 − 0.43 0 .58 0.36 0.27 0 .57 0 .67 0.50 0.44 1.00 Cl − 0.12 0.21 − 0.15 − 0.15 − 0.35 0.13 − 0.40 − 0.25 − 0.09 − 0.48 − 0.38 0 .93 0.39 0 .66 0 .85 0 .86 0 .96 0.41 0.47 1.00 NO 3 − 0.26 − 0.28 − 0.28 − 0.32 0.45 0.45 − 0.07 0.18 − 0.01 − 0.27 0.00 − 0.09 0.29 0.18 − 0.07 0.17 0.03 − 0.09 − 0.15 0.14 1.00 SO 4 − 0.16 0.31 − 0.14 0.05 − 0.46 − 0.04 − 0.43 − 0.31 − 0.13 − 0.49 − 0.42 0 .94 0.29 0 .53 0 .91 0 .87 0 .92 0 .59 0 .61 0 .89 − 0.07 1.00 Alk . 0.05 0.45 0.06 0.24 − 0.38 0.04 − 0.10 − 0.03 0.05 − 0.29 − 0.14 0 .74 0.03 0.12 0 .69 0 .63 0 .53 0 .84 0 .71 0 .52 − 0.22 0 .72 1.00 B) Metal distribution (N = 12) TOC Cu 1 Cu 2 Cu 3 Cu4 Ni1 Ni2 Ni3 Ni4 Cr1 Cr2 Cr3 Cr4 Pb 1 Pb2 Pb3 Pb4 Fe1 Fe2 Fe3 Fe4 Zn 1 Zn 2 Zn3 Zn4 Mn 1 Mn 2 Mn 3 Mn 4 TOC 1.00 Cu 1 − 0.31 1.00 Cu 2 0.01 − 0.04 1.00 Cu 3 0 .95 − 0.33 0.11 1.00 Cu 4 0.49 − 0.04 − 0.40 0.39 1.00 Ni1 0 .82 − 0.44 0.29 0 .87 0.25 1.00 Ni2 0.56 − 0.25 0 .65 0 .69 − 0.19 0 .83 1.00 Ni3 0 .84 − 0.53 0.22 0 .91 0.27 0 .87 0 .77 1.00 Ni4 0.52 − 0 .81 − 0.26 0.49 0.27 0 .62 0.25 0 .58 1.00 Cr1 0 .64 − 0.53 0.45 0 .73 − 0.01 0 .90 0 .87 0 .84 0.52 1.00 Cr2 0.50 − 0.49 0.56 0 .66 − 0.24 0 .80 0 .90 0 .71 0.39 0 .87 1.00 Cr3 0 .73 − 0 .59 0.27 0 .80 0.21 0 .88 0 .74 0 .81 0.57 0 .84 0 .86 1.00 Cr4 0.31 − 0 .74 0.21 0.45 − 0.08 0 .69 0 .63 0 .64 0 .69 0 .75 0 .76 0 .75 1.00 Pb1 0 .61 − 0.23 0.57 0 .74 − 0.22 0 .78 0 .91 0 .73 0.26 0 .80 0 .88 0 .69 0.46 1.00 Pb2 0.23 − 0.22 0 .89 0.39 − 0.24 0.51 0 .76 0.50 − 0.06 0 .70 0 .77 0.55 0.43 0 .73 1.00 Pb3 0 .94 − 0.48 − 0.12 0 .90 0.45 0 .80 0.50 0 .84 0 .64 0 .69 0.53 0 .80 0.48 0.52 0.18 1.00 Pb4 0 .87 − 0.55 − 0.25 0 .84 0.41 0 .75 0.44 0 .83 0 .73 0 .66 0.48 0 .74 0.55 0.45 0.06 0 .97 1.00 Fe1 0.53 − 0.52 0 .63 0 .67 0.03 0 .80 0 .85 0 .78 0.34 0 .88 0 .89 0 .87 0 .70 0 .77 0 .84 0.53 0.46 1.00 Fe2 0.35 − 0.10 0 .80 0.50 − 0.26 0 .59 0 .83 0.48 − 0.04 0.56 0 .77 0 .58 0.36 0 .80 0 .78 0.20 0.07 0 .76 1.00 Fe3 − 0.15 0.34 − 0.14 − 0.11 0.22 − 0.40 − 0.28 − 0.20 − 0.53 − 0.47 − 0.23 − 0.11 − 0.38 − 0.27 − 0.11 − 0.20 − 0.23 − 0.11 − 0.02 1.00 Fe4 − 0.05 − 0.50 − 0.09 − 0.12 0.22 0.11 − 0.17 0.05 0.48 0.20 − 0.15 0.00 0.29 − 0.29 − 0.06 0.08 0.13 0.04 − 0.32 − 0.63 1.00 Zn 1 0 .76 − 0.55 0.31 0 .83 0.26 0 .93 0 .78 0 .84 0.56 0 .89 0 .82 0 .97 0 .76 0 .67 0.57 0 .81 0 .75 0 .87 0 .58 − 0.25 0.15 1.00 Zn 2 0 .79 − 0.56 0.16 0 .88 0.13 0 .91 0 .75 0 .85 0 .63 0 .86 0 .83 0 .92 0 .74 0 .74 0.46 0 .84 0 .82 0 .77 0.54 − 0.30 0.07 0 .93 1.00 Zn 3 0.53 − 0.43 − 0 .60 0.46 0.21 0.41 0.11 0.49 0 .73 0.31 0.12 0.33 0.38 0.12 − 0.41 0 .68 0 .81 − 0.01 − 0.31 − 0.32 0.15 0.32 0.48 1.00 Zn 4 − 0.15 − 0.33 − 0.56 − 0.22 0.55 − 0.16 − 0 .58 − 0.21 0.39 − 0.20 − 0.36 − 0.05 0.13 − 0 .62 − 0.41 0.04 0.11 − 0.25 − 0 .67 − 0.04 0 .58 − 0.05 − 0.13 0.17 1.00 Mn 1 0.03 0 .64 0.06 − 0.03 0.14 − 0.10 0.00 − 0.08 − 0.55 − 0.07 − 0.35 − 0.31 − 0.44 − 0.12 − 0.03 − 0.09 − 0.15 − 0.16 − 0.03 0.02 0.05 − 0.13 − 0.20 − 0.18 − 0.30 1.00 Mn 2 − 0.09 0 .63 − 0.01 − 0.13 0.27 − 0.30 − 0.23 − 0.23 − 0 .62 − 0.35 − 0.52 − 0.42 − 0.50 − 0.37 − 0.15 − 0.22 − 0.28 − 0.31 − 0.11 0.25 0.03 − 0.25 − 0.34 − 0.33 − 0.12 0 .86 1.00 Mn 3 − 0.43 − 0.07 − 0 .65 − 0 .58 0.25 − 0 .67 − 0 .85 − 0.48 0.01 − 0 .69 − 0 .80 − 0.57 − 0.33 − 0 .91 − 0 .76 − 0.32 − 0.20 − 0 .68 − 0 .82 0.21 0.35 − 0 .58 − 0 .60 0.16 0 .60 − 0.04 0.18 1.00 Mn 4 0.28 − 0.57 − 0.45 0.23 0.53 0.24 − 0.20 0.29 0 .74 0.16 − 0.09 0.16 0.39 − 0.22 − 0.26 0.41 0.51 − 0.03 − 0.46 − 0.40 0 .67 0.24 0.27 0.52 0 .73 − 0.29 − 0.14 0.39 1.00
with the most anthropogenic enrichment are the Ego (E1) and Oñati (O1 in 2012) tributaries and the outlet of the Deba River (D4), followed by D3, where the highest Cu, Cr and Zn values are found (Table 7). In the upper part of the catchment (M1 and D2), however, EFs are below the natural threshold (b2), suggesting that anthropogenic influence is minimal.
Taking into account that ICF reflects the risk of contamination of a water-sediment body by a pollutant (Ikem et al., 2003; Naji et al., 2010), the highest levels for Cu, Ni, Cr and Zn are computed in fine sediments at E1, followed by D4 and D3 (Table 7). Conversely, the lowest risk is found upstream (M1 and D2) and at O1 (in 2012). The mean ICF of sam-pling points are ranged in the order of Zn N Cu N Mn N Cr N Ni N Pb N Fe, with no temporal variation between the two sampling campaigns. It is in-teresting to note the strong relationship between EF and ICF for some metals (Zn and Cr, r2
N 0.83,Fig. 6), not so strong for Ni (r2= 0.67) and non-existent for Mn (r2= 0.24), Pb (r2= 0.01) and Cu (r2= 0.35). In the case of Cu, the absence of relationship is determined by the low ICF value of the O1 site in 2012. The strong relationship between the two in-dexes suggests that the elements with the most anthropogenic influence also evidence the highest risk of contamination. The GCF calculated from ICF values increases downstream (Table 7), especially in E1, D3 and D4 which are highly impacted by metal contamination. It is worth noting that the risk to the environment decreased markedly in surface sediments of O1 in the second year of sampling.
5. Discussion
5.1. Origin and intensity of the contamination
Even though treated wastewaters and industrial effluents discharged from wastewaters plants do not represent a strong source of metal
contamination, untreated and partially treated inputs can be considered as a significant source of organic matter and metals in river water and sediments, as it was also observed by other authors (Ran et al., 2000; Karageorgis et al., 2005; Alonso et al., 2006; Carter et al., 2006). This fact is reflected in those streams which still receive (Ego stream) or have re-ceived (Oñati stream) untreated or partially treated wastewater effluents for a long time, which explains their higher organic matter, nitrogen and sulphur concentrations in fine sediments. However, the diversion of Oñati sewer's effluents to a wastewater treatment plant in May 2012 has had a beneficial effect on the quality of the surface bottom fine sediments, which exhibited a marked decrease in organic matter and fine sediment concentrations in October 2012.
Apart from wastewater effluents, in the Deba River catchment there are over 100 large or medium-sized industries, some of which discharge their untreated effluents into the main river or streams. These industries constitute the most important source of metals, but they also contribute to increase the organic matter and suspended sediment loads. The con-tribution of these uncontrolled inputs could be partially responsible of the higher metal concentrations in the fine sediments of some sampling points.
Water samples collected at the mid- (D3 and O1) and low-part (D4 and E1) of the catchment seem to be affected by metal-rich effluent in-puts. Effluents from galvanising factories are likely the main source of dissolved Zn in water, especially at D3. Meanwhile, steel and metallur-gical industries and smelting factories could be considered as a signifi-cant source of Fe and, to a lesser extent, of other metals (Mn, Ni, Cr and Cu). The higher concentration of these metals in the mid- and low-water courses, in contrast with upstream locations, is an evidence of the contribution of industrial inputs to water. However, it is worth mentioning that dissolved metals measured in spot water samples may not be very reliable to obtain a comprehensive overview of the quality status of aquatic systems (Gaiero et al., 1995; Davutluoglu et al., 2011b).
Metals released to the aquatic environment through the industrial effluents were mainly found in the fine-grained fraction deposited onto surface bottom sediments in the mid- and low-part of Deba River catchment. The high enrichment factor values of most metals (Zn, Cr, Cu and Ni) and their prevalence in the fine fraction versus bulk fraction suggest a significant anthropogenic contribution, where fine sediments represent the main scavenger for those metals. However, the bulk frac-tion gives a better insight into the anthropogenic Fe contaminafrac-tion. Ad-ditionally, most of metals follow the same trend in both fractions, indicating that both are affected by the same sources of contamination, although in a different degree. The same trend was also observed by
Devesa-Rey et al. (2010b)in the Anllóns River (Spain).
Although it is universally recognised that the fine fraction is the most important in terms of anthropogenic metal accumulation, transport, bioavailability and toxicity (Eggleton and Thomas, 2004; Taylor and -1.5 -1 -0.5 0 0.5 1 1.5 2 2.5 -1.5 -0.5 0.5 1.5 2.5 Fact or III (12.9%) Factor II (22.5%) 2011 2012 D3 M1 O1 D4 E1 D2 Ni4 Fe4 Fe123 TS Eh pH Cu12 Cr4 Cr12 Pb12 Fe12 Zn4 Mn4 1 -1 -1 1 FII FIII -1.5 -1 -0.5 0 0.5 1 1.5 2 2.5 3 -2 -1 0 1 2 3 Fact or II (22.5%) Factor I (42.7%) M1 O1 D2 D3 D4 E1 Ni4 Fe4 Eh pH Cr4 Zn4 Mn4 -1 -1 1 TIC TOC TN Cu123 Ni12 Ni123 Cr12 Cr123 Pb4 Pb123 Zn12 Zn123 FI FII 2011 2012 FIII
A)
B)
Fig. 4. PCA applied to the results of BCR and some data included inTable 3for all sampling sites and both years. A) Factorial planes I–II; B) factorial planes II–III.
Mn
Zn
Pb
Cr
Ni
Cu
28
24
20
16
12
8
4
0
2011 2012Enrichment
factor
Fig. 5. Boxplot representation of Cu, Ni, Cr, Pb, Zn and Mn enrichment factors. The line is the limit of a probable anthropogenic influence (EF N 2).
Owens, 2009:Yang et al., 2009), the contribution of this fraction in some sites of this catchments (D4 and O1) is very low. Given the lack of uni-formity of fine-grained fraction content among the different sampling sites, the representativeness of contamination could be biassed. Never-theless, this fraction has been used by many authors to compare the metal contamination in river sediments and, consequently, it is widely considered as a good way to compare the status of different rivers (N'Guessan et al., 2009; Varol, 2011; Bartoli et al., 2012).
Finally, considering all sources of contamination, it can be concluded that untreated or partially treated wastewaters are the main source of organic contamination in Ego and Oñati streams. Meanwhile, untreated industrial effluents contribute to increase metal concentrations in water and sediments of those streams, but also in the mid- (D3) and low-part (D4) of the Deba River. The polluted nature of the Ego sediments means that contamination tends to be localised in a hotspot near the input (E1) and then dispersed downstream in lower concentrations. Thus, the Deba River (D4) is strongly affected by this stream, although it presents a lower flow rate.
5.2. Availability of metals and contamination risks
Organic-rich material from untreated or partially treated wastewa-ter inputs also dewastewa-termines the metal distribution in fine-sediments at
those sampling stations impacted directly (E1 and O1) or indirectly (D3 and D4) by these effluents. A substantial amount of Cu, Cr and Pb (the first group of the dendrogram) was bound to the oxidisable fraction (F3), which means that these metals are favoured to form complexes with humic substances when there is an important organic input. On the other hand, the environmental impact of untreated industrial inputs is also characterised by a higher proportion of Zn, Mn and Ni in the ex-changeable/carbonates and reducible fractions (F1,2) at the mid- and low-part of this catchment. These elements might be susceptible to re-mobilization if the physicochemical conditions of the river change (Sakan et al., 2009) and, consequently, they could be more available to aquatic biota (Eggleton and Thomas, 2004). Although Fe is the most abundant element in untreated industrial effluents, it appears to be mainly complexed to a coarser fraction, while the origin of this element in fine sediments is exclusively mineral and is consequently immobilised in the mineral lattice of the sediments. Finally, the majority of previously mentioned metals are associated with the residual fraction (F4) at head-water sampling sites, where the impact of the urban and industrial activ-ity is minimum.
Determination of the global contamination factor (GCF) in fine sed-iments has made it possible to identify the extremely high potential risk for the aquatic environment due to metal pollution in E1ND4(NO1 in 2011)ND3, Zn being the most potentially toxic element for organisms
Table 7
Enrichment factor (EF) and individual and global contamination factors (ICF and GCF) of Cu, Ni, Cr, Pb, Zn, Mn and Fe. Mean and standard deviation (SD) are calculated for each year.
Cu Ni Cr Pb Zn Mn Fe GCF
EF ICF EF ICF EF ICF EF ICF EF ICF EF ICF ICF
2011 D2 2.87 1.64 1.13 0.91 1.23 0.71 0.33 0.85 2.05 3.36 1.19 5.33 0.17 13.0 D3 5.46 7.31 3.22 5.07 6.02 4.68 0.97 2.67 6.77 23.5 0.59 2.15 0.54 45.9 D4 9.90 9.45 5.08 4.40 11.6 6.03 1.39 1.42 12.7 46.8 1.65 10.1 0.28 78.5 M1 0.80 0.79 0.90 0.90 0.88 0.33 0.18 2.25 0.77 1.55 0.89 8.15 0.21 14.2 O1 7.99 2.27 2.01 0.78 5.59 3.71 1.33 1.00 9.80 7.88 0.67 1.23 0.12 17.0 E1 13.7 12.2 8.57 5.94 20.3 10.3 2.14 2.86 28.6 100.4 0.94 2.42 0.44 134.6 Mean 6.8 5.6 3.5 3.0 7.6 4.3 1.1 1.8 10.1 30.6 0.99 4.9 0.29 50.5 SD 4.7 4.7 2.9 2.4 7.4 3.7 0.73 0.87 10.1 38.2 0.39 3.6 0.16 48.4 2012 D2 3.13 2.31 1.03 0.94 1.23 1.71 0.85 1.14 3.14 3.61 1.62 6.64 0.22 16.6 D3 2.96 5.83 1.82 3.47 9.08 8.78 0.93 3.73 10.7 35.6 0.42 2.80 0.47 60.7 D4 5.14 6.07 2.55 2.59 4.96 3.29 1.40 2.11 7.84 23.9 0.76 2.47 0.21 40.7 M1 1.00 5.44 0.96 1.95 0.71 0.35 0.67 1.71 0.52 3.58 0.67 12.5 1.12 26.7 O1 9.51 0.61 1.93 0.31 4.83 0.56 1.29 0.72 9.54 1.64 0.61 0.44 0.04 4.32 E1 9.56 13.3 4.59 3.56 9.38 6.02 1.93 1.51 21.4 103.4 0.69 2.28 0.38 130.5 Mean 5.2 5.6 2.2 2.1 5.0 3.5 1.2 1.8 8.9 28.6 0.79 4.5 0.41 46.6 SD 3.6 4.4 1.3 1.3 3.7 3.3 0.46 1.05 7.3 39.1 0.42 4.4 0.38 45.5 D2 D3 D4 M1 O1 E1 D2 D3 D4 M1 O1 E1 y = 0.6257x + 1.8512 R² = 0.35 0 2 4 6 8 10 12 14 16 F CI EF