Université de Montréal
Anaerobic Digestibility of Microalgae
Fate and Limitations of Long Chain Fatty Acids in the
Biodegradation of Lipids
par
Rekia Hamani Abdou
Département de Microbiologie et Immunologie
Faculté de Médecine
Mémoire présenté à la Faculté de Médecine
en vue de l’obtention du grade de Maîtrise en Microbiologie et Immunologie
Avril 2012
Faculty of Medicine
This thesis entitled:
Anaerobic Digestibility of Microalgae
Fate and Limitations of Long Chain Fatty Acids in the Biodegradation of Lipids
By
Rekia Hamani Abdou
has been evaluated by the following jury:
President-Reviewer: Patrick Hallenbeck
Thesis Supervisor: Serge Guiot
iii
Abstract
Anaerobic digestion is a biological process in which an anaerobic microbial consortium converts organic matter into biogas, primarily methane and carbon dioxide. Among the organic substrates, lipids are the most productive of methane in comparison to carbohydrates and proteins; but their degradation is very difficult, due to their hydrolysis which can be the limiting step. Algae can be an important source for methane production because of their potentially high content of lipids.
The objective of this study was, therefore, to evaluate the methane production of microalgae using the Biochemical methane Potential (BMP) technique and to identify the limit of biodegradation of lipids in the anaerobic digestion.
The experimentation plan was divided into the following stages: 1) Compare the energy potential in methane of macroalgae versus microalgae. 2) Screen different species of freshwater and marine microalgae to compare their methane potential. 3) Determine the impact of mild pretreatment of targeted microalgae on the methane production. 4) Identify the limits of biodegradation of algal lipids in the anaerobic digestion by studying kinetics limiting steps of lipids and individual LCFA (Long Chain Fatty Acids).
The results showed that microalgae produce more methane than macroalgae. The BMP of freshwater and marine microalgae showed no difference in terms of methane yield. The results of pretreatment showed that the thermal (microwave) pretreatment seemed to be more effective than the chemical (alkaline) pretreatment. A BMP control test done on palm oil, macadamia oil and fish oil showed that the hydrolysis of oils in glycerol and LCFA was not the limiting step in the production of methane. The addition of fat in the samples of defatted
Phaeodactylum increased the methane yield and this augmentation was correlated to the quantity
of fat added.
iv
Résumé
La digestion anaérobie est un processus biologique dans lequel un consortium microbien complexe fonctionnant en absence d’oxygène transforme la matière organique en biogaz, principalement en méthane et en dioxyde de carbone. Parmi les substrats organiques, les lipides sont les plus productifs de méthane par rapport aux glucides et aux protéines; mais leur dégradation est très difficile, en raison de leur hydrolyse qui peut être l’étape limitante. Les algues peuvent être une source importante pour la production de méthane à cause de leur contenu en lipides potentiellement élevé.
L’objectif de cette étude était, par conséquent, d’évaluer la production en méthane des microalgues en utilisant la technique du BMP (Biochemical méthane Potential) et d’identifier les limites de biodégradion des lipides dans la digestion anaérobie.
Le plan expérimental a été divisé en plusieurs étapes: 1) Comparer le potentiel énergétique en méthane des macroalgues par rapport aux microalgues. 2) Faire le criblage de différentes espèces de microalgues d’eau douce et marines afin de comparer leur potentiel en méthane. 3) Déterminer l'impact des prétraitements sur la production de méthane de quelques microalgues ciblées. 4) Identifier les limites de biodégradation des lipides algaux dans la digestion anaérobie, en étudiant les étapes limitantes de la cinétique des lipides et de chacun des acides gras à longues chaines.
Les résultats ont montré que les microalgues produisent plus de méthane que les macroalgues. Les BMP des microalgues d'eau douce et marines n'ont montré aucune différence en termes de rendement en méthane. Les résultats des prétraitements ont montré que le prétraitement thermique (microonde) semblait être plus efficace que le prétraitement chimique (alcalin). Les tests de contrôle du BMP faits sur l'huile de palme, l’huile de macadamia et l'huile de poisson ont montré que l'hydrolyse des huiles en glycérol et en acides gras à longues chaines n'était pas l'étape limitante dans la production de méthane. L'ajout de gras dans les échantillons de Phaeodactylum dégraissée a augmenté le rendement de méthane et cette augmentation a été corrélée à la quantité de matières grasses ajoutées.
v
Acknowledgements
This thesis would not have been possible without Dr. Serge Guiot who, through faith and patience, gave me the opportunity to join his team and carry out this work. Thank you.
My sincere gratitude goes to Jean-Claude Frigon, who has given me the taste for work well done through rigorous follow-ups. His great qualities as a trainer, a mentor, and his presence at my side through every step of this work reveal the attention he pays to his students.
I would like to thank the environmental and bioengineering team for easing my transition and integration: Mrs. Michelle Manuel France, Mrs. Punita Mehta, Mrs. Frederique Lebrun, Mrs. Caroline Roy, Mrs. Chardeen Peter, Mrs. Marie J. Levesque, Mrs. Ruxandra Cimpoia, Mr. Ali Bayanne, Mr. Charles Dube, and Mr. Mathieu Haddad.
Last but not least, many thanks to Paola Escobar, Silvia Sancho, Aureline Prudhomme and Emma Gavalda for all the fun, support and friendship.
Acknowledgements of Financial Support
The author is grateful to Mr. Pierre Sylvestre, CEO, EBI energy, 61 Montcalm Street, Berthierville, Quebec, who kindly funded part of this work. The other part was supported by the NRC-National Bioproducts Program (Project 4: Biofuels from Marine Algae).
Dedication
To my father, Abdou Hamani, and my mother, Haoua Keita: your advices, teachings and support, despite the distance that separates us, have been an inspiration to me. This work is entirely dedicated to you.
To my husband, Bachir Ganda: thank you for your love and support. You were always present to share my joys, take care of our children, comfort and help me regain confidence in difficult times. This work is also yours.
To my daughters, Hayrah Aminata and Naila Awa: thank you for your patience when I could not kiss you good night, find through this work all my affection and love.
To my sisters and confidantes, Safi, Reina and Hamsatou: this work is the fruit of your love and ongoing support.
vi
Table of Contents
Chapter One - Introduction: Literature ... 1
I. Microalgae... 1
II. Chemical Composition of Microalgae ... 1
II-1 Proteins and Amino Acids ... 1
II-2 Carbohydrates ... 2
II-3 Lipids ... 2
II-4 Hydrocarbons... 5
II-5 Vitamins... 5
II-6 Pigments ... 6
III. Uses of Algae ... 6
IV. Algae as a Source of Energy ... 7
IV-1 Biodiesel and Bioethanol ... 7
IV-2 Methane ... 8
IV-3 Techniques for Obtaining Biodiesel and Methane from Algae ... 8
V. Anaerobic Digestion... 9
V-1 Microbiology of the Anaerobic Digestion ... 10
V-2. Physical and Chemical Parameters Influencing the Anaerobic Digestion ... 12
V-3. Biomethanisation of Lipids ... 14
V-4. Role of Volatile Fatty Acids (VFA) in the Anaerobic Digestion of Lipids ... 15
V-5. Role and Inhibition potential of Long Chain Fatty Acids (LCFA) in the Anaerobic Digestion of Lipids ... 15
VI. Biomethanization of Algae and Aquatic Plants ... 17
VII. Study Objectives ... 22
VII-1. Principal Objective ... 22
VII-2. Specific Objectives ... 22
Chapter Two: Methodology ... 23
vii
I-1 pH ... 23
I-2 Chemical Oxygen Demand (COD)... 23
I-3. Solids ... 24
1-4. Volatile Fatty Acids (VFA). ... 25
I-5. Anions and Cations ... 25
II. Biochemical Methane Potential (BMP) ... 26
II-1. Inoculum ... 26
II-2. Substrates ... 26
II-3. Reagents... 27
III. Pretreatment ... 32
III-1. Thermal Pretreatment ... 32
III-2. Chemical Pretreatment ... 33
IV. Lipid Profile Activities ... 33
IV-1. Determination of the Composition of LCFA in Different Microalgae ... 33
IV-2. Choice of Algae and Pure LCFA ... 34
IV-3. BMP of Microalgae Phaeodactyllum tricornutum Rich in Lipid ... 34
V. Activity Tests ... 34
V-1. Hydrolysis Test on Oils ... 34
V-2. Activity Test on LCFA ... 35
Chapter Three: Results and Discussion ... 37
I. Objective 1: Macroalgae ... 37
I-1. Characterization of the Samples ... 37
I-2. Methane Yield ... 41
II. Objective 2: Screening of Different Strains of Microalgae ... 42
II-1. Characterization of Freshwater Algae ... 42
II-2. Characterization of the Marine Algae ... 47
II-3. Methane Yield of Freshwater and Marine Algae ... 49
viii
III-1. Characterization of the Samples... 51
III-2. Methane Yield ... 53
IV. Lipid Profile of selected algae, and limits in their biodegradation ... 54
IV-1. Choice of Algae, Pure Acid and Enrichment Preparation... 54
IV-2. Fatty acid composition of the selected algae... 55
IV- 3. Hydrolysis Test on Palm Oil, Macadamia Oil and Fish Oil ... 57
IV-4. Activity Test on Palmitic Acid (C16:0), Palmitoleic Acid (C16:1) and Eicosapentaenoic Acid (EPA). ... 60
IV-5. BMP of Phaeodactyllum tricornutum Rich in Palmitic, Palmitoleic and Eicosapentaeonoic Acids at 10%, 25% and 50%. ... 63
Chapter Four - Conclusion and Perspectives ... 66
I. Conclusion ... 66
II. Contribution to Knowledge ... 67
III. Future works ... 67
ix
List of Figures
Figure 1: Techniques for Obtaining Biodiesel and Methane from Algae ... 9
Figure 2: Anaerobic Conversion of Biomass to Methane ... 11
Figure 3: Inoculum in the Form of Granules of Bacteria ... 26
Figure 4: Vessel for Anaerobic Digestion Test ... 30
Figure 5: Rotary Shaker . ……….. 30
Figure 6: Burette for Biogas Measure ... 30
Figure 7: Gas Chromatograph ... 30
Figure 8: Methane Potential of Ascophyllum nodosum and Fucus edentatus ... 42
Figure 9: Methane Yield of Scenedesmus dimorphus, Neochloris oleoabundans, Chlorella vulgaris, Scenedesmus sp. PN2, Scenedesmus sp. AMDD, Chlorella sorokiniana, Chlorella sp. island R, Chlamydomonas debaryana ambi, Chlamydomonas sp. AMLS1b and Microactinium sp. Rb1 ... 47
Figure 10: Methane Yield of Nannochloropsis gaditana, Phorphyridium aeruginosa, Phaeodactylum tricornutum and Thalassiosira weissflogii ... 49
Figure 11: Methane Yield of Scenedesmus dimorphus and Neochloris oleoabundans with Pretreatment ... 52
Figure 12: Methane Yield of Palm, Macadamia and Fish Oils ... 59
Figure 13: Methane Yield of Palmitic Acid, Palmitoleic and Eicosapentaenoic Acids ... 61
Figure 14: Methane Yield of Palmitoleic Acid ... 61
Figure 15: Curves of Methane Yield Showing the Process of Inhnibition and Degradation for the two bottles (duplicate) of Palmitoleic Acid ... 62
Figure 16: Methane Yield of Defatted Phaeodactyllum Tricornutum Added with 10%, 25% and 50% of EPA, Palmitic, Palmitoleic Acids ... 65
x
List of Tables
Table I: Gross Chemical Composition of Human Food Sources and Different Algae ... 2
Table II: Lipid Content of Different Microalgae ... 4
Table III: Analytical Data on Fatty Acid Composition of Lipids of Different Algae... 5
Table IV: Methane Yield of Different Algae and Aquatic Plants ... 19
Table V: COD Reagents... 24
Table VI: Fatty Acid Gas Chromatography Vial Preparation ... 25
Table VII: Anaerobic Medium ... 27
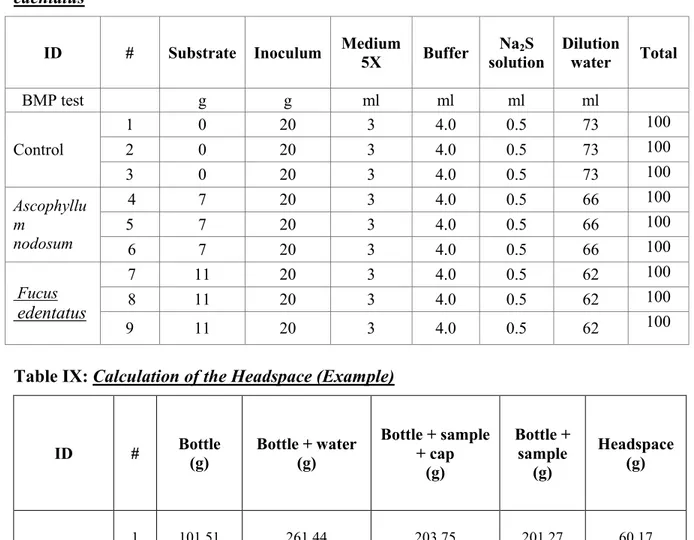
Table VIII: Example of BMP Preparation: Macroalgae Ascophyllum nodosum and Fucus edentatus ... 29
Table IX: Calculation of the Headspace ... 29
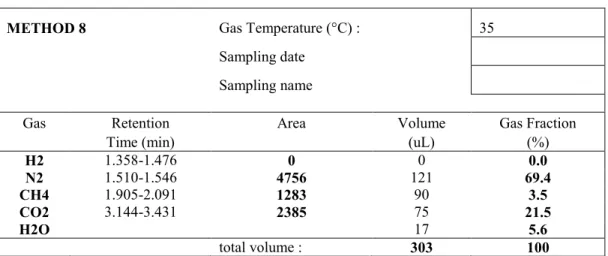
Table X: In-House Template for Gas Calculation by Method 8 ... 31
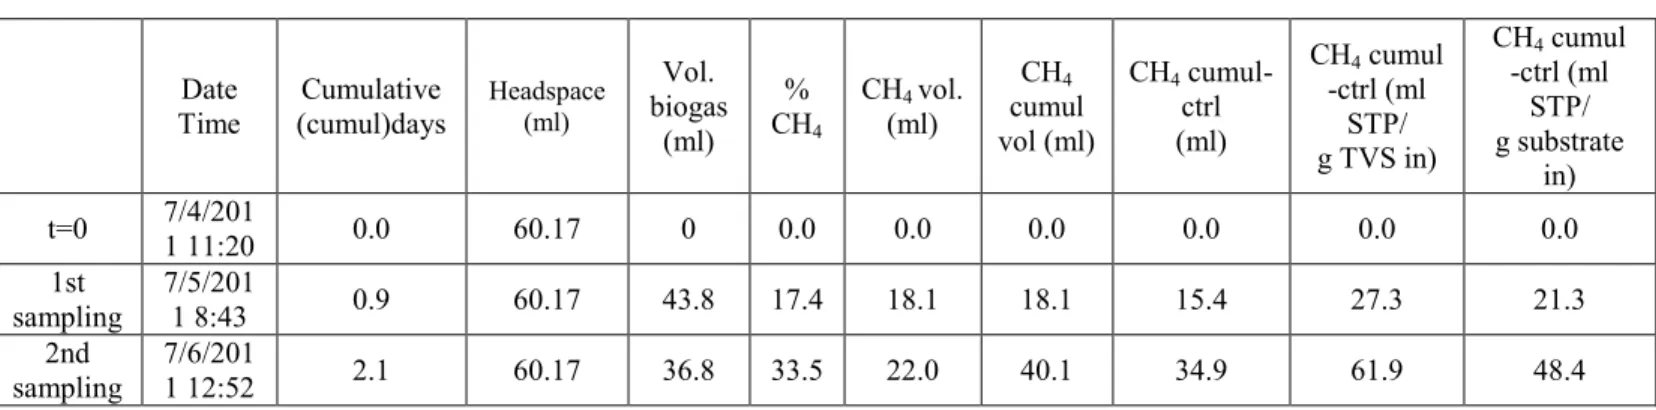
Table XI: Calculation of the Methane Volume ... 32
Table XII: Preparation of Lipid - Enriched Phaeodactyllum tricornutum at 10, 25 and 50% of Total Lipids ... 36
Table XIII : Characterization of Ascophyllum nodosum and Fucus edentatus ... 38
Table XIV : to Analysis for the BMP Assay for Ascophyllum nodosum and Fucus edentatus .... 38
Table XV: Final Values of Methane and Different Parameters for the BMP Assay for Ascophyllum nodosum and Fucus edentatus ... 39
Table XVI: Characterization of Different Parameters of Scenedesmus dimorphus, Neochloris, oleoabundans, Chlorella vulgaris, Scenedesmus sp. PN2 and Scenedesmus sp. AMDD ... 44
Table XVII: Characterization of Different Parameters of Chlorella sorokiniana, Chlorella sp. Island R, Chlamydomonas debaryana ambi, Chlamydomonas sp. AMLS1b, Microactinium sp. Rb1 ... 44
Table XVIII: to and tfinal Values of Methane and Different Parameters for the BMP Assay for Scenedesmus dimorphus, Neochloris oleoabundans, Chlorella vulgaris, Scenedesmus sp. PN2 and Scenedesmus sp. AMDD ... 45
Table XIX: to and tfinal Values of Different Parameters for the BMP Assay for Chlorella sorokiniana, Chlorella sp. island R, Chlamydomonas debaryana Ambi, Chlamydomonas sp. AMLS1b, Microactinium sp. Rb ... 46
xi Table XX: Characterization of Different Parameters for the BMP Assay for Phorphyridium
aeruginosa, Phaeodactylum tricornutum, Thalassiosira weissflogii and
Nannochloropsis gaditana ... 48
Table XXI: to and tfinal Values of Methane and Different Parameters for the BMP Assay for Phorphyridium aeruginosa, Phaeodactylum tricornutum, Thalassiosira weissflogii
and Nannochloropsis gaditana. ... 48 Table XXII : Characterization of Different Parameters of Scenedesmus dimorphus and
Neochloris oleoabundans with Pretreatment ... 51
Table XXIII: Final Values of Methane and Different Parameters of Scenedesmus dimorphus and Neochloris oleoabundans with Pretreatment ... 52 Table XXIV: Initial Composition of Fatty Acid for Phaeodactylum tricornutum, Thalassiosira
weissflogii and Chlorella vulgaris ... 56
Table XXV: Composition of Phaeodactylum tricornutum at Different Concentrations of LCFA 56 Table XXVI: Different Concentrations of C16:0, C16:1, C20:5 at 10, 20 and 50% in
Phaeodactylum tricornutum Defatted ... 56
Table XXVII: Initial Values of Different Parameters of Palm, Macadamia and Fish Oils ... 57 Table XXVIII: Values of VFA, Isovalerate, Valerate and Caproate of Palm, Macadamia and Fish Oils at Day 9 ... 58 Table XXIX: to and tFinal Values of Different Parameters of Palm, Macadamia and Fish Oils ... 58
Table XXX: Percentage of Degradation or Accumulation* in Fatty Acid Profile of Palmitoleic Acid ... 62
xii
Abbreviations and notations
AD: Anaerobic digestion
BMP: Biochemical Potential Methane sCOD: Soluble chemical oxygen demand tCOD: Total chemical oxygen demand EPA: Eicosapentaenoic acid
FID: flame ionization detector GC: gas chromatography
HPLC: high performance liquid chromatography HRT: Hydraulic retention time (day)
LCFA: Long chain fatty acid
OLR: Organic loading rate (gVS /l/day) SS: Suspended solids (g/kg)
TCD: thermal conductivity detector TS: Total solids (g/kg)
TVS: Total Volatile solids (g/kg)
UASB: Up flow anaerobic sludge blanket reactor VFA: Volatile fatty acid (mg/l)
Chapter One - Introduction: Literature
I. Microalgae
Microalgae constitute a large and diverse group of prokaryotic and eukaryotic photosynthetic microorganisms. Unlike higher plants, these microscopic plants lack vascular systems for nutrient and water transport, but compensate that by their very large surface to volume ratio (Van Harmelen and Oonk, 2006). They are found in all ecosystems: aquatic, terrestrial and can be produced rapidly under difficult climatic conditions due to their unicellular or simple multicellular structure (Li et al., 2008). It is estimated that 50,000 species of microalgae have been discovered, but only 30,000 have been studied and analyzed (Richmond, 2004). Microalgae are capable of reproducing themselves by photosynthesis using solar energy, water and carbon dioxide (Chisti, 2008). It is estimated that the biomass productivity of microalgae could be 50 times more than that of switchgrass, which is the fastest growing terrestrial plant (Li et al., 2008).
II. Chemical Composition of Microalgae
The chemical composition of algae is not constant and the proportions of the different constituents depend on many environmental factors such as temperature, illumination, pH value of the medium, mineral nutriments, and CO2 supply. A desired proportion of the constituents of
algae can be obtained by varying the culture conditions, like the nitrogen or phosphorus depletion in the medium or by changing the physical factors, for instance, osmotic pressure, radiation intensity, population density, light or dark growth (Becker, 1994). In their study, Spoehr and Milner (1949) described the effects of environmental conditions and the effects of changing nitrogen supply on the lipid and chlorophyll content of chlorella and some diatoms. Some of the constituents found in algae are: proteins, amino acids, carbohydrates, vitamins, pigments (chlorophyll, carotenoids, and phycobiliproteins) and lipids.
II-1 Proteins and Amino Acids
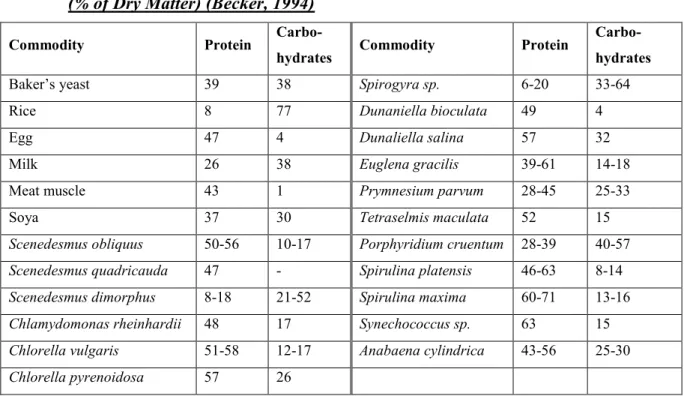
The high protein content of many microalgal species was one of the most important reasons for considering them as an unconventional source of proteins (Cornet, 1998; Soletto et al., 2005). As it can be seen in Table I, they contain more proteins than the other vegetable sources such as rice, wheat, vegetables; but some algae have fewer proteins than animal sources of protein such
2 as milk, egg and meat (Mata et al., 2010). The nutritional quality of a protein depends on the content, proportion and availability of the amino acids (Becker, 1994). While plants can synthesize all amino acids, animals and humans are capable of synthesizing only the non-essential amino acids, and look for the non-essential ones in their food (Guil-Guerrero et al, 2004). The composition of amino acids in the different species of microalgae is then important because they are primarily considered as source of proteins.
II-2 Carbohydrates
In microalgae, carbohydrates are in form of starch, glucose, sugars and other polysaccharides. They have a high digestibility, thus the dried whole microalgae can be used in large amounts in food or feeds (Becker, 2004). Table I gives the chemical composition of carbohydrates in different algae.
Table I: Gross Chemical Composition of Human Food Sources and Different Algae (% of Dry Matter) (Becker, 1994)
Commodity Protein
Carbo-hydrates Commodity Protein
Carbo-hydrates
Baker’s yeast 39 38 Spirogyra sp. 6-20 33-64
Rice 8 77 Dunaniella bioculata 49 4
Egg 47 4 Dunaliella salina 57 32
Milk 26 38 Euglena gracilis 39-61 14-18
Meat muscle 43 1 Prymnesium parvum 28-45 25-33
Soya 37 30 Tetraselmis maculata 52 15
Scenedesmus obliquus 50-56 10-17 Porphyridium cruentum 28-39 40-57
Scenedesmus quadricauda 47 - Spirulina platensis 46-63 8-14
Scenedesmus dimorphus 8-18 21-52 Spirulina maxima 60-71 13-16
Chlamydomonas rheinhardii 48 17 Synechococcus sp. 63 15
Chlorella vulgaris 51-58 12-17 Anabaena cylindrica 43-56 25-30
Chlorella pyrenoidosa 57 26
II-3 Lipids
The lipids are a large and diverse group of molecules with different structures, principally composed of hydrogen, carbon and oxygen. They are soluble in non-polar organic solvents (ether, chloroform, benzene acetone) and insoluble in water. Commonly known as fats or oils,
3 lipids are one of the major components of organic matter in waste or wastewaters (Li et al., 2002). These compounds are glycerol bounded to long chain fatty acids (LCFA), alcohols or other groups with an ester linkage (Cavaleiro et al., 2008). Fats contain saturated LCFA, and oils are normally composed of unsaturated fatty acids (Alves et al., 2009). The triacylglycerols also called neutral fats are the most abundant family of lipids (Cavaleiro et al., 2008). Algae have a high content of lipids, which varies between 1 and 70%. These rates can reach 90% of dry matter under the influence of certain factors (Mata et al., 2010). Some microalgae such as
Chlorella, Crypthecodinium, Cylindrotheca, Dunaliella, Isochrysis, and Nannochloris have lipid
levels between 20 and 50%. Brotryococcus braunii contains up to 75% of lipid and
Porphyridium cruentum contains 60.7%. Table II shows the lipid content of different
microalgae. An important factor is also the fatty acid composition of different species of microalgae. Algal lipids are composed of glycerol, sugars or bases esterified to fatty acids. These fatty acids may be saturated or unsaturated with 12-22 carbon atoms (Mata et al., 2010). Some cyanobacteria, especially the filamentous ones, have a larger amount of polyunsaturated fatty acids (25-60% of the total). Eukaryotic algae have more saturated and monosaturated fatty acids (Becker, 1994). The most common storage lipids are triacylglycerol which constitute up to 80% of the total lipids fraction (Sheehan et al., 1998). Many nutritional and environmental factors can affect the quantity of fatty acids. Piorreck et al. (1984) showed the effects of different nitrogen regimes on lipid content of different algae: two green algae Chlorella vulgaris and Scenedesmus obliquus and four blue-green algae Anarystis nidulans, Microcystis
aeruginosa, Oscillatoria rubescens and Spirulina platensis. The study showed that low nitrogen
levels enhanced the percentage of lipid (45% of the biomass) and 70% of these were neutral lipids such as triacylglycerols (containing mainly 16:0 and 18:1 fatty acids). However, at high nitrogen levels, the percentage of total lipids dropped to about 20% of the dry weight and the predominant lipids were polar lipids containing polyunsaturated C16 and C18 fatty acids. Besides
nitrogen, silicon deficiency can increase the amount of lipids in diatoms. Light increases the formation of polyunsaturated C16 and C18 fatty acids in Chlorella and a low temperature favors
the synthesis of polyunsaturated C18 fatty acids in some algae; it also changes the fatty acids
composition of Dunaliella (Becker, 1994). Fatty acids can differ depending on the type of algae. Table III gives the fatty acid composition of lipids in five different algae. Linolenic acid (18:3) is common in Chlorophycee (Scenedesmus obliquus, Dunaliella bardawil), whereas, in
4 the major fatty acids. In Rodophyceae such as Porphyridium sp., the most abundant fatty acids found are arachidonic acid (C 20:4), palmitic, oleic (C 18:1) and linoleic acids (C 18:2) (Becker,
1994).
Table II: Lipid Content of Different Microalgae (Mata et al., 2010; Becker, 1994)
Algae Lipid Content
(% of dry matter) Algae
Lipid Content (% of dry matter)
Anabaena cylindrica 4-7 Monallanthus salina 20.0-22.0
Ankistrodesmus sp. 24-31 Nannochloris sp. 20.0-56.0
Botryococcus braunii 25-75 Nannochloropsis oculata 22.7-29.7
Chlamydomonas reinhardtii 21 Nannochloropsis sp. 12.0-53.0
Chlorella emersonii 25-63 Neochloris oleoabundans 29-65
Chlorella protothecoides 14.6-57.8 Nitzschia sp. 16.0-47.0
Chlorella sorokiniana 19-22 Oocystis pusilla 10.5
Chlorella vulgaris 5-58 Pavlova salina 30.9
Chlorella sp. 10-48 Pavlova lutheri 35.5
Chlorella pyrenoidosa 2 Phaeodactylum tricornutum 18.0-57.0
Chlorella 18-57 Porphyridium cruentum 9.0-18.8/60.7
Chlorococcum sp. 19.3 Scenedesmus obliquus 11-55
Dunaliella salina 6.0-25.0 Scenedesmus quadricauda 1.9-18.4
Dunaliella primolecta 23.1 Scenedesmus sp. 19.6-21.1
Dunaliella tertiolecta 16.7-71.0 Skeletonema sp. 13.3-31.8
Dunaliella sp. 17.5-67.0 Skeletonema costatum 13.5-51.3
Ellipsoidion sp. 27.4 Spirogyra sp. 11-27
Euglena gracilis 14-20 Spirulina platensis 4-16.6
Haematococcus pluvialis 25 Spirulina maxima 4-9
Isochrysis galbana 7.0-40.0 Thalassiosira pseudonana 20.6
Isochrysis sp. 7.1-33 Tetraselmis suecica 8.5-23.0
5
Table III: Analytical Data on Fatty Acid Composition of Lipids of Different Algae (Becker, 1994) Fatty Acid C:D Spirulina platensis Spirulina maxima Scenedesmus obliquus Chlorella vulgaris Dunaliella bardawil 12:0 0.4 tr 0.3 - - 14:0 0.7 0.3 0.6 0.9 - 14:1 0.2 0.1 0.1 2.0 - 15:0 tr tr - 1.6 - 16:0 45.5 45.1 16.0 20.4 41.7 16:1 9.6 6.8 8 5.8 7.3 16:2 1.2. tr 1.0 1.7 - 16:4 - - 26.0 - 3.7 17:0 0.3 0.2 - 2.5 - 18:0 1.3 1.4 0.3 15.3 2.9 18:1 3.8 1.9 8.0 6.6 8.8 18:2 14.5 14.6 6 1.5 15.1 18:3 0.3 0.3 28.0 - 20.5 18:3 21.1 20.3 - - - 20:2 - - - 1.5 - 20:3 0.4 0.8 - 20.8 -
Note: tr: traces C: number of atoms D: number of double bounds II-4 Hydrocarbons
There are only a few species of microalgae that contain a large amount of hydrocarbons:
Dunaniella sp. as source of carotenoids and Botrycoccus braunii as a source of a mixture of
unique C17-C34 hydrocarbons. Botrycoccus braunii has 20% of hydrocarbon during exponential
growth (Becker, 1994).
II-5 Vitamins
Microalgae constitute an important source of all essentials vitamins (A, B1, B2, B6, B12, C, E,
Nicotinate, Biotin, Folic acid). The quantity of vitamin in algae varies with environmental factors and growth conditions. The drying processes decrease the amount of vitamins B1, B2, C
6 surprising because it is usually not found in plants. Spirulina is considered as a microalga rich in vitamin B12 (Becker, 1994).
II-6 Pigments II-6-1 Chlorophyll
One important feature of algae is their color. Algae contain one or more types of chlorophyll. Chlorophyll-a is the primary photosynthetic pigment in all algae and it is the only chlorophyll in the cyanobacteria (blue-green algae). Chlorophylls –b, -c, -d, -e can also be found in marine algae and fresh water diatoms. Chlorophylls amount are usually about 0.5 to 1.5% of dry weight (Becker, 1994).
II-6-2 Carotenoids
Carotenoids are the second important pigment found in algae. They are yellow, orange or red lipophilic pigments of aliphatic or alicyclic structure composed of eight, five-carbon (isoprenoid) units, which are linked so that the methyl groups nearest the center of the molecule are in the 1, 5-positions, whereas all other lateral methyl-groups are in the 1, 6-positions. Certain carotenoids are found in most algal classes, whereas others occur only in few classes of algae. The average concentration of carotenoids in algae is 0.1-2% of dry weight. However, when certain algae like
Dunaliella bardawil are grown under favorable conditions (high light intensity), their amount of
ß-carotene can vary from 2 to 14% (Becker, 1994).
II-6-3 Phycobiliproteins
Phycobiliproteins are deep colored water-soluble proteinaceous accessory pigments, which are components of a complex assemblage, the phycobilisomes.
III. Uses of Algae
The cultivation of algae and their use as a source of nutriments (such as lipids) started in large scale in Germany, during the World War II. The culture of the green alga Chlorella was initiated by a group of scientists at the Carnegie Institution of Washington. The production of microalgae and cyanobacteria is rapidly increasing throughout the world. Some country like Japan, USA, China, produce over 10,000 tons of microalgal biomass annually (Van Harmelen and Oonk, 2006). Over the past few years, many countries have successfully adapted the cultivation of algae and their various applications have received considerable attention:
7 1) in human nutrition: protein and dietary supplements. Four strains are the most commercially
used: Arthrospira (Spirulina) platensis rich in proteins, with a high nutritive value (Soletto et al., 2005); Chlorella used as a food additive (Yamaguchi, 1996; Gouveia et al., 1996);
Dunaliella salina used as an ingredient in dietary supplements;
2) in animal nutrition: microalgae can be used in the feed of animals. Arthrospira is used for farm animals and pets such as cats, dogs, birds (Spolaore et al., 2006). Chlorella,
Tetraselmis, Isochrysis, Pavlova, Phaeodactylum, Chaetoceros, Nannochloropsis,
Skeletonema and Thalassiosira are the species most used in aquaculture (Apt and Behrens.,
1999; Muller-Feuga, 2000; Borowitzka, 1997);
3) in therapeutics: β carotene is used in treatments for skin cancer, antibiotics for wound treatment, regulation of cholesterol synthesis, and as enzymatic hydrolyzate that promote skin metabolism;
4) as pigments: β carotene for food color and food supplement, phycobillins as food color, in diagnostics, cosmetics and analytical reagents;
5) as source of fine chemicals: glycerol is used in foods, beverages, cosmetics, and pharmaceuticals;
6) as hormones: auxins, gibberllins, cytokines (Becker, 1994).
IV. Algae as a Source of Energy
Microalgae are one of the promising sources of biomass in the energy field. Because their growth rate is high (10-30 g dry weight m-2 d -1), they require an intensive culture, with high nutrients (Goldman, 1979). The use of microalgae as a source of energy increased with the oil crisis during the 1970s (Cornet, 1998). Several types of renewable biofuels can be obtained from microalgae: methane from anaerobic digestion of the algal biomass (Spolaore et al., 2006), biodiesel derived from microalgal oil (Gavrilescu and Chisti, 2005), ethanol and photobiologically produced biohydrogen (Ghirardi et al., 2000).
IV-1 Biodiesel and Bioethanol
Biodiesel and bioethanol are the most common biofuels; they can, respectively, replace diesel and gasoline, in today’s cars with little or no modifications of vehicle engines (Mata et al., 2010). Bioethanol is an alcohol produced by fermentation of sugar from corn, wheat and sugar cane. Sugar cane is the most productive source of bioethanol (Chisti, 2008). Biodiesel is a mixture of fatty acid alkyl esters obtained by transesterification of vegetable oils or animal fats. These lipids are composed of triglycerides (90-98%), mono and diglycerides in small amounts, free
8 fatty acids (1-5%) and residual amounts of phospholipids, phosphatides, carotenes, tocopherols, sulfur compounds, and traces of water (Bozbas, 2008).
There are many advantages of using microalgae to produce biodiesel (Li et al, 2008): 1) the high growth rate of microalgae can satisfy the high demand of biofuels, while using limited land resources; 2) the cultivation of microalgae consumes less water than the cultivation of land crops; 3) when microalgae are used for biofuel production, there is a reduction in the emissions of nitrous oxide released; 4) microalgal farming could be potentially more cost effective than conventional farming. However, microalgae also present disadvantages for biofuel production, because of the low concentration of organic matter in their culture, induced by the limited access of light. This factor associated to the small size of cells makes the harvest of algae expensive. Microalgae have high levels of humidity, about 99 or 99.5 % (0.5- 1 g solid /l) (Minowa and Sanayama, 1999) compared to macroalgae: 87% (Chynoweth, 2002). Their high moisture content of harvested biomass would imply that the drying process would consume energy and would be more expensive (Li et al., 2008).
IV-2 Methane
Methane is the main constituent of biogas. It comes from the fermentation of organic matter from plant or animal origin in the absence of oxygen. Biogas is composed of 60-70% methane. Methane is a biofuel that can be substituted to natural gas (mainly composed of more than 95% methane). It is produced by methanogenic archaea that live in anaerobic environments. Methane is released naturally from low oxygen wetlands such as marshes. This gas can be used to replace gasoline in combustion engines. It can also be used in diesel engines (Kangmin and Ho, 2006).
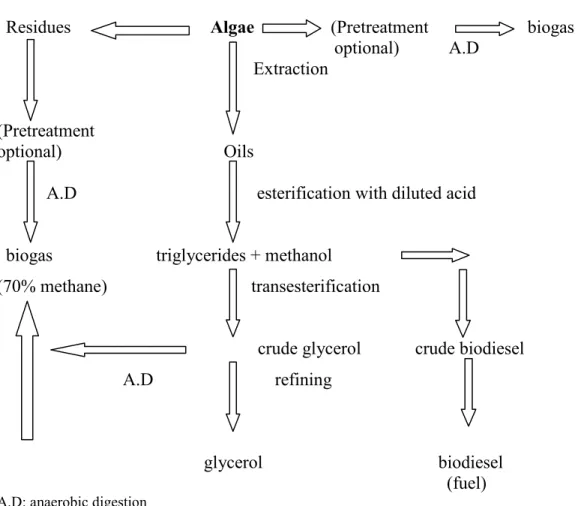
IV-3 Techniques for Obtaining Biodiesel and Methane from Algae
One of the possibilities of obtaining algal fuel is by the direct extraction of lipids and their processing as a diesel-fuel substitute (biodiesel). Oils are obtained from algae by cold pressing, crushing or/and chemical treatment (e.g. solvent extraction) (Danielo, 2005). Biodiesel is produced by transesterification of oils with short-chain alcohols. The transesterification reaction consists of transforming triglycerides into fatty acid alkyl esters, in the presence of an alcohol, such as methanol or ethanol, and a catalyst, such as an alkali or acid, with glycerol as a byproduct (Mata et al., 2010).
9
Figure 1: Techniques for Obtaining Biodiesel and Methane from Algae (adapted from Danielo, 2005).
Residues Algae (Pretreatment biogas optional) A.D Extraction (Pretreatment optional) Oils
A.D esterification with diluted acid
biogas triglycerides + methanol
(70% methane) transesterification
crude glycerol crude biodiesel A.D refining
glycerol biodiesel (fuel) A.D: anaerobic digestion
Most of the algal lipids require pretreatment and purification steps for a better performance. On the other side, methane can be obtained by anaerobic digestion of the glycerol and other residues or from the entire alga.
V. Anaerobic Digestion
Anaerobic digestion is a biological process of the conversion of organic matter into biogas consisting primarily of methane and carbon dioxide by an anaerobic microbial consortium (Moletta, 2008). It is a process widely used for wastewater biotreatment, for biosolids stabilization, and for conversion of organic waste and residues into energy. It is a natural transformation which occurs in all environments where there is organic matter in the absence of oxygen (marsh, lake bottoms, intestines of animals and engineered landfill). Several types of organic materials can be stabilized and simultaneously converted into methane, which is used as
10 a fuel. Because of its ability to produce methane, anaerobic digestion has become an effective process for the production of renewable energy.
V-1 Microbiology of the Anaerobic Digestion
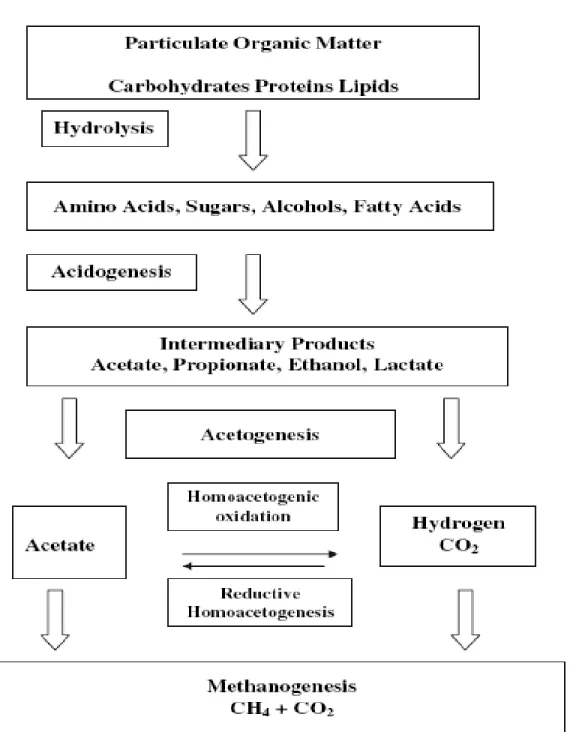
During anaerobic digestion complex molecules are degraded into methane and CO2 through
enzymatic reactions This mineralization occurs in four main steps: hydrolysis, acidogenesis, acetogenesis and methanogenesis (Moletta, 2008). The anaerobic microbial communities can be classified into two domains, Bacteria and Archaea (Demirel and Scherer, 2008).Three groups of micro-organisms are responsible for the methanisation: hydrolytic fermentative (acidogenic), acetogenic bacteria, and methanogenic archaea.
V-1-1. Hydrolysis and Acidogenesis
Hydrolysis is the first step of the anaerobic digestion. At this stage, complex molecules such as polysaccharides, lipids, proteins are degraded into monomers (monosaccharides, fatty acids, and amino acids).
There are many species of bacteria responsible for this step and they can be strict or facultative anaerobic: Clostridium, Bacillus, Anaerovibrio, Acetomicrobium, and Staphylococcus. The microorganisms have rapid growth rates with doubling time of several hours; however, the stage of hydrolysis is the limiting step in the case of hardly hydrolysable compounds (Moletta, 2008). At the stage of acidogenesis, the molecules from the previous step are degraded into volatile fatty acids (VFA) (acetic, propionic, butyric acids), alcohol (ethanol), organic acids (lactic acid) hydrogen and carbon dioxide. This step is faster than the other steps and 30-40 times faster than hydrolysis. The bacteria involved in this step may be strict or facultative anaerobes with short doubling times. The most encountered ones are strictly anaerobic bacteria of the genus
Clostridium. There are also the genus Bacteroides, Bacillus, Pelobacter, Acetobacterium and Ulyobacter and the family of Enterobacteriaceae (Moletta, 2008).
V-1-2. Acetogenesis
During the acetogenesis, the different compounds (acids, alcohols) obtained during the hydrolysis and acidogenesis are converted to acetate, hydrogen and carbon dioxide which are direct precursors of methane (Moletta, 2008). Two main pathways may be used: the heterofermentative pathway that produces carbon dioxide and hydrogen from VFA such as butyrate and propionate, and the homoacetogenic pathway which only produces acetate from organic molecules (Tholen and Brune, 1999).
11
Figure 2: Anaerobic Conversion of Biomass to Methane (extracted from Demirel and Scherer, 2008)
Three groups of bacteria are responsible for the transformation of organic molecules to acetate, hydrogen and carbon dioxide: the obligate hydrogen producing acetogens (which are syntrophic bacteria), the homo-acetogenic bacteria and the sulfate-reducing bacteria that may have one or both functions. The syntrophic acetogenic bacteria are of the genus Syntrophobacter,
Syntrophomonas, Syntrophus (Moletta, 2008).
The accumulation of hydrogen indicates a dysfunction and leads inevitably to the inhibition of acetogenesis. This implies the need of a constant elimination of the hydrogen produced.
12 This elimination can be achieved through the hydrogenetrophic archea, which will consume the hydrogen produced to reduce the carbon dioxide into methane, and the sulfate-reducing bacteria which will consume the hydrogen to reduce the sulfates into sulfides (Hanaki, 1981).
V-1-3. Methanogenesis
Methanogenesis is the transformation of acetate, hydrogen and carbon dioxide in methane. It is also possible to have traces of hydrogen and nitrogen as a result of methanogenesis. The methane can be obtained by two pathways: from carbon dioxide and hydrogen and from acetate and hydrogen (Moletta, 2008). The methanogens are strict anaerobic archaea and are represented by two categories: 1) Hydrogenophilic methanogens: they produce methane from carbon dioxide and hydrogen. They are represented by the genres Methanobacterium,
Methanobrevibacter, Methanospirillum, Methanocorspusculum (Moletta, 2008; Demirel et al.,
2008); 2) Acetoclastic (or acetotrophic) methanogens produce methane from acetate. The most encountered genus are Methanosarcina and Methanosaeta (or Methanothrix) (Morgan et al. 1991; Moletta, 2008). The theory gives a value of production of methane of up to 350 l per kilogram of chemical oxygen demand (COD) eliminated (under normal temperature and pressure).
V-1-4. Other Reactions
The sulfate-reduction is the transformation of volatile fatty acids and ethanol using sulfate as an energy source (Moletta, 2008). The reactions associated with nitrogen are the denitrification and the anaerobic ammonium oxidation (Moletta, 2008).
V-2. Physical and Chemical Parameters Influencing the Anaerobic Digestion
V-2-1. Temperature
One important factor in the anaerobic digestion is the temperature. Compared with thermophilic temperature (50-70°C), mesophilic temperature (25-45°C) appeared to be an optimal condition for a maximal methane yield (Cecchi et al., 1996).
V-2-2. pH
pH is the most important factor impacting methane proportion in biogas. The CO2 dissolved in
water (CO2 [l]) is in equilibrium with the CO2 content in the gas phase (headspace of the reactor
13 On the other side, the dissolved CO2 is in chemical equilibrium with its carbonated forms: CO2
[l] + H2O TM H2CO3 TM HCO3- +H+ TM CO3= +2H+. Therefore the concentration of CO2 [l]
depends on the pH. In alkaline water, the reaction is displaced to the right which in fine increases the fraction of CO2 which dissolves in water, resulting in a lower content of CO2 [g]
and a higher percentage of methane.
The overloading of the digester results in the accumulation of acids including acetic acid and a diminution of the pH. The decrease of the pH causes the dissociation of acetic acid – acetate to acetic acid, characterized by the following reaction: CH3-COOH or HAc ↔ CH3-COO- or Ac-.
It is the undissociated form of acetic acid HAc that inhibits methanogenesis. It is also under this form that the substrate migrates within the cell by diffusion through the cell membrane. The increase in the HAc extra cellular concentration from the accumulation of acids and the decrease of the pH increase their transmembrane diffusion rate and their intracellular concentration. To maintain the neutral pH of the medium, the HAc is then dissociated in acetate and protons (HAc→ Ac- + H+). The cell has to continually evacuate its additional protons in order to maintain its intracellular pH. This results in a significant and continuous expenditure of energy at the expense of the cell that is no longer viable. A similar process occurs in the inhibition of methanogenesis by ammoniac, NH3. At alkaline pH, the dissociation NH4+ ↔ NH3+ + H+ is
shifted towards NH3 with an increase of its intracellular concentration. To maintain the neutral
pH of the intracellular medium, the NH3 will react with the intracellular protons to form NH4+.
The cell will have to take the H+ from the extracellular medium to restore its internal pH and reject cations as potassium K+ to compensate for the increased intracellular proton. This leads to an intracellular K+ deficiency that is fatal to the cell.
A pH between 6.6 and 7.5 is optimum for an increased methane production (Hu and Yu, 2006; Hu et al., 2006; Zheng-Bo et al., 2007; Ihrig et al., 2008; Vergara-Fernandez et al., 2008). On the other hand, at a pH inferior at 6, methane production is negatively affected (Vergara-Fernandez et al., 2008; Hu et al., 2006; Hu and Yu, 2006). The pH is essentially related to the presence of volatile fatty acids.
V-2-3. The Hydraulic Retention Time (HRT)
The HRT is a key parameter in anaerobic process. In a completely stirred tank reactor (CSTR), the HRT must be greater than the generation time of microorganisms, to avoid the microorganisms to be washed out of the reactor. This is particularly critical for the retention of methanogens, which are the slowest growing microorganisms in the anaerobic consortium.
14 When the process is operated at a HRT of up to 33 days, the methane is constant and maximal (Cecchi 1996; Minowa and Sanayama, 1999; Sialve et al., 2009).
V-2-4. Nutrients
In addition to the organic matter which serves as a source of carbon and energy to micro-organisms, there are nutritional requirements for macronutrients (nitrogen and phosphorus mainly) (Moletta, 2008). Iron, nickel, magnesium, calcium, sodium, cobalt are essential oligo elements that are also necessary for good enzymatic activity. Their deficiency may affect a proper functioning of the trophic chain (Rajeshwari et al., 2000).
V-2-5. Agitation
The stirring system should be efficient enough to maintain a uniform temperature and to liberate the biogas formed. An efficient stirring of the substrates will also result in a better contact between the microorganisms and the substrates.
V-2-6. The Presence of Toxic Compounds and Inhibitors
The presence of ammonia, volatile fatty acids, long chain fatty acids, and hydrogen can inhibit the anaerobic digestion, particularly the methanogenesis (Moletta, 2008). In this section, only the inhibition due to volatile fatty acids and long chain fatty acids will be discussed.
V-3. Biomethanisation of Lipids
Wastes or wastewaters with a high fat content are an attractive source for the production of methane, although lipids are a group of organic compounds with a difficult degradation in biogas. Among the organic substrate, lipids are the most productive of methane (0.99 LSTP
CH4/g substrate) when compared to other compounds: carbohydrates (0.42 LSTP CH4/g substrate)
and protein (0.63 LSTP CH4/g substrate) (Alves et al., 2009). Theoretically, under normal
pressure and temperature, 1 g of oleate (unsaturated long chain fatty acid) gives 1.01 l of methane while 1 g of glucose produces 0.37 l of methane (Kim et al., 2004). Because of their high content of lipids, algae are an important source for the production of methane. During the anaerobic digestion, lipids are rapidly hydrolyzed to glycerol and long chain fatty acids by extracellular lipases. The glycerol is degraded by acidogenesis, while long chain fatty acids are degraded to acetate, hydrogen and carbon dioxide through β oxidation process. Acetate and hydrogen are finally converted into biogas (Angelidaki and Ahring, 1992, Palatsi et al., 2009).
15
V-4. Role of Volatile Fatty Acids (VFA) in the Anaerobic Digestion of Lipids
The VFA (pyruvate, butyrate, and propionate) are the most important intermediate of the anaerobic digestion. During acetogenesis, these products are converted to acetate and hydrogen, which subsequently give methane. Their accumulation in the digester leads to an increase of hydrogen and a decrease in pH. These metabolites can inhibit methanogenic Archea and acetogenic bacteria and halt the degradation process (Moletta, 2008). The presence of species such as methanogenic Archea and sulfate reducing bacteria which keeps the hydrogen partial pressure at a low level is then necessary for a good anaerobic digestion (Hanaki, 1981).
V-5. Role and Inhibition potential of Long Chain Fatty Acids (LCFA) in the Anaerobic Digestion of Lipids
Usually, the anaerobic digestion of fats and oils to glycerol and LCFA proceeds rapidly, resulting in the accumulation of LCFA in the wastewater (Angelidaki and Ahring, 1992). At neutral pH, LCFA are ionized and it is appropriate to refer to them according to their carboxilate form; example, oleate and palmitate instead of oleic and palmitic acids (Alves et al., 2009). Studies have shown that LCFA have an inhibitory or limited effect on anaerobic digestion (Neves et al., 2009; Angelidaki and Ahring, 1992; Palatsi et al., 2009; Hwu et al., 1998). Several factors are the cause of this limitation: 1) Lipids are complex molecules and their hydrolysis is the limiting step in the anaerobic digestion; 2) absorption of thin lipid layers around biomass particles causes biomass flotation and washout: when the reactors are overloaded, a severe washout caused by flotation occurs; 3) lipid containing wastes often have low content nutrients and low alkalinity; 4) the carbon chain length and saturation. The anaerobic digestion of the LCFA is accomplished by syntrophic communities of anaerobic bacteria and methanogenic archaea (Alves et al., 2009). This degradation can be restrained because the LCFA have inhibitory effects on many bacteria involved in this process (Koster and Cramer, 1987). Both acetoclastic and methanogenic microorganisms are affected by LCFA; however methanogens are more affected by these compounds (Alves et al., 2001b). The inhibition of methanogenic archaea will result in an accumulation of organic acids which are intermediary metabolites, leading to a decrease of pH and so-called “sour digester” in which the methanogens cannot survive. At low concentrations, LCFA have been reported to be inhibitory for gram-positive microorganisms. Since methanogens have a cell wall similar to that of gram-positive microorganisms, they can be expected to be susceptible to inhibition by LCFA as well (Koster and Cramer, 1987). The effect
16 of neutral lipids on the anaerobic digestion depend on the degree of biomass adaptation, whereas the addition of free LCFA above a certain concentration may directly lead to a process failure because of the permanent toxic effect of these LCFA towards acetogenic bacteria and methanogenic archaea (Angelidaki and Ahring, 1992). Lalman and Bagley (2002) reported that unsaturated LCFA are more inhibitory than saturated LCFA. Hanaki (1981) showed that the toxicity of a mixture of LCFA is greater than the toxicity of an individual LCFA. Koster and Cramer (1987) confirm this in their study, where a concentration of lauric acid below its minimum inhibitory concentration (MIC) or toxicity threshold level (concentration level below which the maximum specific acetoclastic methanogenic activity was not affected by the presence of the LCFA) strongly increased the toxicity of capric acid and myristic acid. Many studies done on the toxic and inhibitory effect of LCFA showed that they inhibit anaerobic microorganisms at very low concentrations, at mesophilic temperatures (Palatsi et al., 2009). The anaerobic degradability and inhibitory effect of oleic acid (C18:1) was studied by Angelidaki and Ahring
(1992) and Salvador et al. (2007). They found that this compound had an initial inhibitory concentration of 0.1-0.2 g/l and 0.5 g/l, respectively, at 37°C. At lower temperature (30°C) Koster and Cramer (1987), as well as Salvador et al. (2007), found an initial inhibitory concentration of 2.4 mM (0.68 g/l). At 25°C, Galbraith et al., (1971) found that this concentration was 0.05 mM (0.014 g/l) and that oleate was the most inhibitory of ten fatty acids tested in pure culture. Linoleic (C 18:2 ) and linolenic (C 18:3) acids seem to be more toxic with
initial inhibitory concentration of 0.02 mM (0.0056 g/l) at 25°C (Galbraith et al. 1971). In their study, Lalman and Bagley (2000) showed that linoleic acid at 21°C and a concentration of 30 (0.03 g/l) inhibits acetoclastic methanogenesis and this inhibition is enhanced by the cosolvent diethyl ether, but hydrogenotrophic methanogenesis is only slightly inhibited by 30 (0.03 g/l) at 21°C.
As mentioned, saturated LCFA appeared to be less inhibitory than unsaturated LCFA. Stearic acid (C 18:0) has been found to be less toxic with an initial inhibitory concentration of 0.5g/l
compared to oleic acid (C 18:1) at 1-0.2 g/l (Angelidaki and Ahring, 1992). Galbraith et al. (1971)
showed a concentration of 0.4 mM (0.11 g/l) for inhibition by stearic acid (C 18:0) compared to a
concentration of 0.05 mM (0.01 g/l) for oleic acid (C 18:1). Koster and Cramer (1987) studied the
effects of four saturated long-chain fatty acids: caprylic (C 8:0) capric (C 10:0), lauric (C 12:0),
myristic (C 14:0) at 30°C. They found that the MIC was 6.75 mM (0.97 g/l), 2.6 mM (0.45 g/l),
17 (1971) found inferior values with 2 mM (0.29 g/l) for caprylic acid (C 8:0), 1 mM (0.17g/l) for
capric (C 10:0), 0.15 mM (0.03 g/l) for lauric (C 12:0), 0.15 mM (0.03 g/l) for myristic (C 14:0 ), 0.3
mM (0.08 g/l) for palmitic acid (C 16:0). From these experiments, it can be concluded that the
susceptibility of the acetoclastic methanogens varies with the type of microorganisms, that lauric acid is the stronger inhibitor of saturated fatty acids and that the inhibition is more correlated to the concentration, although adhesion of LCFA around the bacterial cell wall has been suggested as the mechanism of inhibition, preventing the passage of nutrients through the membrane (Alves et al., 2001 a, b; Hwu et al., 1998). Previous work suggested that LCFA exerts a permanent toxic effect on anaerobic digestion (Angelidaki and Ahring, 1992). However, inhibition caused by LCFA is a reversible process (Palatsi et al., 2009; Alves et al., 2009; Galbraith et al., 1971; Salvador et al., 2007). The acetogenesis and methanogenesis have not been irreversibly damaged since the rate of methane production increased rapidly soon after the LCFA-biomass associated degradation had recommenced (Pereira et al., 2005; Pereira et al., 2003). Several methods can be used to overcome the inhibition of the LCFA. Continuous or pulse exposure in the reactors results in a faster recovery system, improvement of the methane yield and consumption rates of acetate, suggesting an increase tolerance of LCFA (Alves et al., 2001a; Cavaleiro et al., 2008; Hwu et al.,1997). Discontinuous feeding of the system can also promote the development of the anaerobic bacteria communities, able to efficiently convert lipid-rich effluents (Cavaleiro et al., 2008). Other methods such as co-digestion (Fernandez et al., 2005), the addition of absorbents (Angelidaki et al., 1990) or the addition of easily-degradable co-substrates such as glucose and cysteine (Kuang et al., 2006) have been used to overcome LCFA inhibition. Compounds like calcium ions precipitate the LCFA and reduced their inhibitory effect. Cholesterol and ergocalciferol reversed the inhibition of lauric and linoleic acid, but magnesium reversed the inhibition of lauric acid only (Galbraith et al., 1971). The inhibition of LCFA is reversible between 1000 and 5000 mg LCFA/g VSS (Alves et al., 2009).
VI. Biomethanization of Algae and Aquatic Plants
The co-digestion of two or more algae or aquatic plants in anaerobic digestion has been shown to give higher results in term of methane production (0.09-0.30 l/g VS) than the digestion of one single species (0.07-0.22 l/gVS) (Cecchi et al., 1996; Rigoni-Stern et al., 1990; Alvarez et al., 2008; Kerner and Hanssen,1991;Yang et al., 2009). The action of drying the biomass after
18 harvest tend to decrease (by 16% or more) the methane yield: 0.31 l/g VS for fresh plants vs 0.11-0.26 l/g VS for the dry biomass (Asinari Di San Marzano, 1982; Briand and Morand, 1997). Simple mechanical pretreatment also influence the yield of the methane. Briand and Morand (1997) showed that washing the plant decreases the potential of methane from 0.110 to 0.094 l/g VS, whereas grinding increases (by over 20%) the values from 0.145 to 0.177 l/g VS. One important factor in anaerobic digestion is the temperature. Thermophilic temperature can enhance the methane production rate (Sialve et al., 2009); while mesophilic temperature appear to be optimal conditions for maximal methane productivity (Cecchi et al., 1996; Chen, 1987). This is supported by our study literature where the mesophilic temperature is more widely used. The hydraulic retention time (HRT) and the organic loading rate (OLR) are key parameters in the anaerobic process. When the process is operated at high HRT (up to 33 days) and/or low OLR (0.91-4.1 gVS /l/d), the methane is constant and maximal between 0.22-0.32 /g/VS added (Cecchi, 1996; Hu et al., 2006; Siave et al., 2009), but Briand and Morand (1997) and Zheng-Bo et al. (2007) showed that a higher OLR concentration (5.3-7.5 gVS/l/d) allowed the
microorganisms to grow rapidly and produced a higher efficiency than a lower OLR. However, the pH is the most important factor impacting CH4 proportion in the biogas. If the pH is high,
due to high alkalinity from NH3 release, then the gas content will shift more to CH4. A pH
superior to 6 (6.6-7.5) is optimum for increased methane production: 0.11-0.35 l/gVS (Hu and Yu, 2006; Hu et al., 2006; Zheng-Bo et al., 2007; Ihrig et al., 2008; Vergara-Fernandez et al., 2008; Nagamani and Ramasamy, 1999), on the contrary, at a pH inferior to 6, methane
production is negatively affected (Vergara-Fernandez et al., 2008, Hu and Yu, 2006, Hu et al., 2006). In the literature consulted, the reactor does not seem to influence the methane production, but we noted that the highest values of methane: (0.42-0.45 l/gVS added) were obtained with a batch system at 35°C, with an HRT of 28 days (Chen, 1987; Sialve et al., 2009). In our review, we identified one marine algae, Dunaliella, as having the potential for outstanding methane productivity up to 450 LCH4/kg solid added (0.45 Lgˉ¹VS added) (Sialve et al., 2009).
19
Table IV: Methane Yield of Different Algae and Aquatic Plants
Substrate Fermenter (l:liter) T(°C) and pH HRT (days) OLR (gVlˉ¹dˉ¹) Specific CH4 production
(liter CH4/gˉ¹VS added )
VS reduction
(%) References
Spirulina maxima (Freshwater
microalgae) Semi-Continuous: 10 l 35 33 0.97 0.26 65.8 Samson and Leduy, 1982
Spirulina maxima Batch 2 l 15-52 5-40 20-100 0.25-034 n.a Samson and Leduy, 1986
Spirulina Batch 11 l 35 28 0.91 0.32-0.31 n.a Chen, 1987
Chlorella vulgaris (freshwater
microalgae) Batch 5 l 28-31 64 - 0.31-0.35 n.a
Sanchez and Travieso, 1993
Chlorella-Scenedesmus Batch 11 l 35-50 3-30 1.44-2.8 0.17-0.32 n.a Golueke et al., 1957
Chorella-Scenedesmus
Co digestion
Chlorella-Scenedesmus (50%) and waste
paper (50%) CSTR 4 l CSTR 4 l 35 35 10 10 2- 4 and 6 4 0.18- 0.58 and 0.82 1.17 n.a
Yen and Brune, 2007
Co-digestion of Sewage sludge (SS)
and Macroalgae A (marine algae:Ulva rigida and
Gacilaria confervoides)
Pilot plant 1m³ discontinuously fed twice a day
Period 1: 37.1 Period 2: 37.1 Period 3: 37.1 Period 4: 37.1 Period 5: 55.2 Period 6: 55 Period 1: 14.5 Period 2 :14.7 Period 3 :11.2 Period 4 :11.7 Period 5: 11.2 Period 6 :12.3 Period 1 (SS): 1.7 Period 2 (SS+A) :2.6 Period 3 (+SS) :4.4 Period 4 (+A ) :4.2 Period 5: 5.3 Period 6 (fed without algae):5.5 Period 1: 0.14 Period 2: 0.22 Period 3: 0.17 Period 4: 0.16 Period 5: 0.01 Period 6: 0.12 A: 32 SS:49 Cecchi et al., 1996
20
Table IV: Methane Yield of Different Algae and Aquatic Plants (Continued)
Substrate Fermenter T°C and pH HRT (days) OLR (gVSlˉ¹dˉ¹) Specific CH4 production
(litre CH4/gˉ¹VS added ) VS% References
Tetraselmis fresh (marine microalgae) Tretraselmis (dry) CSTR 2-5 l CSTR 2-5 l 35 35 14 14 2 2 0.31 0.26
n.a Asinari Di San Marzano et al., 1982
Waste Sludge from Laminaria
hyperborea , Foslie and Ascophylium nodosum (marine
algae) Semi-continuous 8l Batch 8 l 35 and 7 35 and 7 23 and 16 30 6.5 l 6.5 l 0.07-0.28 0.10-0.15 40-50 20-40 Kerner and Hanssen., 1991 Ulva thalli
(marine algae) Stirred digester 30 l 35 and 7.3-7.5
algae : 15-20 Algae+manure: 15 Manure:15 algae: 1.7-1.8 Algae+manure: 5.3 Manure: 3.5 algae: 0.31-0.37 Algae+ manure: 0.93 Manure: 0.63 Ground: 50-58.6 Algae+manure : 38.8 Manure: 33.7
Briand and Morand, 1997
Ulva thalli Batch 30 l 35
Non washed: 23 Washed: 44 Non-ground: 42 Ground: 4 Non washed: 0.95 Washed: 0.66 Non-ground: 1.97 Ground: 2.36 Non Washed: 0.110 Washed: 0.094 Non ground: 0.145 Ground: 0.177
50 Briand and Morand, 1997
Dunaliella (marine microalgae) Batch 11 l 35 28 0.91 0.44-0.45 n.a Siave et al., 2009
21
Table IV: Methane Yield of Different Algae and Aquatic Plants (Continued)
Mixture of Ulva rigida (80-90%) and Gracilaria
confervoides (20-10%) (marine
algae)
Pilot Plant of 180 35±1 20 1 0.21 54-60 Rigoni-Stern et al., 1990
Mixture of Quinoa stalk (Chenopodium quinoa Wild),
totora (Schoenoplectus t0tora)
and 0-macrophytes (aquatic flora): (freshwater algae)
Semi continuous
10 l 25 30 1.8
-Unmixed feedstock (llama, cow, sheep manures, quinoa, omacrophytes):0.07-0.14
-co-digestion (mixtures of two cosubstrates): 0.09-0.2
14-43 Alvarez and Liden, 2008
Dried Spartina alterniflora
(SA) and fresh potato (P) Batch 2.5 l 35±1 1.5
- mono digestion (SA): 0.21
-Co digestion: 0.24 and 0.3 at SA:P of 4:1 and 6:1 respectively
6 Yang et al.,2009
Macrocystis pyrifera (dried and
crushed): A
Durvillea Antarctica (Dried
crushed): B
Macrocystis + Durvillea A+B (
marine algae) ASBR 2.5 l and UAF 4 l (two-phase anaerobic phase digestion system) T0 37 pH in ASBR: 5.5-5.7 pH in AUF: 6.8-7.2 31 3 A: 0.11 (±52.3) B: 0.11 (±80.2) A+B: 0.10 (±54.9)
n.a Vergara-Fernándezet al., 2008
VII. Study Objectives
VII-1. Principal Objective
The objective of this study is to evaluate the Biochemical methane Potential (BMP) of microalgae and identify the limit of the biodegradation of lipids in the anaerobic digestion.
VII-2. Specific Objectives
As specific objectives, we will:
1) Compare macroalgae to microalgae in term of their energy potential in methane;
2) Screen different species of freshwater and marine microalgae to compare their methane potential;
3) Determine the impact that a mild pretreatment of identified microalgae may have on their methane production;
4) Identify the limits of biodegradation of algal lipids in the anaerobic digestion by studying limiting kinetics steps of lipids and individual LCFA;
4.1) Hydrolysis test on oils: The purpose of this test is to verify that the oils are able to be hydrolyzed to fatty acids and thus confirm that hydrolysis is not the limiting step of the anaerobic digestion, in the setting of a BMP test performed on algae that contain those LCFA ;
4.2) Activity test on LCFA: This test is to verify the activity or performance of our biomass (inoculum) on our substrate;
Chapter Two: Methodology
I.
Physico-Chemical Analysis
These methods include the measurement of the pH, chemical oxygen demand, solids, volatile fatty acids, anions, cations. Analysis were performed on the substrate before the beginning of the experiment for the characterization of the samples (initial values), the day of the experiment (t = 0 or to analysis) and at the end of the experiment (final analysis). The to analysis gave the
values of each component in the bottles at the beginning of the experiment.
I-1 pH
The pH is an important parameter used in water chemistry. In the anaerobic digestion, it needs to be evaluated because the microbial consortium requires a pH stable between 7 and 8. In the BMP bottles, this was done by the buffer solution. The measurement of the pH was done manually, using an Accumet AP61 portable pH meter equipped with a micro probe (Fisher, Fairlawn, USA)
I-2 Chemical Oxygen Demand (COD)
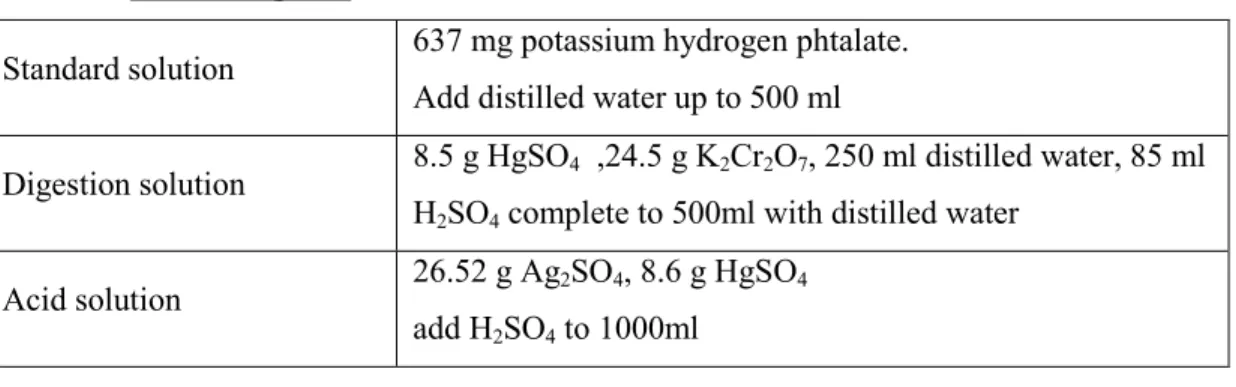
The chemical oxygen demand is the measure of the amount of oxygen required to oxidize the organic matter contained in a sample. It measures the reducing power of the substrate. Organic material contained in a sample is oxidized in a closed test tube by heating in a strongly acidic medium (H2SO4) with a known amount of potassium dichromate (K2Cr2O7). There are two types
of COD: soluble chemical oxygen demand (sCOD) and total chemical oxygen demand (tCOD). The sCOD was performed on the centrifuged sample. The sample was centrifuged at 10 000 RPM in the JA-20 rotor (Thermo Fisher Scientific, Asheville, NC, USA) for 10 minutes at 4°C. A known amount of sample was put in a Hach tube and distilled water was added to reach a total volume of 2 ml. Then 0.5 ml of digestion solution and 2.5 ml of acid solution were added with the automatic distributor. The tubes were then heated for 2 hours, at 150°C, in a Hach reactor. The absorbances of the tubes were read at 620 nm, using a Hach DRB 200 spectrophotometer (Hach Company, Loveland, USA). The concentrations were then calculated using a COD standard curve. Unlike the sCOD, tCOD was performed on the whole sample whether previously diluted or not. The same protocol was applied to the tCOD, except that the tubes
24 were heated for 4 hours, at 150°C, in a Hach reactor and the absorbances of the tubes were read at 620 nM, using a Hach DRB 200 spectrophotometer (Hach Company, Loveland, USA).
Table V: COD Reagents
Standard solution 637 mg potassium hydrogen phtalate. Add distilled water up to 500 ml
Digestion solution 8.5 g HgSO4 ,24.5 g K2Cr2O7, 250 ml distilled water, 85 ml H2SO4 complete to 500ml with distilled water
Acid solution 26.52 g Ag2SO4, 8.6 g HgSO4 add H2SO4 to 1000ml
I-3. Solids
Solids refer to matter suspended or dissolved in water or wastewater. In a sample, based on particle size and characterization, solids were categorized into the following groups: Total Suspended Solids (TSS or SS), Total Dissolved Solids (TDS), Fixed Solids, and Total Solids (TS). Total solids were the total of all solids in a water sample. They included the total suspended solids and total dissolved solids. The total suspended solids were the amount of total solids retained by a filter and then dried at 105°C and the total dissolved solids were the portion that passes through the filter. The fixed solids were the residue of total, suspended or dissolved solids after ignition, and the solids lost on ignition (heating to 600°C) were the volatile solids. Volatile suspended solids (VSS) were the solids obtained by incineration of the dried total suspended solids (SS) at 600°C. The value of the VSS corresponded to the amount of organic matter in the sample. Total volatile solids (TVS) were the solids obtained by incineration of the TS at 600°C after drying it at 105°C (Fisher Scientific, Isotemp muffle Furnace 550 series, Pittsburgh, PA).
TS or SS (g/kg) = dry weight (crucible+sample) – crucible weight x 1000 Sample wet weight
TVS or VSS (g/kg) = dry weight – ash weight
25
1-4. Volatile Fatty Acids (VFA).
The analysis of VFA included the measurement of acetic, propionic and butyric acids. The sample was centrifuged and a dilution was made, when needed, in order to have a final maximum concentration of 1000 mg/l of each volatile fatty acid. A specific amount of internal standard was added. The quantity of VFA was measured by gas chromatograph (Agilent 6890, Wilmington, DE) equipped with a FID. 0.2 ml of sample diluted 1:1 (V/V) with internal standard in 6% formic acid was directly injected on a glass column of 1m x 2mm Carbopack C (60-80 mesh) coated with 0.3% Carbowax 20 M and 0.1% H3PO4. The column was held at
120°C for 4 minutes. Helium at 20 ml/min was used as the carrier gas. The injector and the detector were both maintained at 200°C. Quantification was made, with iso-butyric acid as an internal standard.
Table VI: Fatty Acid Gas Chromatography Vial Preparation
Dilution Internal Standard (μl) H20 (μl) Sample (μl)
none 350 - 350
1/2 350 175 175
1/5 350 280 70
1/10 350 315 35
I-5. Anions and Cations
The principal compounds studied are NH4, K, Na, CL, NO2, NO3, PO4 and SO4. The samples
were first centrifuged and the analyses were done on the supernatant. The total volume in the vial had to be 1 ml. For the determination of the anions (Cl-, NO2-, NO3-, HPO4-2, SO4-2), the samples were injected on a Hamilton PRP-X200 column of 250 mm x 41mm while for the determination of the cations (Na+, NH4+, K+) the samples were injected on a Hamilton PRP-X200 cation resin-based chromatography column (250 x 41mm O.D.). All the ions were measured on a High Performance Liquid Chromatograph (HPLC) from Thermo Separation Product AS3000- P4000 (Sunnyvale, CA, USA). Conductivity data were obtained by using a Waters Millipore detector model 432 (Milford, MA, USA).