Steel and Composite Constructions Unit
Institut de Mécanique et Génie Civil (B52), Chemin des chevreuils, 1 - 4000 Liège - Belgique
RECENT STUDIES CONDUCTED AT LIEGE
UNIVERSITY IN THE FIELD OF COMPOSITE
CONSTRUCTION
Jean‐François Demonceau & Jean‐Pierre Jaspart
1 Table of contents
1 Table of contents ... 1 2 Introduction ... 1 3 Behaviour of composite sway frames ... 3 3.1 Context ... 3 3.2 Objectives and research steps ... 4 3.3 Developed simplified analytical method ... 5 3.3.1 Introduction ... 5 3.3.2 Parametrical study on composite sway frames ... 8 3.4 Perspectives ... 12 4 Robustness of structures ... 13 4.1 Introduction ... 13 4.2 General concepts ... 13 4.3 Experimental test on a substructure ... 16
4.4 Development of an analytical tool to predict the response of a structure with account of the membrane effects ... 17 4.5 ROBUSTFIRE project ... 18 4.6 Perspectives ... 18 5 Behaviour of composite joints ... 19 5.1 Introduction ... 19 5.2 Behaviour of single‐sided composite joints subjected to “hogging” moments ... 19 5.3 Behaviour of joints subjected to “sagging” moments ... 21 5.3.1 Proposed analytical method ... 22 5.3.2 Validation of the proposed analytical method ... 24 5.4 Behaviour of joints subjected to combined bending moments and axial loads ... 25 5.5 Development of design dedicated software ... 27 5.5.1 General information and scope ... 27 5.5.2 User interface ... 28 5.5.3 Calculation modules ... 29 5.5.4 Output processor ... 29 5.5.5 Availibility ... 29 5.6 HSS‐SERF project ... 29
5.7 Perspectives ... 30 6 Verification of composite beams against lateral torsional buckling in the erection phase ([30] & [31]) ... 31 7 Behaviour of circular tubular composite columns with high strength steel ... 32 7.1 Introduction ... 32 7.2 ATTEL project ... 32 8 Education and continuing education ... 33 8.1 Education ... 33 8.2 Continuing education ... 33 8.2.1 Books published by Infosteel ... 33 8.2.2 Continuing education lectures ... 33 9 Summary ... 34 9.1 Recent developments ... 34 9.2 Perspectives ... 35 10 References ... 36
2 Introduction
The present informal document summarises recent or ongoing studies conducted at Liège University in the field of steel‐concrete composite constructions; they are summarised in a Table presented at the following page.
Only the main results are presented herein. For all the addressed topics, references to documents, reports and articles where details are available will be made; a copy of these documents can be obtained by contacting us.
At the end of each paragraph, a section dedicated to some perspectives is given. § 9.2 summarises the main topics in which investigations could be conducted in the future; these perspectives are also reported in the Table here after.
The activities related to the response of composite structures subjected to seismic or fire actions (mainly covered in Liège by Prof. Plumier and Prof. Franssen respectively) are not reported here as they are covered by other more “transversal” technical committees of ECCS (TC3 for the fire and TC13 for the seismic action).
The “composite joints” topic is included here even if a technical committee relative to the behaviour of joints exists within ECCS (TC10); indeed, in the past, all the developments relative to composite joints were discussed and accepted within TC11 and not within TC10. Of course, it is up to the present TC11 members to decide whether this topic has or not to be considered within TC11.
Finally, the robustness of composite structures and in particular, the robustness of the structures subjected to the exceptional event “loss of a column further” is also considered herein as this topic is not yet covered by any other technical committee. Again, it is up to the TC11 members to decide whether this topic has to be discussed within TC11.
Topics
Recent developments in Liège
Ongoing activities in Liège
Perspectives
Cross‐sections ‐ ‐ Classification of sections with account of the concrete properties (§ 3.4 & § 9.2) Structural elements Slabs ‐ ‐ ‐ Beams Stability of beams during the erection phase (§ 6) PhD thesis of Rodrigues (§ 6) Effect of partial interaction on the beam deformation at ELS (§ 9.2) Columns ‐ ATTEL project (§ 7) HSS‐SERF project (§ 5.6) ‐ Joints Study of the behaviour of joints subjected to M and to combined M‐N (§ 5) HSS‐SERF project (§ 5.6) Behaviour of joints subjected to combined M‐N‐V (§ 9.2) Prediction of the joint ductility (§ 5.6 & § 9.2) Structures Static Behaviour of composite sway frames (§ 3) ‐ Global analysis of composite frames (§ 9.2) Seismic TC 13 TC13 TC13 Fire TC3 TC3 TC3 Robustness Loss of a column in a composite building (§ 4) ROBUSTFIRE project (§ 4.5) Dynamic effects associated to a column loss (§ 9.2)
3 Behaviour of composite sway frames
3.1 Context
Most steel‐concrete composite structures are laterally restrained by efficient bracing systems, such as concrete cores. This practice does not favour the use of composite structures. Indeed, once concrete construction companies are involved into major parts of a building, the reason for using composite structures for subsequent parts is often questionable.
As an alternative, moment resisting frames, without bracing systems, offer a flexible solution to the user of the buildings, especially for the internal arrangements and the exploitation of the buildings. When sufficient stiffness and strength with regard to lateral forces are achieved, such frames offer a structural solution, which can resist lateral loads. In seismic regions, properly designed moment resisting frames are the best choice regarding the available ductility and the capacity to dissipate energy. This is stated in Eurocode 8 devoted to earthquake engineering in which high values of the behaviour factor are recommended.
Obviously, the construction of tall buildings and large industrial halls without wind bracing systems is susceptible to make global instability a relevant failure mode; this is not yet well covered by Eurocode 4 and other references which mainly deal with composite construction under static loading. Indeed, as far as the European codes are concerned, Eurocode 4 contains design procedures for non‐sway composite buildings and gives design rules for composite slabs, beams, columns and joints; composite sway frames are allowed in Eurocode 4 but no information on how to design them are given.
That is the reason why two European research projects on composite sway frames, in which Liège University was involved, have been conducted recently:
• the first one involving seven institutions and titled “Applicability of composite structures to sway frames” (Contract N° 7210‐PR‐250) was funded by the European Coal and Steel Community (ECSC) for three years (from July 2000 to June 2003);
• the second one was an Ecoleader project (from July 2000 to June 2003) titled “3‐D full scale seismic testing of a steel‐concrete composite building at ELSA” involving six institutions. The objective of these projects was to provide background information on the behaviour of such frames under static and seismic loads and to provide simplified design rules as a result of experimental, numerical and analytical investigations.
Concerning the experimental investigations, two main experimental tests were planned within these projects:
• a 3‐D composite building under dynamic loading tested in Ispra (Italy), called the “Ispra” structure;
• a 2‐D composite frame under static loading tested in Bochum (Germany), called the “Bochum” structure.
Beside these tests, cyclic and static tests on isolated joints were also performed in different European laboratories (involving the Argenco Laboratory of liege University) so as to get the actual behaviour
of the constitutive structural joints of these two structures; indeed, the behavioural responses of the joints are known to significantly influence the global behaviour of structures.
Concerning the analytical and numerical investigations performed at Liège University, they were divided in three parts: • validation and development of an analytical procedure to predict the response of composite joints subjected to hogging and sagging bending moments (this aspect will be addressed in § 5); • numerical analyses of existing structures further to the validation of the numerical tools used for the numerical investigations;
• development of design guidance with proposals of simple analytical methods to design composite sway structures.
The conducted investigations are detailed in the PhD thesis of Demonceau [1]. Within this paragraph, only the followed strategy will be briefly presented in § 3.2 and then, in § 3.3, an innovative simplified analytical method able to predict the ultimate load factor of steel and composite sway frames will be introduced.
3.2 Objectives and research steps
Composite sway structures are prone to global instability phenomena and to second‐order effects; the latter have to be predicted carefully because they may govern the design. These second‐order effects are amplified by an additional source of deformability with regards to steel sway structures: the concrete cracking. Indeed, this effect, which is specific to concrete and composite constructions, tends to increase the lateral deflection of the frame, amplifies consequently the second‐order effects and reduces the ultimate resistance of the frames. In other words, for a same number of hinges formed at a given load level in a steel frame and in a composite frame, larger sway displacements are reported in the composite one.
The objective of this work was to investigate the effects of these phenomena on the behaviour of composite sway frames, to highlight the particularities of their behaviour and to propose simplified analytical procedures for the design of such frames; these objectives have been achieved by means of numerical and analytical studies on 2‐D plane frames extracted from realistic or actual buildings. The research steps were the followings:
• The behavioural response of the joints is known to significantly influence the global behaviour of sway structures. Accordingly, investigations devoted to the study of the behaviour of composite joints were conducted through experimental and analytical investigations. This point is addressed in § 5.
• Then, the finite element software used for the prediction of the composite sway frame responses has been validated through a benchmark study and through comparison with experimental test results performed in two European laboratories.
• Numerical and analytical investigations performed with the so‐validated tool have been realized on frames extracted from actual buildings in order to clearly highlight the particular behaviour of composite sway frames.
• Afterwards, according to the results obtained through these investigations, a new design method for the design of steel and composite sway building frames has been developed and
validated through parametrical studies. The developed method is founded on the Ayrton‐ Perry formulation which is the method recommended in the Eurocodes to deal with the instability phenomena and permits to compute the ultimate load factor of a sway frame and the associated collapse mode. The followed strategy is illustrated in Figure 1. Figure 1. Followed strategy In the following paragraph, only the developed simplified analytical method will be introduced.
3.3 Developed simplified analytical method
3.3.1 IntroductionIn previous investigations [2], the applicability of the “Amplified sway moment method” and the “Merchant‐Rankine approach” (respectively based on elastic and plastic design philosophies) to composite sway structures was investigated. For the “amplified sway moment method”, it was demonstrated that: • A good accuracy of this method is obtained when applied to sway composite structures. Validation of an analytical model to predict the response of composite joints with comparison to experimental test results Validation of the numerical tool through a benchmark study and comparisons to experimental test results Study of the behaviour of actual composite sway frames Development of an innovative simplified analytical method to predict the ultimate load factor of steel and composite sway frames Investigation of the applicability of simplified analytical methods initially developed for steel sway frames to composite sway frames State‐of‐the‐art knowledge on composite sway building frames
• The simplified method proposed in Eurocode 3 for the computation of λcr permits to obtain
an accurate prediction of the latter which, consequently, do not significantly affect the accuracy of the amplified sway moment method.
For the “Merchant‐Rankine approach”, it was shown that:
• The conclusions concerning the accuracy of this method which were drawn for steel sway structures still appropriate for composite sway structures:
o safe for beam plastic mechanisms; o adequate for combined plastic mechanisms; o unsafe for panel plastic mechanisms.
• The nature of the plastic mechanism considered in the Merchant‐Rankine does not always correspond to the one occurring at failure of the frame (computed through a non‐linear analysis); this phenomenon is due to the second‐order effects which differently influence the yielding of the structure according to the nature of the considered plastic mechanism [2]. According the lack of accuracy and sometimes the unsafe character of the “Merchant‐Rankine approach”, a new simplified analytical method able to predict the ultimate load factor of a steel or composite sway frame was developed and validated.
The solution proposed here is to develop a procedure based on three formulas, one for each type of plastic mechanisms which could appear in the studied frame (i.e. beam, panel and combined plastic mechanisms):
• Formula1(λp,beam, λcr) Æ λu,beam; • Formula2(λp,panel, λcr) Æ λu,panel; • Formula3(λp,combined, λcr) Æ λu,combined.
Through these formulas, three predicted ultimate load factors are computed; the smallest one is then considered as the ultimate load factor of the studied frame: λu = min (λu,beam, λu,panel, λu,combined).
These new formulas could have been developed from the Merchant‐Rankine one; in fact, the actual Merchant‐Rankine formula could be used as “Formula3” as it was demonstrated in [2] and in previous studies on steel sway frames that this formula gives satisfactory results for frames with the first‐order rigid‐plastic mechanism associated to a combined one. Nevertheless, it is chosen to develop these formulas from the Ayrton‐Perry formulation (see Table 1), which is already used in the Eurocodes to treat the member instability phenomena (plane buckling, lateral buckling and lateral torsional buckling); this proposal is in agreement with the recommendation of the last draft of Eurocode 3 where it is stated that such formulation should be used to verify “the resistance to lateral
and lateral torsional buckling for structural components such as single members (built‐up or not, uniform or not, with complex support conditions or not) or plane frames or subframes composed of such members which are subject to compression and/or mono‐axial bending in the plane...” (§ 6.3.4
(1) of Eurocode 3). A great advantage is that the Ayrton‐Perry formulation implicitly permits to respect the limit conditions which are:
• when λcr is very high, no instability phenomena will appear and the failure occur through the
• when λp is very high, no yielding appears in the frame and the failure occurs through an
instability phenomenon (λu Æ λcr).
Table 1. From the Ayrton‐Perry formulation (for column buckling) to the formulas to be included in the new simplified analytical design method
Ayrton-Perry formulation – Eurocode 3 Erreur ! Source du renvoi introuvable.
Formulas included in the new simplified design method for sway frames , , 1 ult op b Rd M N χα γ = u p λ =χλ 2 2 1 op χ φ φ λ = + − 2 2 1 op χ φ φ λ = + − , , ult k op cr op α λ α = p op cr λ λ λ = 2 0 0, 5 1 ( op ) op φ= ⎡⎢⎣ +α λ −λ +λ ⎤⎥⎦ 2 0 0, 5 1 ( op ) op φ= ⎡⎢⎣ +μ λ −λ +λ ⎤⎥⎦
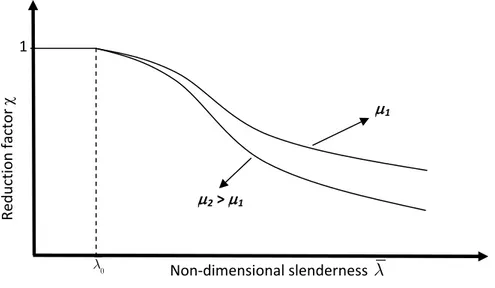
Within this formulation, χ is called the reduction factor and λ the non‐dimensional relative op slenderness. The parameter λ represents the length of the plateau in a 0 λ ‐ 0p χ graph when χ equal to 1 (see Figure 2), i.e. the length on which the ultimate resistance is assumed to be equal to the plastic resistance and, accordingly, where the influence of the second‐order effects is neglected; as no strain hardening and cladding effects were considered within the performed studies, the plateau length is taken equal to 0 as in the Merchant‐Rankine approach.
So, to develop this new method, only the parameter μ has to be determined. The parameter μ is used to implicitly take into account of the second order effects within the developed procedure. In fact this parameter influences the shape of the curve presented in Figure 2; the highest μ is, the smallest the reduction factor χ is and, accordingly, the smallest the predicted λu is.
Three values of the parameter μ have to be calibrated, one for each plastic mechanism (i.e. μbeam for
the beam plastic mechanism, μcombined for the combined plastic mechanism and μpanel for the panel
plastic mechanism), as each type of plastic mechanisms are influence differently by the second order effects. These values have been calibrated through parametrical studies. At the end of this calibration, it is intended to obtain a higher value of μ for the panel plastic mechanism than the one for the combined plastic mechanism and the latter higher than the one for the beam plastic mechanism (Æμpanel > μcombined > μbeam). Indeed, it was shown that the influence of the second order
effects is more important for the panel plastic mechanism than for the combined one and is not significant for the beam plastic mechanism.
Figure 2. Example of “Ayrton‐Perry” curves
As the same problems of accuracy are met with the Merchant‐Rankine approach for steel and composite sway frames, the proposed method was developed for steel sway frame and for composite sway frames. Within the present document, we will only focus on the composite sway frames.
3.3.2 Parametrical study on composite sway frames
Within the parametrical study, three types of 2‐D “academic” simple frames have been investigated (Figure 3); in total, 199 frames have been studied. Different types of structural elements are met within the investigated frames as described here below: • Two types of composite beam configurations bent around their major axis: o upper hot‐rolled profile flange fully connected to a concrete slab or; o upper hot‐rolled profile flange fully connected to a composite slab. • Two types of columns bent around their major axis: o steel hot‐rolled profile ones or; o partially encased composite ones. • The beam‐to‐column composite joints are rigid or semi‐rigid ones and full‐strength or partial‐ strength ones; the column bases are assumed to be rigid and fully resistant. The beam‐to‐ column joints are assumed to have a sufficient ductility to develop plastic hinges and to allow a plastic analysis.
The steel material and the joint behaviour are modelled through an elastic‐perfectly plastic bilinear law. For the concrete material, a parabolic behaviour law with account of tension stiffening is used. For the material properties, the characteristic values are used.
Through preliminary investigations performed before the parametrical study, an important phenomenon has been highlighted: even if the cross sections of a composite sway frame can be considered as Class 1 cross sections according to the recommendations given in Eurocode 4, it has been observed that the ductility of the concrete is sometimes not sufficient to allow the development of a full plastic mechanism within the frame. Indeed, the ultimate deformation allowed in the concrete in compression, i.e. εcu = 0, 35 % (defined according to Eurocode 2) was reached
Reduction factor χ Non‐dimensional slenderness λ 1 0 λ μ1 μ2 > μ1
before the formation of the plastic mechanism. This phenomenon leads to a limitation of the ultimate loads that the frame could sustain. As this problem can be considered as a problem of cross section classification, which is not under investigation, this phenomenon has been bypassed assuming a sufficient ductility of the concrete to allow the development of the plastic mechanism. In future investigations, new criteria for the composite cross section classification, taking into account of the maximum deformation capacity of the concrete, should be developed.
The properties of the frames have been defined so as to cover the three types of plastic mechanisms, i.e. beam, combined and panel plastic mechanisms (obtained through first‐order rigid‐plastic analyses) with each type of structures and to obtain different types of collapse modes (plastic mechanisms or instability) through the full non‐linear analyses. The parameters which are modified within these frames are: • the type of structural elements (as mentioned previously); • the height of the columns; • the properties of the joints; • the beam and column cross sections and; • the applied loads. Figure 3. Structure types A, B and C The types of analyses which have been performed are: • Critical elastic analyses (λcr);
• First‐order rigid‐plastic analyses (computation of the three plastic load factors, i.e. λp,beam,
λp,combined and λp,panel);
• Full non‐linear analyses (λu). V1 V2 V1 Type A H1 V1 V2 V1 Type B H1 V1 V2 V1 H2 V1 V2 V1 V1 V2 Type C H1
For the computation of λcr and λu, the homemade FEM software FINELG is used. As recommended in
Eurocode 4, an initial deformation is introduced in the computation. The formula to be used to estimate a value for the initial out‐of‐plumb φ is the same than the one proposed in Eurocode 3. Also, the shape of the initial deformation introduced in the computations is proportional to the first global instability mode obtained through the critical elastic analysis.
For the computation of the plastic load factors, a software based on an Excel sheet has been developed and validated through comparisons to numerical results. The M‐N interaction in the columns for the computation of the plastic load factors is taken into account.
The results obtained with the new method and with the Merchant‐Rankine approach are compared to the numerical results obtained through the performed non‐linear analyses considered as the “reference” ones. In the analytical methods, the values of λcr which are used are the numerical ones
obtained through FINELG.
The investigated frames were defined so as to cover the different types of collapse modes (obtained through non‐linear analyses) and to cover a wide range of λp/λcr values (from 0,05 to 0,31), λp being
the minimum value of the three plastic load factors λp,beam, λp,combined and λp,panel.
The three values of μ, i.e. μbeam, μcombined and μpanel, calibrated so as to minimize the difference
between the predicted values of λu through the new method and the ones numerically predicted are
the following:
- μbeam = 0,02;
- μcombined = 0,42 and;
- μpanel = 0,7.
The comparison between the predicted values of λu obtained through the analytical methods (the
new one and the Merchant‐Rankine approach) and the numerical simulations is given in Figure 4 and Figure 5 for all the frames.
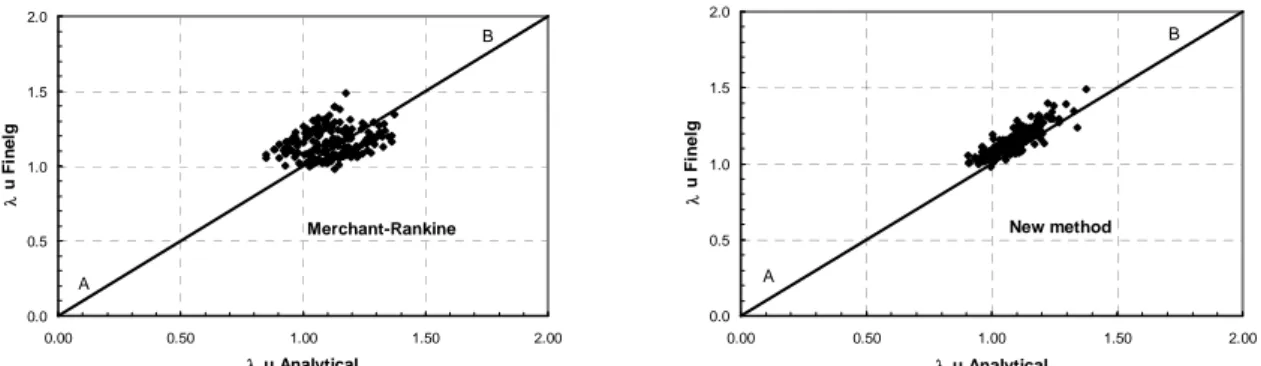
From Figure 4, it can be observed that the new method gives more accurate results than the Merchant‐Rankine approach; indeed, the points obtained through the new method are closer to the line “AB” than the ones obtained with the Merchant‐Rankine approach. Also, more points on the “unsafe side” of the graph (i.e. below the line AB) are present with the Merchant‐Rankine approach than with the new method; indeed, 81 cases (i.e. 40,7 % of the investigated frames) are unsafe through the Merchant‐Rankine approach for only 15 (i.e. 7,5 % of the investigated frames) cases through the new method.
From Figure 5, it can be observed that the number of frames for which the differences on the value of λu is between 0 % and 10 % is equal to 167 with the new method (i.e. 83,9 % of the frames) and to
51 with the Merchant‐Rankine approach (i.e. 25,6 % of the frames) which confirms the better accuracy of the proposed method.
Figure 4. Comparison between the analytical and the numerical results for the prediction of λu (all the investigated composite frames)
Figure 5. Evaluation of the accuracy of the analytical methods (all the investigated composite frames) Also, amongst the investigated composite frames, there are cases (38 in total, i.e. 19,1 % of the investigated composite frames) where the collapse mode associated to λu do not correspond to the
one associated to the minimum value of λp. It is interesting to underline that, with the new method,
the type of plastic mechanism associated to the minimum value of λu corresponds to the one
appearing through the fully non‐linear numerical analysis for 99,5 % of the investigated frames. Also, it is recommended to apply the Merchant‐Rankine method to structures with a λp/λcr between 0,1 and 0,25. If only the frames respecting this condition are considered (which is the case for 150 of the investigated composite structures), the results presented in Figure 6 and in Figure 7 are obtained. From the latter, the previous observations are still valid; it can be observed that: • Only 13 unsafe situations (i.e. 8,7 % of the considered frames) are obtained with the new method for 57 (i.e. 38 % of the considered frames) with the Merchant‐Rankine approach. • The number of frames for which the differences on the value of λu is between 0 % and 10 % is now equal to 131 with the new method (i.e. 87,3 % of the considered frames) and to 40 with the Merchant‐Rankine approach (i.e. 26,7 % of the considered frames) which confirms the better accuracy of the proposed method. Merchant-Rankine 0.0 0.5 1.0 1.5 2.0 0.00 0.50 1.00 1.50 2.00 λ u Analytical λ u Fi n e lg A B New method 0.0 0.5 1.0 1.5 2.0 0.00 0.50 1.00 1.50 2.00 λ u Analytical λ u Fi ne lg A B
Range of differences according to the non-linear analyses results [%]
1 1 3 4 2 9 8 8 16 26 26 22 28 13 11 5 4 3 2 2 1 2 1 2 2 3 2 1 2 13 5 11 1 7 7 2 7 8 6 3 7 9 4 1 3 1 5 5 6 7 8 9 6 7 5 3 4 9 8 5 3 3 -18 t o -1 7 -17 t o -1 6 -16 t o -1 5 -15 t o -1 4 -14 t o -1 3 -13 t o -1 2 -12 t o -1 1 -11 t o -1 0 -10 t o -9 -9 t o -8 -8 t o -7 -7 t o -6 -6 t o -5 -5 t o -4 -4 t o -3 -3 t o -2 -2 t o -1 -1 to 0 0 to 1 1 to 2 2 to 3 3 to 4 4 to 5 5 to 6 6 to 7 7 to 8 8 to 9 9 t o 10 10 t o 11 11 t o 12 12 t o 13 13 t o 14 14 t o 15 15 t o 16 16 t o 17 17 t o 18 18 t o 19 19 t o 20 20 t o 21 21 t o 22 New method Merchant Rankine
• The type of plastic mechanism associated to the minimum value of λu obtained with the
proposed new method corresponds to the one appearing through the fully non‐linear numerical analysis for 100 % of the investigated frames.
Figure 6. Comparison between the analytical and the numerical results for the prediction of λu (λp/λcr
∈
[0,1 ; 0,25])Figure 7. Evaluation of the accuracy of the analytical methods (λp/λcr
∈
[0,1 ; 0,25])Finally, in a recent diploma work [3], it was demonstrated that the developed method remains accurate even if the critical load factor λcr is computed through simplified analytical methods and in particular, through the method proposed in Eurocode 3 for steel frames.
3.4 Perspectives
• When performing the parametrical study on the composite sway frames to develop the simplified analytical method based on the Ayrton‐Perry formulation, it was mentioned that problems were met with the deformation capacity of the concrete. Indeed, even if the cross sections of a composite sway frame can be considered as Class 1 cross sections according to the recommendations given in Eurocode 4, it has been highlighted, through preliminary investigations that the ductility of the concrete, as defined in Eurocode 2, is sometimes not sufficient to allow the development of a full plastic mechanism within the frame. Merchant-Rankine 0.0 0.5 1.0 1.5 2.0 0.00 0.50 1.00 1.50 2.00 λu Analytical λ u Fi nel g A B New method 0.0 0.5 1.0 1.5 2.0 0.00 0.50 1.00 1.50 2.00 λu Analytical λ u F ine lg A B
Range of differences according to the non-linear analyses results [%]
0 0 1 2 1 7 6 8 14 20 24 17 19 8 8 3 3 3 1 1 1 2 0 1 2 3 0 1 2 10 4 9 0 1 5 2 4 8 6 1 6 6 4 1 1 0 1 4 5 5 8 8 6 6 4 3 3 9 7 1 3 1 -1 8 to -1 7 -1 7 to -1 6 -1 6 to -1 5 -1 5 to -1 4 -1 4 to -1 3 -1 3 to -1 2 -1 2 to -1 1 -1 1 to -1 0 -1 0 to -9 -9 to -8 -8 to -7 -7 to -6 -6 to -5 -5 to -4 -4 to -3 -3 to -2 -2 to -1 -1 to 0 0 to 1 1 to 2 2 to 3 3 to 4 4 to 5 5 to 6 6 to 7 7 to 8 8 to 9 9 to 10 10 t o 11 11 t o 12 12 t o 13 13 t o 14 14 t o 15 15 t o 16 16 t o 17 17 t o 18 18 t o 19 19 t o 20 20 t o 21 21 t o 22 New method Merchant Rankine
More investigations on this topic should be performed. An idea would be to introduce an additional criterion relative to the ductility of the concrete when considering the classification of composite cross sections.
• The validation of the analytical method developed to predict the response of steel and composite sway frames have been performed through comparisons with numerical results obtained for “academic” structures. It would be interesting to apply the developed method to actual buildings to see if the very good accuracy of the method is kept for such buildings.
4 Robustness of structures
4.1 Introduction
Recent events such as natural catastrophes or terrorism attacks have highlighted the necessity to ensure the structural integrity of buildings under exceptional events. According to Eurocodes and some different other national design codes, the structural integrity of civil engineering structures should be ensured through appropriate measures but, in most of the cases, no precise practical guidelines on how to achieve this goal are provided. A European RFCS project called “Robust structures by joint ductility” has been set up in 2004, for three years, with the aim to provide requirements and practical guidelines allowing to ensure the structural integrity of steel and composite structures under exceptional event through an appropriate robustness.
The investigations performed at Liège University, as part of this European project, are mainly dedicated to the exceptional event “Loss of a column in a steel or steel‐concrete composite building frame”; the main objective is to develop a simplified analytical procedure to predict the frame response further to a column loss. The development of this simplified procedure is detailed in two complementary PhD theses: the thesis of Demonceau [1] and the thesis of H.N.N. Luu [8]. The present paragraph describes experimental and analytical studies carried out in Liège on this topic. In particular, a simplified analytical method allowing the prediction of the frame response with account of the membrane effects is described.
Also, an ongoing RFCS project called ROBUSTFIRE, coordinated by Liège University, will be briefly introduced.
4.2 General concepts
The loss of a column can be associated to different types of exceptional actions: explosion, impact of a vehicle,… Under some of these exceptional actions, dynamic effects may play an important role; within the performed studies, it is assumed that the action associated to the column loss does not induce significant dynamic effects. So, the performed investigations are based on static approaches. When a structure is losing a column, the latter can be divided in two main parts, as illustrated in Figure 8:
• the directly affected part which represents the part of the building directly affected by the loss of the column, i.e. the beams, the columns and the beam‐to‐column joints which are just above the loss column and;
• the indirectly affected part which represents the part of the building which is affected by the loads developing within the directly affected part and which influences the development of these loads.
If a cut in the structure is realised at the top of the loss column (see Figure 8), different internal loads in the vertical direction are identified:
• the shear loads V1 and V2 at the extremities closed to the loss column; • the axial load Nup in the column just above the loss column and; • the axial load Nlo in the loss column. . Figure 8. Representation of a frame losing a column and main definitions In Figure 9, the curve representing the evolution of the normal load Nlo in the loss column (see Figure 8) according to the vertical displacement Δa is illustrated:
• From point (1) to (2) (Phase 1), the design loads are progressively applied, i.e. the “conventional” loading is applied to the structure; so, Nlo progressively decreases (Nlo becomes negative as the column “AB” is subjected to compression) while ΔA can be assumed to be equal to 0 during this phase (in reality, there is a small vertical displacement at point A associated to the compression of the columns below point “A”). It is assumed that no yielding appears in the investigated frame during this phase, i.e. the frame remains fully elastic.
• From point (2) to (5), the column is progressively removed. Indeed, from point (2), the compression in column “AB” Nlo is decreasing until reaching a value equal to 0 at point (5) where the column can be considered as fully destroyed. So, in this zone, the absolute value of Nlo is progressively decreasing while the value of ΔA is increasing. This part of the graph is divided in two phases as represented in Figure 9:
o From point (2) to (4) (Phase 2): during this phase, the directly affected part passes from a fully elastic behaviour (from point (2) to (3)) to a plastic mechanism. At point (3), first plastic hinges are appearing in the directly affected part.
o From point (4) to (5) (Phase 3): during this phase, high deformations of the directly affected part are observed and second order effects play an important role. In particular, significant catenary actions are developing in the bottom beams of the directly affected part. It is only possible to pass from point (1) to (5) if: Indirectly affected part Directly affected part V1 V2 Nup Nlo A A
• the loads which are reported from the directly affected part to the indirectly affected part do not induce the collapse of elements in the latter (for instance, buckling of the columns or formation of a global plastic mechanism in the indirectly affected part);
• if the different structural elements have a sufficient ductility to reach the vertical displacement corresponding to point (5).
It is also possible that the complete removal of the column is reached (i.e. Nlo = 0) before reaching
Phase 3.
Fig. 2
. Evolution of Nlo according to the vertical displacement at the top of the loss columnThe objective of the work developed in Liège was to be able to predict, through simplified analytical models, the response of the structure during the loss of the column in order to be able to derive the requested rotation capacities of the structural elements and the loads present within the directly affected part and reported on the indirectly affected part in order to check the resistance of the latter.
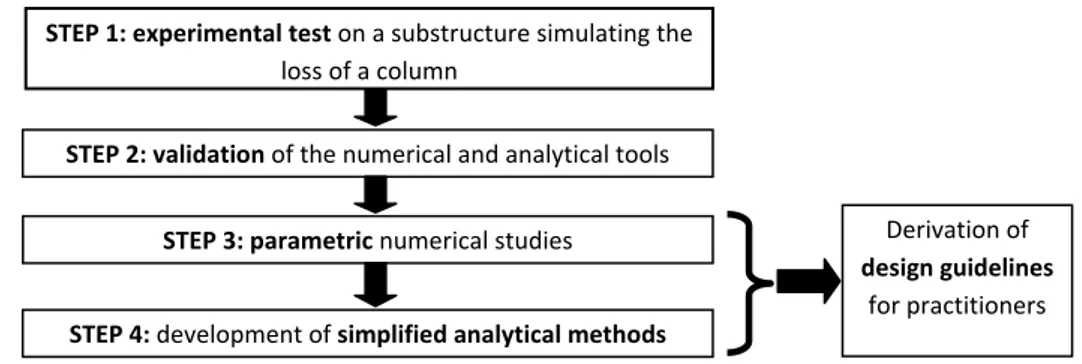
The investigation of the response of the frame during Phase 1 and 2 is the topic of the thesis of Luu [8] while the response during Phase 3 is the topic of the thesis of Demonceau [1]. The adopted strategy to study Phase 3 is presented in Figure 10:
• Step 1: an experimental test is carried out in Liège on a substructure with the aim to simulate the loss of a column in a composite building frame.
• Step 2: analytical and numerical FEM tools are validated through comparisons with the experimental results
• Step 3: parametric studies based on the use of the models validated at step 2 are carried out; the objective is to identify the parameters influencing the frame response during Phase 3. • Step 4: a simplified analytical method is developed with due account of the parameters
identified at step 3 and validated through comparisons with the experimental test results of step1. Phase 3 Phas e 2 Pha se 1 Δ N (1) (2) (4) (5) (3) lo lo.design N a
Figure 10. Strategy followed at Liège University to investigate Phase 3
The present paragraph is mainly dedicated to the investigations performed within steps 1 and 4.
4.3 Experimental test on a substructure
As previously mentioned, a test on a composite substructure has been performed in Liège to simulate the loss of a column. The main objective of the test is to observe the development of catenary actions within a frame and the effect of these actions on the behaviour of the semi‐rigid and partial‐strength composite beam‐to‐column joints. Indeed these joints are initially designed and loaded in bending, but have progressively to sustain tensile loads as a result of the development of membrane tying forces in the beams.
To define the substructure properties, an “actual” composite building has been first designed according to Eurocode 4, so under “normal” loading conditions. As it was not possible to test a full 2‐ D actual composite frame within the project, a substructure has been extracted from the actual frame; it has been chosen so as to respect the dimensions of the testing floor in the laboratory but also to exhibit a similar behaviour than the one in the actual frame. The tested substructure is presented in Figure 11. As illustrated, horizontal jacks were placed at each end of the specimen so as to simulate the lateral restraints brought by the indirectly affected part of actual building when catenary actions develop.
A specific loading history is followed during the test. First, the vertical jack at the middle is locked and permanent loads are applied on the concrete slab with steel plates and concrete blocks (“normal” loading situation). Then, the vertical jack is unlocked and large displacements develop progressively at point A (Figure 11) until the force in the jack vanishes (free spanning of 8 m). Finally, a downward concentrated vertical load is applied to the system above the impacted column and is then progressively increased until collapse. The “vertical load vs. vertical displacement at point A” curve is reported in Figure 12. Figure 11. Tested substructure STEP 1: experimental test on a substructure simulating the loss of a column STEP 2: validation of the numerical and analytical tools STEP 3: parametric numerical studies Derivation of design guidelines for practitioners STEP 4: development of simplified analytical methods A
Figure 12. “Vertical load at the jack vs. vertical displacement at point A” curve
Besides that, experimental tests in isolation have been performed at Stuttgart University on the composite joints of the substructure, respectively under hogging or sagging bending moments and tensile axial forces; finally tests on joint components have been realised at Trento University. So as to be able to compare the results obtained in the laboratories, all the steel elements (profiles, plates and rebars) were provided by the same companies and came from the same rolling. A unique chain of consistent experimental results is so obtained.
4.4 Development of an analytical tool to predict the response of a structure
with account of the membrane effects
Through numerical investigations [1], it was shown that it is possible to extract a simplified substructure (see Figure 13) able to reproduce the global response of a frame further to a column loss. The objective with the analytical procedure is to predict the behaviour of the substructure in the post‐plastic domain, i.e. after the formation of the beam plastic mechanism in the substructure; accordingly, the analytical model is based on a rigid‐plastic analysis. Also, as the deformations of the substructure are significant and influence its response, a second‐order analysis is conducted.
The parameters to be taken into account in the developed procedure are presented in Figure 13: • p is the (constant) uniformly distributed load applied on the storey modelled by the
simplified substructure and the concentrated load Q simulates the column loss (= ‐(Nlo – Nup) (see Figure 8) with Nup constant and equal to Nup at point 4 (see Figure 9) what is demonstrated in [8]); • L is the total initial length of the simplified substructure; • ΔQ is the vertical displacement at the concentrated load application point; • δK is the deformation of the horizontal spring simulating the lateral restraint coming from the indirectly affected part; • δN1 and δN2 are the plastic elongations at each plastic hinges; • θ is the rotation at the plastic hinges at the beam extremities.
In addition, the axial and bending resistances at the plastic hinges NRd1 and MRd1 for the plastic hinges 1 and 4 and NRd2 and MRd2 for the plastic hinges 2 and 3 have also to be taken into account (it is
-40 -30 -20 -10 0 10 20 30 40 50 60 70 80 90 100 110 120 130 0 50 100 150 200 250 300 350 400 450 500 550 600 650 700 750 800 Load at the jack [kN]
assumed that the two plastic hinges 1 and 4 and the two plastic hinges 2 and 3 (see Figure 13) have respectively the same resistance interaction curves).
In order to be able to predict the response of the simplified substructure, the parameters K and FRd have to be known; these parameters depend of the properties of the indirectly affected part (see Figure 8). In [8], analytical procedures have been defined to predict these properties.
The results obtained with the so‐developed analytical procedure are compared to the substructure test results in Figure 14. In this figure, it can be observed that a very good agreement is obtained between the analytical prediction and the experimental results, what validates the developed method. More details about the developed method are available in [1]. δ δ δ δ δ δ Δ θ Figure 13. Substructure to be investigated Figure 14. Comparison analytical prediction vs. experimental results
4.5 ROBUSTFIRE project
A RFCS called ROBUSTFIRE (Robustness of car parks against localised fire) is actually in progress. The project started in July 2008 and will end in June 2011.In this project, a general philosophy for the design of robust structures against exceptional events will be developed and practical design guidelines for its application to car parks under localised fire will be derived. To achieve this goal, experience will be gained from previous or ongoing RFCS projects related to various individual aspects (temperature distribution, joint behaviour …) and further experimental, numerical and analytical developments will be achieved.
In particular, the behaviour of car parks further to a localized fire developing around a column and leading to the loss of the latter will be investigated in details. The contribution of the development of membrane effects within the composite slab will be taken into account. The behaviour of joints subjected to fire and to combined bending and axial loads will also be studied analytically, numerically and experimentally.
4.6 Perspectives
• As mentioned previously, the analytical method proposed to predict the response of the simplified substructure simulating the response of a frame further to the loss of a column with account of the membrane forces is founded on a static approach. It will be requested to improve the developed method in order to take into account of the dynamic effects which can be associated to a column loss. A first diploma work on this topic -40 -30 -20 -10 0 10 20 30 40 50 60 70 80 90 100 110 120 130 0 50 100 150 200 250 300 350 400 450 500 550 600 650 700 750 800 Deflection at the middle [mm]
L o ad at the jack [kN] Experimental result Analytical prediction
[9] has recently been presented in Liège but the latter was dedicated to steel structures only. So, further investigations are still requested to investigate the response of composite structures further to a column loss with account of the dynamic effects.
• The presented studies have been performed on 2D frame only. Accordingly, the influence of the 3D response of the frame and, in particular, of the slab (which can be a composite one) is not taken into account. However, significant membrane forces can develop within the slab, what can improve the behaviour of the structure further to a column loss. Further investigations are also requested on this point. As mentioned in § 4.5, this aspect should be investigated within the ongoing project ROBUSTFIRE.
• At the end of the day, the development of simplified models, useful for practitioners in design office will be requested. The idea would be to develop a general concept which could be applied to a structure, whatever the used material is and then, to come with design recommendations which take into account of the specificity of the constitutive material(s) of the structure.
5 Behaviour of composite joints
5.1 Introduction
The behavioural response of the joints is known to significantly influence the global behaviour of structures. This paragraph summarizes recent investigations conducted in Liège on this topic.
5.2 Behaviour of singlesided composite joints subjected to “hogging”
moments
For three years (2000‐2003), in the framework of a European research project funded by the European Community for Steel and Coal (ECSC – Report EUR 21913 EN) in which Liège University was deeply involved, intensive experimental, numerical and theoretical investigations have been carried out on the behaviour of composite sway buildings under static and seismic loading.
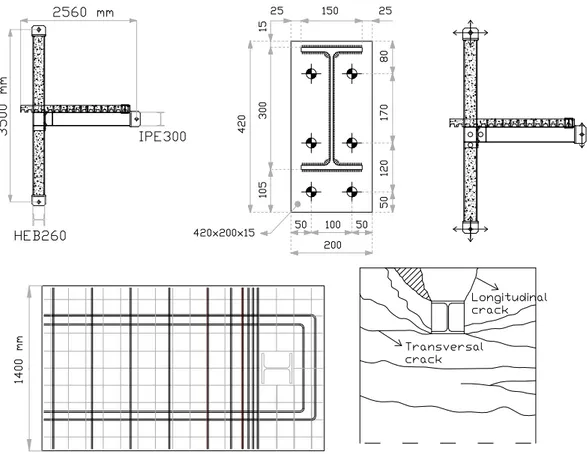
As part of the above European project, Liège University carried out experimental and analytical studies with the objective to investigate the behaviour of a single‐sided composite joint configuration (see Figure 15) under static loading (under hogging moment).
A particular failure mode occurred during the experimental tests, which had not yet been detected previously; it is described in details in [1]. During the tests, first cracks in the concrete slab appeared i) transversally, close to connection and ii) longitudinally, just behind the column, as shown in the following figures. The transversal cracks result from the tension forces in the longitudinal rebars while the longitudinal ones are due to shear forces. The tests was stopped with the collapse of the concrete behind the column has illustrated by the hatched part of the slab in Figure 15.
In fact, this failure mode is not taken into account in the component method proposed in EC4 for the characterisation of composite beam‐to‐column joints. Indeed, a minimum amount of rebars to be placed behind the column is only proposed to avoid the concrete crushing against the column; however, this recommendation seems not to be satisfactory as the latter was respected for the tested specimen.
So, an analytical formula covering this particular phenomenon and based on a theoretical model has been developed. In EC4, the resistance of “slab rebars in tension” component is defined as ,13 s sk Rd s A f F γ = where As is the total area of the longitudinal slab rebars in tension with a diameter higher than 6 mm, fsk is the yield strength of the rebars in tension and γs is the safety coefficient for the rebars (equal to 1,15
according to EC4). The formula which is here suggested to include the identified collapse mode is
(
)
,2 ,13 2 2 min s sk; s sk Rd s s A f A f F γ γ ⎡ ⎤ = ⎢ ⎥ ⎣ ⎦ where As,2 is the total area of the transverse slab rebars behind the column and the factor “2” in front of As,2 is justified by the presence of two sections of failure(one at each side of the column).
This new formula is validated through comparisons with the experimental results (see graph in Figure 16).
Figure 16. Comparison of analytical predictions versus test results
Another solution would be to adapt the value of the minimum amount of rebars to be placed behind the column. According to the developed formula, the section of rebars As,2 behind the column should be at least higher than As instead of As/2 as actually recommended.
5.3 Behaviour of joints subjected to “sagging” moments
Within the Eurocodes, the analytical procedure recommended for the design of joints is the “component method”. This one does not allow the prediction of the behaviour of composite joints subjected to sagging bending moments. Indeed, no method is available to characterise one of the active joint components, the “concrete slab in compression” (see Figure 17).
Figure 17. Concrete slab in compression in the vicinity of the column (test performed at the University of Trento)
In recent researches, methods to characterise this component, in terms of resistance, have been proposed; they aimed at defining an effective rectangular cross‐section of concrete contributing to the joint resistance. The procedure which is described in this section combines two methods
0 50 100 150 200 250 300 0 0.01 0.02 0.03 0.04 0.05 0.06 0.07 0.08 Mom ent [kNm ]
Joint rotation [rad]
Test result
Component Method (EC4)
0 30 60 90 120 150 180 210 0 0.01 0.02 0.03 0.04 0.05 0.06 0.07 0.08 Mom ent [kN m ] Rotation [rad] Test results
CM with the new formula and all the rebars CM with new formla and neglecting 6mm rebars
proposed respectively by Ferrario [17] and by Liew [18]. The combination of these two methods permits to reflect in a more appropriate way how the concrete resists to the applied load in the vicinity of the joint.
Also, a formula for the characterisation of this component in terms of stiffness is proposed in [1]. These methods are first described and then the validation of the latter is illustrated through comparisons with experimental test results.
5.3.1 Proposed analytical method
In the PhD thesis of Ferrario [17], a formula is proposed to compute the width of concrete beff,conn which has to be considered for the “concrete slab in compression” joint component:
,
0, 7
eff conn c c eff
b
= +
b
h
≤
b
where bc is the width of the column flange, hc the height of the column cross‐section and beff the effective width of the concrete/composite slab to be considered in the vicinity of the joint (given in Eurocode 4); bc represents the contribution of the concrete directly in contact with the column flange while 0,7hc, the contribution of the concrete rods developing in the “strut‐and‐tie” model illustrated in Figure 18.
In the paper of Liew et al [18], the width of the concrete is taken as equal to the width of the column flange (beff,conn = bc) and the development of the concrete rods in compression in the “strut‐and‐tie” model is neglected.
The definition of the width given by Ferrario in [17] is used in the present study as it reflects in a more appropriate way, according to the observations made during experimental tests ([1] and [19]), the mechanism actually developing in the concrete slab.
Figure 18. Plane view of the slab in the vicinity of the joint ‐ development of concrete rods in compression under sagging moment
Another difference between the two approaches is the definition of the height of concrete to be considered and, accordingly, the position of the centre of compression within the joint. In [17], the centre of compression is assumed to be at mid‐height of the concrete slab while in [18], the following procedure is given to compute the position of this point:
• the characterisation of the components in tension is performed according to the rules recommended in the Eurocodes;
• then, the height of the concrete/composite slab contributing to the joint behaviour is computed by expressing the equilibrium of the load developing in the concrete/composite slab in compression with the components in tension or in shear and by assuming a rectangular stress distribution in the concrete (defined as equal to 0,85 fck/γc in Eurocode 4). For instance, in the example illustrated in Figure 19, the concrete height to be considered is equal to: ,1 ,2 ,3 ,
.(0,85.
/
)
Rd Rd Rd concrete eff conn ck cF
F
F
z
h
b
f
γ
+
+
=
≤
where hconcrete is the total height of the concrete slab (in case of a composite slab, hconcrete is equal to the concrete above the steel ribs);
• finally, the characterisation of the joint is performed assuming that the centre of compression is located at mid‐height of the contributing part of the concrete slab (z). FRd,1 FRd,2 FRd,3 fck,actual Z Figure 19. Height of the concrete to be considered in the characterisation of the new component The Liew approach is here preferred as it more closely represents the reality observed during experimental tests [1].
Finally, the resistance of the “concrete slab in compression” component is computed as follows:
FRd,csc = beff,conn.z.(0,85.fck/γc)
The two previously mentioned references deal with the resistance of the “concrete slab in compression” component, but no formulae are proposed as far stiffness is concerned; this property is however required to predict the initial stiffness of the joint (and later on to derive the moment‐ rotation curve).
In [29], a formula is proposed to predict the stiffness of a concrete block bearing against a rigid plate. In the “concrete slab in compression” component, the steel column encased in the concrete slab may in fact be considered as a rigid plate; the formula proposed in [29] may therefore be directly extended by expressing the stiffness coefficient of the studied component as: , csc
.
.
1, 275.
c eff conn aE
b
z
k
E
=
where Ec is the secant Young modulus for concrete, Ea, the elastic Young modulus for steel and kcsc, the stiffness of the component “concrete slab in compression” to be integrated into the component method.
5.3.2 Validation of the proposed analytical method
In [1], the analytical procedure described in the previous paragraph is validated through comparisons with results from experimental tests performed on composite joints in isolation. An example of such comparison is presented in Figure 20 where the analytical prediction is compared to results of experimental tests conducted at Trento University [19] on external composite joints (see Figure 21) within a European RFCS project called PRECIOUS in which Liège University was involved.
In the computations, the actual material properties (without safety factors), determined through coupon tests for the steel materials and through cylinder compression tests for the concrete, are used. The resistant bending moment MRd and the initial stiffness Sj,ini are computed in full agreement with the component method recommended in the Eurocodes while the ultimate moment Mu, the post‐limit stiffness Sj,post‐limit and the rotation capacity φu are computed according to the method proposed in the PhD thesis of Jaspart [20] (which is in full agreement with the component method), as no methods are actually proposed in the codes to evaluate these properties. In Figure 20, two experimental curves are reported. They differ by the slab configuration: composite slab TEST 2 and full concrete slab for TEST 3 (see Figure 21). A very good agreement is observed between the analytical prediction and the experimental results. For TEST 2, a loss of resistance in the joint is observed at a rotation of 29 mrad. This dicontinuity is not reflected by the analytical prediction; in fact, this loss of resistance is associated to a lack of ductility of the concrete in the vicinity of the connection, phenomenon not yet covered by the proposed analytical procedure. Figure 20. Comparisons analytical prediction vs. experimental results [1] 2440 15 0 IPE300 HEB260 2970 Figure 21. Tested joint configurations at Trento University [19] TEST 2 TEST 3
5.4 Behaviour of joints subjected to combined bending moments and axial
loads
As previously mentioned, recent investigations were conducted in Liège on the exceptional event “Loss of a column in a steel or composite building frame”.
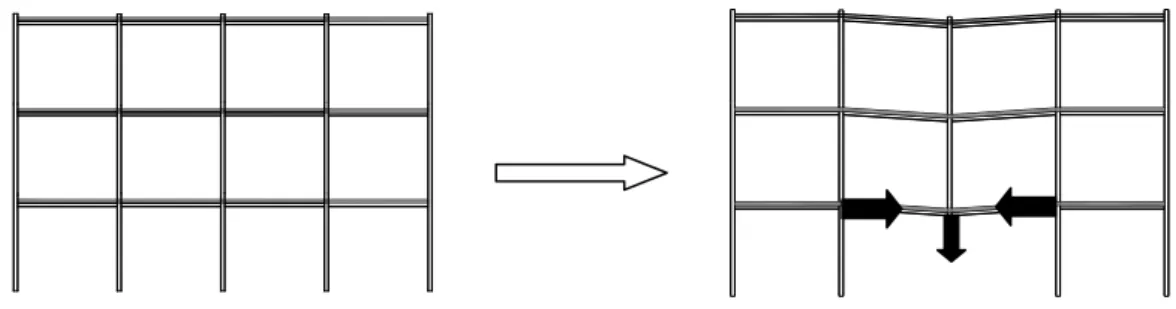
When a structure is subjected to such an exceptional event, significant vertical deflections appears within the structure, as illustrated in Figure 22, and membrane forces (i.e. axial loads) rapidly develop in the beams located just above the damaged or destroyed column. The joints are therefore subjected simultaneously to axial forces and bending moments.
Figure 22. Loss of a column in a frame
The membrane forces have an influence on the rotational stiffness, the moment resistance and the rotation capacity of the joints acting at beam ends, and vice‐versa; but, this “M‐N interaction” is not presently covered by the Eurocodes where, as a direct consequence, the field of application is limited to joints in which the axial force NEd acting in the joint remains lower than 5 % of the axial design resistance of the connected beam cross section Npl,Rd (EN 1993): ,