arXiv:1804.03365v1 [astro-ph.SR] 10 Apr 2018
Distorted-Wave and R-Matrix Methods
F. Delahaye,1N. R. Badnell,2C. P. Ballance,3P. Palmeri,4S. Preval,2
P. Quinet,4C. Ramsbottom,3R. T. Smyth,3M. Turkington,3and C. J. Zeippen1 1LERMA, Observatoire de Paris, PSL Research University, CNRS, Sorbonne University, UPMC Univ Paris 06, F-92190 Meudon, France;
franck.delahaye@ obspm.fr
2Department of Physics, University of Strathclyde, Glasgow G4 0NG, UK 3CTAMOP, School of Mathematics and Physics, Queen’s University, Belfast BT7 1NN, UK
4Physique Atomique et Astrophysique, Université de Mons - UMONS, B-7000 Mons, Belgium
Abstract. The present debate on the reliability of astrophysical opacities has reached a new climax with the recent measurements of Fe opacities on the Z-machine at the Sandia National Laboratory (Bailey et al. 2015). To understand the differences be-tween theoretical results, on the one hand, and experiments on the other, as well as the differences among the various theoretical results, detailed comparisons are needed. Many ingredients are involved in the calculation of opacities; deconstructing the whole process and comparing the differences at each step are necessary to quantify their im-portance and impact on the final results. We present here such a comparison using the two main approaches to calculate the required atomic data, the R-Matrix and distorted-wave methods, as well as sets of configurations and coupling schemes to quantify the effects on the opacities for the Fe xvii and Ni xiv ions.
1. Introduction
More than three decades ago Simon (1982) made a plea for a recalculation of metal opacities to solve the so-called Cepheids problem. Two groups answered this call: the team led by Forrest Rogers and Carlos Iglesias from the Lawrence Livermore National Laboratory (LLNL), referred to as OPAL, who used an equation of state (EOS) based on a “physical picture” (Rogers et al. 1996), and the international Opacity Project (OP) led by Mike Seaton who preferred an EOS approach based on a “chemical picture” (Seaton 1987). A succinct summary of these earlier days can be found in a review by Zeippen (1995).
By the mid 1990s both groups ended up with enhanced metal opacities: the factor of 2 to 3 expected by Simon was indeed obtained. The OPAL physical approach enabled careful inclusion of plasma effects and a detailed EOS (Rogers & Iglesias 1992). The chemical approach favored detailed calculations of the basic atomic data using state-of-the-art codes such as superstructure (Eissner et al. 1974; Nussbaumer & Storey
1978), CIV3 (Hibbert 1975), and the R-Matrix suite of scattering codes (Burke et al. 1971; Berrington et al. 1987; Seaton 1987; Hummer et al. 1993), the plasma effects were then added as perturbations (Berrington et al. 1987; Seaton 1987). Since then, these opacity datasets have been successfully incorporated in stellar models replacing the previous standard, namely, the Astrophysical Opacity Library (Cox & Ellers 1960; Cox & Stewart 1965, 1970a,b; Cox & Tabor 1976).
Although the two independent projects were based on largely different physical frameworks, the agreement between the OPAL and OP opacities after the latter were upgraded (Badnell et al. 2005, OP2005 hereafter) was satisfactory in solar interior con-ditions, and their public datasets rapidly became reference data in stellar astrophysics. The format of the OPAL Rosseland-mean opacity tables1 became the de facto stan-dard, and the OP basic atomic data and monochromatic opacities have been useful in many astrophysical applications (line identifications, synthetic spectra synthesis, etc.). In more recent years, the OP has made available two online servers2 with opacity and radiative acceleration data and utilities (Mendoza et al. 2007; Delahaye et al. 2016).
Despite the good agreement between the OPAL and OP opacities, as well as with other more recent efforts such as OPAS from the CEA (Blancard et al. 2012; Mon-det et al. 2015) and LEDCOP (now ATOMIC) from Los Alamos National Laboratory (Colgan et al. 2013a,b, 2015, 2016) and the accurate reproduction of the helioseismic benchmarks by standard solar models using them, the integrity of the opacity tables was questioned in 2004 when Asplund et al. (2004, 2005) recommended revised solar abundances with reduced C, N, and O contents at the level of 30–40%. The new so-lar composition seriously deteriorated the much coveted agreement between theory and helioseismic measurements.
In the last decade a large number of studies have appeared suggesting further opac-ity changes (for recent developments, see Villante et al. 2014; Vinyoles et al. 2017, and references therein); such changes are viewed by many as a way to reconcile the new solar composition with the helioseismic benchmarks. There is indeed a direct link be-tween opacities and composition (see, for example, Turck-Chièze 1998); however, the problem is still unresolved as opacity producers cannot find a well-defined cause or source for such increases. Furthermore, the revised solar abundances are still debated, and independent groups who have developed other 3D stellar atmosphere modelling codes do not entirely agree with the predictions by Asplund et al. (2005). The latter have themselves reassessed their initial predictions increasing somewhat the abundance of C, N and O as a result (Asplund et al. 2009). There is still room for improvement and the low-Z composition is still under debate. In a few words, the central question is, opacities or composition?
Later on experimentalists have become involved in the opacity debate, and recent measurements on the Z facility at Sandia National Laboratories by Bailey et al. (2015) certainly suggest a revision of the theoretical opacities. However, theorists are still puz-zled as to what is really missing in their calculations or which approximations need to be relaxed. Whichever the approach (the physical or chemical picture), EOS, or atomic configuration expansions, most theoretical efforts end up short of the experiment. This situation has led us to explore the fine details of opacity calculations comparing various
1https://opalopacity.llnl.gov/
approaches. Recent debates among producers (Nahar & Pradhan 2016a,b; Blancard et al. 2016; Iglesias & Hansen 2017) have emphasized the necessary compromise be-tween accuracy and completeness.
In the present work we explore the differences between the OP coupled-channel method and the perturbative methods used by most other approaches to calculate the basic atomic data (energy levels, f -values, photoionization cross sections) required to derive opacities. More specifically, while the latter is simpler and allows for extensive sets of electron configurations, the former treats resonances in a formal ab initio manner although the implementation of large sets of configurations rapidly becomes computa-tionally intractable. A quantitative evaluation is required. We have been evaluating the effects of the different resonance treatments on the accuracy of photoionization cross sections using the atomic structure code autostructure (AS, Badnell 2011) for the larger sets of configurations and the R-Matrix suite for accurate resonance representa-tions. We present here preliminary results for Fe xvii and Ni xiv.
2. Opacities: Ingredients
Many ingredients enter in the calculation of opacities: (i) the state of the absorbing material, that is, the ionic fraction of the constituents and the level populations for each ion that we refer to as the EOS; (ii) the absorbing coefficients associated with the dif-ferent processes (photoexcitation, scattering, and photoionization), i.e., the raw atomic data; (iii) the ion–ion and electron–ion interactions; and (iv) the physical conditions of the plasma whereby atoms cannot be considered isolated, and are treated via line broadening.
Many differences exist among current theoretical approaches at all levels; nonethe-less, it appears that the Rosseland mean opacities for the solar mixture agree to within 4% between OPAL, OPAS, OP, and LEDCOP (see, for example, OP2005, Delahaye & Pinsonneault 2006; Blancard et al. 2012). Naturally some compensation is introduced in the process of mixing different elements and averaging over frequencies, and the finer details in the monochromatic opacities for the different elements do not show the same level of agreement (Blancard et al. 2012).
When we look more closely at the contributions from the different processes of each element at each frequency point, the combination of the different processes gives the total elemental contribution
κtot(ν) = κbound−bound(ν) + κbound−free(ν) + κfree−free(ν) . (1) To derive the Rosseland mean we have to sum up these contributions; depending on the element and the physical conditions, the contribution of each of these processes varies. In stellar interiors and especially in the Sun, the photoionization contribution is dominant for all metals as shown, for instance, by Blancard et al. (2012). In our current endeavor to quantify all uncertainties in opacity calculations, it is then a good starting point to examine the photoionization cross sections by different methods and their impact on the derived opacities.
For the conditions we are interested in, akin to the boundary of the solar convec-tion zone and the Sandia experiment (T = 2.1 × 10⁶ K and ρ = 3 × 1022 cm−3
), there are two main pathways to photoionize an atom: the direct process whereby a photon is absorbed ejecting a free electron, and an indirect mechanism where the photon ex-cites the electron to an autoionizing state (also called a quasi-bound state), which then
autoionizes faster than by radiative decay (see Section 2.2). A key difference between perturbative and coupled-channel methods lies in the treatment of this indirect chan-nel. While the former methods treat resonances as individual lines, the OP R-Matrix formalism takes into account the interference between the direct and indirect channels giving rise to Beutler–Fano resonance profiles (Fano 1961).
In the present work we choose to study this interference and disentangle its effects rather than the impact of the convergence of the configuration expansions.
2.1. R-Matrix Method
Photoionization cross sections have been calculated using the Breit–Pauli R-Matrix method (Burke et al. 1971; Berrington et al. 1987; Seaton 1987; Hummer et al. 1993) as used in the Iron Project (IP) and in a number of previous publications. The aims and methods of the IP are presented in Hummer et al. (1993); we briefly summarize its main features as follows. In the close-coupling (CC) approximation the wave-function expansion Ψ(E) for a total angular symmetry Jπ of the (N + 1)-electron system is rep-resented in terms of the target ion states as
Ψ(E) = AX i χiΘi+ X j cjΦj, (2)
where χiis the target ion wave function in a specific level Jiπi. Θiis the wave function for the (N + 1)th electron in a channel labelled as
SiLi(Ji)ki2liπi(Jπ) (3) with ki2 being its incident kinetic energy. In the second sum Φj are correlation wave functions of the (N + 1)-electron system that (i) compensate for the orthogonality con-ditions between the continuum and the bound orbitals, and (ii) represent additional short-range correlations that are often of crucial importance in scattering and radiative CC calculations for each symmetry. The Φjare also referred to as the bound channels, as opposed to the continuum or free channels in the first summation over the target states. Details of the diagonalization of the Breit-Pauli R-Matrix method are given in many previous reports (e.g., Berrington et al. 1995).
2.2. IPIRDW Method
The photoionization cross sections of the bound states of Ni and Fe can be generated using the AS atomic structure code (Badnell 2011). AS computes term energies, fine-structure level energies, radiative and Auger rates, photoionization cross sections, and electron-impact collision strengths. In these calculations the atomic wave functions are constructed by diagonalizing the non-relativistic Hamiltonian whereby the radial orbitals are determined using a scaled statistical model potential. LS terms are repre-sented by configuration-interaction (CI) wave functions of the type
Ψ(LS ) =X i
ciΦi. (4)
Continuum wave functions are constructed within the distorted-wave (DW) approxi-mation. Relativistic fine-structure levels and rates can be obtained by diagonalizing the Breit–Pauli Hamiltonian in IC. The one- and two-body operators have been fully
implemented to order α2Z4, where α is the fine-structure constant and Z the atomic number.
The non-resonant direct photoionization process for an element X Xn++ hν → X(n+1)++ e−
(5) is treated separately from the photoexcitation–autoionization process
Xn++ hν →(Xn+)∗
→X(n+1)++ e− (6)
within the framework of the IPIRDW approximation (Badnell & Seaton 2003).
3. Results
In detailed quantitative comparisons between datasets, it is important to clearly estab-lish both the magnitude and origin of the discrepancies that are found. In the case of opacities, the origin, i.e., the atomic data, EOS, or broadening, must be ascertained with great care. For example, the differences in the atomic data can be multiple: the method (DW vs. R-Matrix), the specific set of configurations, or the coupling scheme.
3.1. OP Opacity Sets
The first set of OP opacities (hereafter OP1995) was delivered in the mid 1990s (Seaton et al. 1994; Seaton 1995; Zeippen 1995), and included atomic data calculated using the R-Matrix suite of codes in LS coupling complemented with f -values computed with the atomic structure code superstructure for selected Fe ions (Lynas-Gray et al. 1995). A final and more complete dataset containing additional inner-shell contributions calcu-lated in the DW approximation with AS was released by OP2005.
Nahar & Pradhan (2016a, hereafter NP2016) recently presented new R-Matrix re-sults on the photoionization of Fe xvii. In their Fig. 3 they highlight the enhancements in the photoionization cross sections resulting from 30-state and 99-state LS calcula-tions when compared to the 2-state LS cross section from OP1995. It must be noted that the 2-state OP data only include valence–electron absorption, while in the second release by OP2005, contributions from inner-shell photoexcitation and photoionization were taken into account in the DW approximation neglecting the interference between the direct and indirect channels mentioned in Section 2.2.
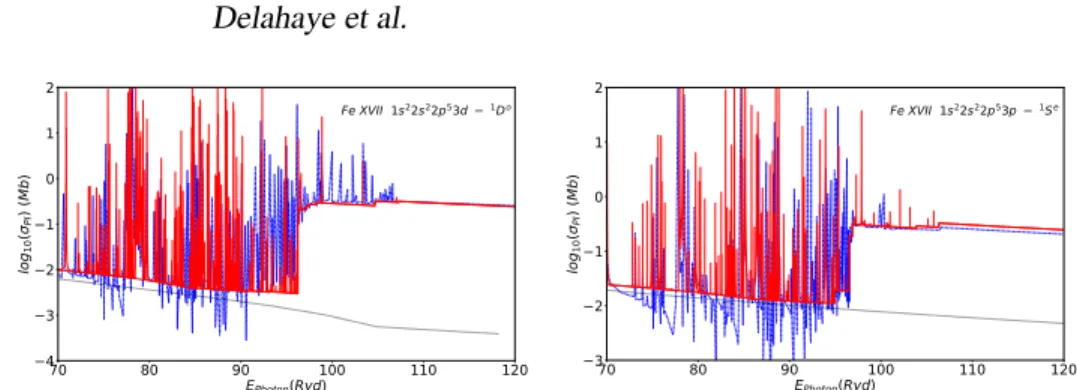
We show in Fig. 1 that the background cross sections by OP2005 and NP2016 for the 2p53d1Do and 2p53p1Se states of Fe xvii are in close agreement. The large enhancement therefore is more a consequence of inner-shell photoionization rather than channel interference. On the other hand, the detailed resonance profiles are different as they are assumed symmetric in DW in contrast to the more realistic Fano profile associated with channel interference in the R-Matrix method. This will have an impact on the final opacities as shown by Delahaye et al. (2013): a 10% increase was found in κRfrom the photoionization contribution of Ni xiv when using the R-Matrix approach, part of which is due to CI between complexes and part from the R-Matrix approach. 3.2. New OP Opacity Codes
In the OP approach the different steps to calculate opacities involve: (i) obtaining the raw atomic data (levels, photoionization cross sections, f -values); (ii) determining
70 80 90 100 110 120 EPhoton(Ryd) −4 −3 −2 −1 0 1 2 lo g10 (σPI ) (M b) Fe XVII 1s22s22p53d −1Do 70 80 90 100 110 120 EPhoton(Ryd) −3 −2 −1 0 1 2 lo g10 (σPI ) (M b) Fe XVII 1s22s22p53p −1Se
Figure 1. Photoionization cross section σPI of the 1s22s22p53d1Do (left panel) and 1s22s22p53p1Se(right panel) states of Fe xvii. Blue curve: Nahar & Pradhan (2016a). Black curve: 2-state (TOPbase). Red: OP2005.
the ionic fractions and level populations with the EOS; and (iii) applying the differ-ent broadening mechanisms (natural, electron impact broadening) to the bound–bound transitions and bound–free resonances. In order to clearly establish the impact of each of these steps on the final opacity we have developed a new set of codes allowing us to use different atomic data sources. We can then download data directly from databases such as TOPbase3 (Cunto et al. 1993), NORAD4or, if complete and consistent, from any atomic database linked to VAMDC (Delahaye et al. 2014; Dubernet et al. 2016), as well as direct output from AS or the R-Matrix suite of codes. It is then easier to establish clearly the impact due to the method (DW vs. close-coupling), target repre-sentation (configuration-interaction expansion), coupling (LS vs. IC), etc. Our new codes implement a finer frequency mesh for generating monochromatic opacities that is crucial to determine radiative accelerations. In the present work all monochromatic opacities have been calculated using a mesh with 105frequency points.
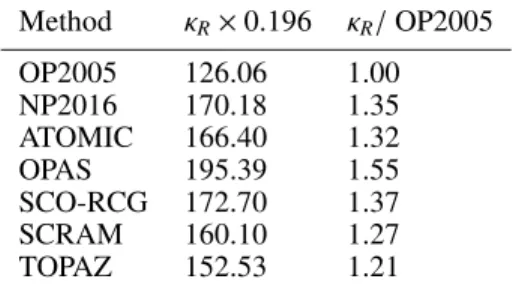
Our starting point is the comparison between the Rosseland means from different theoretical groups shown in Fig. 3 of Bailey et al. (2015) and summarized in Table 1 (based on Table 1 from Blancard et al. 2016). It is difficult to disentangle the possible discrepancy sources, even if some new contributions (new broadening, extended set of configurations) are invoked in, for example, Blancard et al. (2016), Nahar & Pradhan (2016a), and Iglesias & Hansen (2017).
3.3. Coupling Scheme, Resolution, Extended Targets, and Inner Shells
All the following results have been obtained at the plasma conditions of Sandia experi-ment (T = 2.1 × 10⁶K and ρ = 3 × 1022cm−3
). We test each effect independently and start by reanalysing the data used in OP2005. To test the impact of the frequency mesh resolution, we increase the mesh step from 104to 105points finding an increment in the Rosseland mean κRof at the most 1%. This outcome concurs with Seaton et al. (1994). We find a 2% reduction in κR when switching from LS coupling to IC. Although the effect of this switch was investigated by Badnell & Seaton (2003) for the 6-element solar mixture, the final updated OP2005 data used LS coupling throughout. It should be mentioned that OP2005 did not include the required renormalization of the
bound-3http://cdsweb.u-strasbg.fr/topbase/topbase.html 4http://norad.astronomy.ohio-state.edu/
Table 1. Comparison of the Fe xvii Rosseland mean opacity (in cm2g−1 ) from different calculations (based on numbers from Blancard et al. 2016). The OP2005 release is taken as reference (for details, see Blancard et al. 2016).
Method κR×0.196 κR/OP2005 OP2005 126.06 1.00 NP2016 170.18 1.35 ATOMIC 166.40 1.32 OPAS 195.39 1.55 SCO-RCG 172.70 1.37 SCRAM 160.10 1.27 TOPAZ 152.53 1.21
state populations taking into account the population redistribution to the autoionizing levels that occurs at high density; this leads to a 2% overestimate of κRfor Fe xvii under the present conditions. Moreover, the coupling scheme and the renormalization in the present results are certainly linked, as the redistribution of level populations from LS terms is not necessarily restricted to its corresponding fine-structure levels. A more detailed study is underway.
Badnell & Seaton (2003) and OP2005 studied the importance of inner-shell tran-sitions to the opacities, and as previously mentioned in Section 3.1, completed the OP opacities with inner-shell photoexcitation and photoionization data determined with the DW method implemented in AS. Among these inner-shell transitions, some arise from K-vacancy levels, and hence, we tested the importance of Auger broadening to the opacities. Present tests confirm the negligible effect previously found by Badnell & Seaton (2003) for the 6-element solar mix at the plasma conditions studied.
In the plasma conditions we are considering, collisional broadening dominates and its impact is crucial as seen in the left panel of Fig. 2. We have tested the effect of broad-ening on inner-shell processes using the data from OP2005: collisional broadbroad-ening in-creases the Rosseland mean by 30% when compared to only natural (i.e., radiative) and Auger broadening (Griem 1968; Seaton & Badnell 2004). To further test sensitivity we increased the original collisional broadening by multiplying the collisional widths by factors of 4.5, giving rise to an additional 35% uplift in the Rosseland mean as found by NP2016, and to 70% over the original OP2005 if collisional widths are multiplied by a factor 10. Line broadening affects the monochromatic opacity at the most important place; that is, between u = 2.5 and u = 4.0 (corresponding to 35 and 55 Ryd respec-tively) where the Rosseland weighting function goes through its maximum. The region covered by the Sandia experiment plays a lesser role since the weighting function has dropped significantly there. Relevant questions: are we underestimating collisional broadening? Or, do we have to revise our broadening formulae? Or, are NP2016 over-estimating broadening? Furthermore, is there any reason for treating line broadening differently from resonance broadening?
The OP2005 inner-shell contribution was estimated ignoring interaction between spectral complexes to make computations more tractable. We have now rerun the same configuration expansion for Fe xvii as in OP2005 but now allowing for CI between complexes. We find an increase of 10% in the Rosseland mean opacity for this ion at the plasma conditions of the Sandia experiment.
0 2 4 6 8 10 u =h ν kT −3.5 −3.0 −2.5 −2.0 −1.5 −1.0 −0.5 0.0 0.5 1.0 lo g10 (κ ) (a 2 o) 0 2 4 6 8 10 u =h ν kT −3.5 −3.0 −2.5 −2.0 −1.5 −1.0 −0.5 0.0 0.5 1.0 lo g10 (κ ) (a 2 o)
Figure 2. Left: Effects of collisional broadening. Red curve: no collisional broad-ening. Black curve: OP2005 with collisional broadbroad-ening. Blue curve: Line widths multiplied by a factor of 4.5. Green curve: Line widths multiplied by a factor of 10. Right: Comparison of κPI. Blue curve: OP2005 IC. Red curve: OP2005 IC renor-malized. Black curve: OP2005 LS renorrenor-malized. Green curve: Rerun of inner-shell contributions allowing for CI between complexes (see text for details).
We continued our study by replacing all the OP2005 valence-shell data (i.e., the OP1995 data) in Fe xvii by new AS data with an extended set of configurations that allows for photoexcitation to and photoionization from two-hole L-vacancy states. This leads to a further 8% increase of the Rosseland mean, and if configurations with three-hole L-vacancy states are further taken into account, an overall increase of up to 25% is found relative to OP2005.
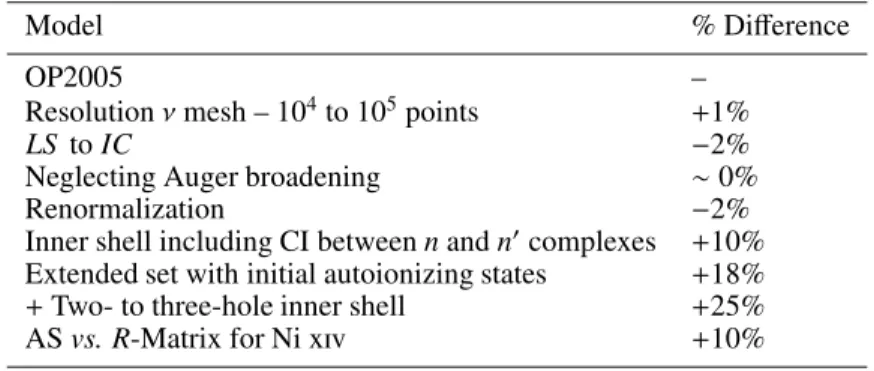
Results are compiled in Table 2. We can see the effects of the three last contribu-tions in Fig. 2. We should keep in mind that the present results are confined to Fe xvii in specific physical conditions, namely, T = 2.1 × 10⁶K and ρ = 3 × 1022cm−3
. Such effects may vary for different temperatures, densities, and ionic species.
Table 2. Effect of extended calculations on the Rosseland mean opacity of Fe xvii (and Ni xiv last entry). See text for details.
Model % Difference
OP2005 –
Resolution ν mesh – 104to 105points +1%
LS to IC −2%
Neglecting Auger broadening ∼0%
Renormalization −2%
Inner shell including CI between n and n′
complexes +10%
Extended set with initial autoionizing states +18%
+Two- to three-hole inner shell +25%
AS vs. R-Matrix for Ni xiv +10%
3.4. Conclusions
We have presented here only preliminary results and extended work is underway, but they are consistent with the TOPAZ and Los Alamos results from Table 1. As for the calculation of raw atomic data, the AS approach is closer to ATOMIC (Colgan et al.
2013a,b, 2015, 2016) and some differences are likely to arise from the different sets of configurations/atomic structures used.
In order to understand the discrepancies between the different calculations, a com-mon set of configurations has been selected as a starting point. We are comparing level populations and ionization fractions in an attempt to constrain them to the same values to test the impact of the EOS on the opacities. Then we will go through each step (atomic data, broadening, etc.) to identify and quantify their effect in terms of monochromatic and mean opacities. A new level-resolved R-Matrix calculation is un-derway to analyse the effect of the coupling scheme and to corroborate the accuracy of the present AS results. A more exhaustive analysis, as well as the study of its impact on stellar models, is under way (Delahaye et al. in preparation).
Acknowledgments. FD would like to thank the AFE-Obs. de Paris for support.
References
Asplund, M., Grevesse, N., & Sauval, A. J. 2005, in Cosmic Abundances as Records of Stellar Evolution and Nucleosynthesis, edited by T. G. Barnes, III, & F. N. Bash, vol. 336 of ASP Conf. Ser., 25
Asplund, M., Grevesse, N., Sauval, A. J., Allende Prieto, C., & Kiselman, D. 2004, A&A, 417, 751
Asplund, M., Grevesse, N., Sauval, & Scott P. 2009, ARA&A, 417, 751 Badnell, N. R. 2011, Comput. Phys. Commun., 182, 1528
Badnell, N. R., Bautista, M. A., Butler, K., et al. 2005, MNRAS, 360, 458 Badnell, N. R., & Seaton, M. J. 2003, J. Phys. B – At. Mol., 36, 4367 Bailey, J. E., Nagayama, T., Loisel, G. P., et al. 2015, Nature, 517, 56
Berrington, K. A., Burke, P. G., Butler, K., et al. 1987, J. Phys. B – At. Mol., 20, 6379
Berrington, K. A., Eissner, W. B., & Norrington, P. H. 1995, Comput. Phys. Commun., 92, 290 Blancard, C., Colgan, J., Cossé, P., et al. 2016, Phys. Rev. Lett., 117, 249501
Blancard, C., Cossé, P., & Faussurier, G. 2012, ApJ, 745, 10
Burke, P. G., Hibbert, A., & Robb, W. D. 1971, J. Phys. B – At. Mol., 4, 153
Colgan, J., Kilcrease, D. P., Magee, N. H., et al. 2013a, High Energ. Dens. Phys., 9, 369 Colgan, J., Kilcrease, D. P., Magee, N. H., Jr., et al. 2013b, in American Institute of Physics
Conference Series, edited by J. D. Gillaspy, W. L. Wiese, & Y. A. Podpaly, vol. 1545 of AIP Conf. Ser., 17
Colgan, J., Kilcrease, D. P., Magee, N. H., et al. 2015, High Energ. Dens. Phys., 14, 33 Colgan, J., Kilcrease, D. P., Magee, N. H., et al. 2016, ApJ, 817, 116
Cox, A. N., & Ellers, D. D. 1960, AJ, 65, 51 Cox, A. N., & Stewart, J. N. 1965, ApJS, 11, 22 — 1970a, ApJS, 19, 243
— 1970b, ApJS, 19, 261
Cox, A. N., & Tabor, J. E. 1976, ApJS, 31, 271
Cunto, W., Mendoza, C., Ochsenbein, F., & Zeippen, C. J. 1993, A&A, 275, L5
Delahaye, F., Dubernet, M. L., Zeippen, C. J., & SUPVAMDC Collaboration 2014, Phys. Scripta, 89, 114005
Delahaye, F., Palmeri, P., Quinet, P., & Zeippen, C. J. 2013, in EAS Publication Series, edited by G. Alecian, Y. Lebreton, O. Richard, & G. Vauclair, vol. 63 of EAS Publ. Ser., 321 Delahaye, F., & Pinsonneault, M. H. 2006, ApJ, 649, 529
Delahaye, F., Zwölf, C. M., Zeippen, C. J., & Mendoza, C. 2016, J. Quant. Spectrosc. Ra., 171, 66
Dubernet, M. L., Antony, B. K., Ba, Y. A., et al. 2016, J. Phys. B – At. Mol., 49, 074003 Eissner W. , Jones M., & Nussbaumer, H. 1974, Comput. Phys. Commun., 8, 270 Fano, H. 1961, Phys. Rev. A, 124, 1866
Hibbert, A. 1975, Comput. Phys. Commun., 9, 141
Hummer, D. G., Berrington, K. A., Eissner, W., et al. 1993, A&A, 279, 298 Iglesias, C. A., & Hansen, S. B. 2017, ApJ, 835, 284
Lynas-Gray, A. E., Seaton, M. J., & Storey, P. J. 1995, J. Phys. B – At. Mol., 28, 2817 Mendoza, C., Seaton, M. J., Buerger, P., et al. 2007, MNRAS, 378, 1031
Mondet, G., Blancard, C., Cossé, P., & Faussurier, G. 2015, ApJS, 220, 2 Nahar, S. N., & Pradhan, A. K. 2016a, Phys. Rev. Lett., 116, 235003 — 2016b, Phys. Rev. Lett., 117, 249502
Nussbaumer, H., & Storey, P. J. 1978, A&A, 64, 139 Rogers, F. J., & Iglesias, C. A. 1992, ApJ, 401, 361
Rogers, F. J., Swenson F. J., & Iglesias, C. A. 1999, ApJ, 456, 902 Seaton, M. J. 1987, J. Phys. B – At. Mol., 20, 6363
— 1995, The Opacity Project (Bristol, UK: IOP Publishing), vol. 1 Seaton, M. J., & Badnell, N. R. 2004, MNRAS, 354, 457
Seaton, M. J., Yan, Y., Mihalas, D., & Pradhan, A. K. 1994, MNRAS, 266, 805 Simon, N. R. 1982, ApJ, 260, L87
Turck-Chièze, S. 1998, Space Sci. Rev., 85, 125
Villante, F. L., Serenelli, A. M., Delahaye, F., & Pinsonneault, M. H. 2014, ApJ, 787, 13 Vinyoles, N., Serenelli, A. M., Villante, F. L., et al. 2017, ApJ, 835, 202