This project is funded by the European Union under the 7th Research Framework Programme (theme SSH) Grant agreement nr 290752. The views expressed in this press release do not necessarily reflect the views of the European Commission.
Working Paper n° 59
CHALLENGES AND OPPORTUNITIES FOR
THE VULNERABLE YOUTH IN PERU
Hugo Ñopo, Ana Paula Franco and Mauricio Ibañez
GRADE
CHALLENGES AND OPPORTUNITIES FOR THE
VULNERABLE YOUTH IN PERU
July 2017
Hugo Ñopo, Ana Paula Franco and Mauricio Ibañez.
Group for the Analysis of Development (GRADE). [email protected]
In this working paper, based on a discussion presented at the NOPOOR conference in Santiago, Chile, April 21st, 2017, we document a panorama of the situation of vulnerable youth in Peru. After characterizing the
population and highlighting their main challenges, we explore some avenues for policy options.
Introduction
Peru has experienced a long and sustained period of economic growth during the last decades. As a result, the country’s macroeconomic indicators depict a picture that can be compared to the one of a middle-income country. Many social and development problems in Peru, however, are still in place.
Youth’s employability, especially that of the vulnerable ones (that is, individuals aged between 15 and 24 years old living in poor or extremely poor households), is one of the pending challenges. The good news is that their number has notably dropped. A decade ago one out of two youngsters lived in a household with per-capita income below the poverty line. Nowadays this happens with only one in five. Nonetheless, their employability is still a challenge.
The vulnerable youth in Peru show low labor market participation (with a decreasing tendency), high unemployment (although its tendency is towards a decrease of it), high informality and high incidence of part-time jobs. In turn, the vulnerable youth shows low levels of development of cognitive and socioemotional sills, configuring in this way a vicious circle of maladies.
Youth vulnerability is dropping but problems persist
Because of the sustained economic growth and overall poverty reduction in the country, the number of vulnerable youth in Peru has dropped at an impressive rate. In 2006, the share of vulnerable youth was 48%. In 2015, it reached 20%. It substantially reduced in only one decade. Figure 1 shows the evolution of youth vulnerability during that period. As it can be seen, the reduction on the incidence of youth vulnerability goes hand-in-hand with poverty reduction. Figure 1 48% 40% 35% 31% 28% 25% 23% 22% 20% 20% 49% 42% 37% 34% 31% 28% 26% 24% 23% 22% 0% 10% 20% 30% 40% 50% 60% 2006 2007 2008 2009 2010 2011 2012 2013 2014 2015 Vulnerable Youth Poverty
Perú: Rate of vulnerable youth aged between 15 and 24 years old and poverty rate, 2006-2015
Evidence shows that, even though poverty has diminished, poor individuals have deficient living conditions. Similarly, a reduction in vulnerability rates does not mean that the still vulnerable youth are doing better. As it will be shown, educational and employability problems persist. These issues are especially important for a country aspiring to become a member of the OECD. Beyond economic growth and poverty reduction, development indicators such as labor market outcomes need serious improvements.
Within a context of future economic slowdown, employment outcomes acquire special relevance as households typically get about 80% of their total income from the labor markets. Then, youth employment outcomes become even more relevant as they traditionally perform worse than the adults in the labor markets. And among them, the poor ones worry us more. Why?
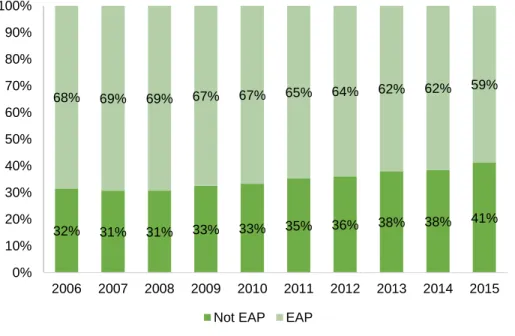
There are mainly two reasons. First, there is lower labor market participation among the youth. In a decade, the share of vulnerable youth who are part of the Economically Active Population (EAP) has fallen by 10 percentage points: from 68% in 2006 to 59% in 2015. This implies fewer youngsters working or looking actively for jobs. Figure 2 shows this trend.
Figure 2 32% 31% 31% 33% 33% 35% 36% 38% 38% 41% 68% 69% 69% 67% 67% 65% 64% 62% 62% 59% 0% 10% 20% 30% 40% 50% 60% 70% 80% 90% 100% 2006 2007 2008 2009 2010 2011 2012 2013 2014 2015 Not EAP EAP
Perú: Rate of vulnerable youth that belongs to the Economically Active Population (EAP), 2006-2015
How are the vulnerable youth doing within the labor market? One typical labor market indicator is the unemployment rate. Figure 3 shows that vulnerable youth are doing better than years ago: the unemployment rate decreased by 4 percentage points during the last decade. In 2015, this rate was 5% and the adults’ rate was 3%. The stylized fact is that youth’s unemployment rate is two times the adults’ unemployment rate. These are encouraging news for Peruvian vulnerable youth. A priori, a conclusion could be that only productive youth remained in the labor market (due to lower EAP). If this were the case, labor market conditions of the employed ones would be decent. Unluckily, this is not the case. And this is the second reason why we are concerned about vulnerable youth: its poor labor market conditions.
Figure 3
Vulnerable youth are, to an important extent, informal and part-time employed. Literature shows that both are indicators of inadequate job conditions. An informal worker is an employee who works in a non-registered firm, in an unpaid familiar position or in a registered firm but does not hold social protection. Informality comes with the cost of social and legal dis-protection. Figure 4 shows that informal work among vulnerable youth accounts for 96% of the workforce in 2015. Almost all vulnerable youth hold jobs with at least one informal characteristic, which implies the abovementioned consequences.
9% 9% 9% 8% 8% 7% 7% 5% 6% 5% 10% 10% 8% 8% 8% 8% 7% 6% 7% 6% 5% 5% 4% 4% 4% 3% 3% 3% 2% 3% 0% 2% 4% 6% 8% 10% 12% 2006 2007 2008 2009 2010 2011 2012 2013 2014 2015 Vulnerable youth Not vulnerable youth Adults
Perú: Unemployment rates by vulnerability and age, 2006-2015
Figure 4
By the International Labour Organization (ILO) convention, a worker is part-time employed when he/she works less than 30 hours per week. Figure 5 shows that part-time jobs have increased by 10 percentage points during the last decade. It should be noted that part-time employment is not per se a bad labor condition. Two main reasons usually drive it: (i) an employee seeking flexibility or (ii) an employer not offering more hours. The first one is more common among developed countries. Peruvian part-time employment is related to the second one which would imply time-related underemployment. A time-related underemployed worker works part-time but wants to do more hours. The consequences are the absence of labor benefits, job polarization and persistence of gender wage gaps (see Goldin 2014 and OECD 2015).
As previously highlighted, the economic growth during the last decade reduced youth vulnerability by 30 percentage points. In 2015, only the 20% of the youngsters were considered vulnerable. Among them, 95% of the workforce is employed. This is good news: the rate is the same as the non-vulnerable youth employment. However, their job conditions are discouraging: informality and part-time employment (with its negative consequences) are the rule. 70% 85% 98% 70% 84% 96% 0% 10% 20% 30% 40% 50% 60% 70% 80% 90% 100%
Adults Not vulnerable youth Vulnerable youth
2012 2015
Perú: Informality rates by vulnerability and age, 2012 and 2015
Figure 1
What challenges do they face?
Why are the vulnerable youth working in poor-quality jobs? Labor market conditions are, to an important extent, the reflection of human capital accumulation. A typical earning (Mincer) equation shows that wages (as proxy of labor outcomes) are determined by: (i) educational attainment and (ii) work experience. Both are the main channels of human capital accumulation.
Thus, poor labor outcomes among vulnerable youth would suggest deficient human capital accumulation. The first main channel to gather human capital is educational attainment. It is considered an easily observable measure of an individual’s skills. Figure 6 shows educational attainment for vulnerable and non-vulnerable youth. Among the former, only 30% reaches at least complete secondary as their highest educational level. The share of university level is even lower: only one out of ten reaches it. Among the latter, 70% reaches at least complete secondary and 35% reaches university level. This is bad news: vulnerable youth have fewer years of education. Not holding a secondary degree probably means that skills required by firms have not been acquired. This supposes a disadvantage for vulnerable youth.
48% 52% 53% 54% 58% 56% 55% 58% 58% 57% 52% 48% 47% 46% 42% 44% 45% 42% 42% 43% 0% 10% 20% 30% 40% 50% 60% 70% 80% 90% 100% 2006 2007 2008 2009 2010 2011 2012 2013 2014 2015
Less than 30h More than 30h
Perú: Distribution of vulnerable youth by hours worked (part-time vs full-time job), 2006-2015
Figure 2
However, educational attainment only translates into labor outcomes if the worker’s skills match the employer’s demands. How developed are vulnerable youth skills? Traditionally, firms have sought cognitive skills such as language proficiency, mathematics and sciences. International standardized tests – such as PISA – point that Peruvian youngsters lack cognitive skills. And these results are even worse for the poor.
Recently, labor markets are increasingly demanding socioemotional skills: teamwork, commitment, grit, agreeableness, and the like. Evidence shows that firms’ demands have changed due to technological improvements. In Peru, the demand for socioemotional skills is higher than the demand for cognitive skills: whereas 35% and 20% of firms demand language and mathematics skills respectively, 35 to 40% of firms demand attitude, commitment and responsibility (World Bank Group 2011). Moreover, the literature has also pointed the relationship between socioemotional skills and labor outcomes (Heckman et al. 200); Cunha and Heckman 2007; Hanushek and Woessmann 2008).
Peruvian youngsters are not doing better in socioemotional than in cognitive skills. Figure 7 shows the gap in socioemotional skills between employees from the richest and poorest SES in Perú. Evidence shows that skills such as openness, extraversion and grit differ greatly among both groups. The gap in extraversion that negatively affects the vulnerable reaches 0.5 standard deviations. 11% 12% 12% 12% 11% 10% 10% 9% 8% 7% 2% 3% 3% 3% 2% 2% 2% 2% 2% 2% 12% 13% 13% 14% 12% 12% 11% 12%11% 11% 3% 3% 3% 3% 3% 3% 3% 3% 3% 3% 39%40% 40% 42% 41% 43% 42% 42% 42% 45% 28% 28% 29% 28% 29% 29% 28% 28% 27% 27% 29% 26% 27%25% 27% 26%28% 28% 29% 27% 37% 36% 35% 35% 34% 35% 34% 34% 34% 34% 8% 8% 8% 7% 8% 8% 9% 10% 10% 10% 30% 31% 30% 31% 30% 31% 33% 34% 34% 35% 0% 10% 20% 30% 40% 50% 60% 70% 80% 90% 100% 2006 2007 2008 2009 2010 2011 2012 2013 2014 2015 2006 2007 2008 2009 2010 2011 2012 2013 2014 2015 Incomplete primary Complete primary Incomplete secondary Complete secondary University/technical
Perú: Distribution of youth by educational attainment and vulnerability, 2006-2015
Source: Enaho
Figure 3
The PISA test, which has become the world’s most important measurement of cognitive skills, also gives some insights regarding socioemotional skills. Borghans and Schils (2012) exploited the design of the test to measure one of these skills: perseverance. They propose that students need both cognitive and socioemotional skills while taking a test. Perseverance and determination do not play an important role at the beginning of it. However, attention diminishes as the test progresses: success ratios to first question are higher than success ratios to last question. The decay between both scores proxies a negative measurement of student’s perseverance. Whereas Nordic and Asian countries do not show pronounced declines, Latin American countries do. Figure 8 shows that Peru holds the bigger gap in Latin America.
-0.3 -0.2 -0.1 0 0.1 0.2 0.3 0.4 0.5 0.6 Responsability Emotional stability Agreeableness (cooperation) Agreeableness (kindness) Grit Openness Extraversion Standard deviations
Perú: Gaps in socioemotional skills between employees from highest and lowest Socioeconomic Status, 2010
Figure 4
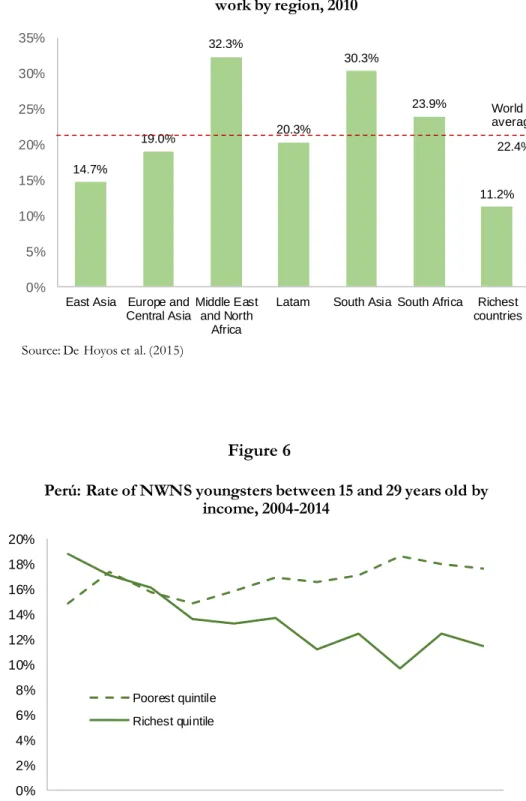
Therefore, regarding the first main channel of human capital, the state of vulnerable youth is discouraging. They do not have the skills required by firms (due to a mismatch) and this translates into poor labor outcomes. The second main channel is job experience. However, data shows the existence of a share of youngsters that are neither studying nor working: the famous No Work No Study (NWNS) group. Figure 9 shows the proportion of NWNS aged between 15 and 24 years old across regions. Latin America is just below the world average. Disaggregated data for Peru evidences different trends by poverty levels. Figure 10 shows that the higher the poverty, the higher the rate of NWNS youngsters. For the poorest quintile, the rate of NWNS youth is, alarmingly, increasing. For the richer quintile, it is decreasing. This could enhance the low employability of vulnerable youth and, in turn, increase labor market disparities. Richer youngsters invest more in human capital while those in unfavorable situations do not. 88% 83% 81% 76% 79% 68% 63% 64% 54% 66% 71% 66% 57% 84% 78% 74% 68% 67% 52% 45% 45% 29% 41% 45% 40% 29% 0% 10% 20% 30% 40% 50% 60% 70% 80% 90% 100%
Finlandia Singapur Korea US Spain Chile Argentina Costa Rica
Peru Mexico Uruguay Brazil Colombia First question Last question PISA: Success rate for first and last question by country, 2012
Figure 5 Figure 6 14.7% 19.0% 32.3% 20.3% 30.3% 23.9% 11.2% 0% 5% 10% 15% 20% 25% 30% 35%
East Asia Europe and Central Asia
Middle East and North
Africa
Latam South Asia South Africa Richest countries
Rate of youngsters between 15 and 24 years old that neither study nor work by region, 2010
Source: De Hoyos et al. (2015)
World average 22.4% 0% 2% 4% 6% 8% 10% 12% 14% 16% 18% 20% 2004 2005 2006 2007 2008 2009 2010 2011 2012 2013 2014 Poorest quintile Richest quintile
Perú: Rate of NWNS youngsters between 15 and 29 years old by income, 2004-2014
By disaggregating data by gender, the scenario is even worse for vulnerable women. Figure 11 shows that the share of NWNS aged between 15 and 29 years old is 30% for women and 15% for men. Whereas one out of four vulnerable young women neither work nor study, only one out of seven vulnerable young men neither work nor study. This is mainly explained by teenage pregnancy. This is probably the main factor that affects women labor supply. In Peru, household work is still largely female. Gender equality within households is still a pending task. Using Brazilian data, Narita (2016) shows the negative relationship between women labor supply and teenage pregnancy.
Figure 7
Figure 12 shows the evolution of teenage pregnancy rates by poverty levels. Teenage pregnancy incidence is higher among poor households: the rate for the poorest quintile is four times higher than the rate for the richest quintile. This result is consistent with Favara et al. (2016). Using the Young Lives dataset, they found that one in every five poor young women have at least one child by the time they are 19. Comparatively, only one in 20 young men is a father by the same age. These disparities are likely to have long run effects on women’s employability. 13% 17% 32% 45% 27% 24% 29% 14% 0% 10% 20% 30% 40% 50% 60% 70% 80% 90% 100% Women Men
Work and study Work and no study No work and study NWNS
Source: Enaho
Perú: Distribution of vulnerable youth by gender and work/study condition, 2015
Figure 8
What can be done?
Due to technological advances, firms are demanding different skills than 20 years ago. The future does look different. The rate at which the demand for skills will change is expected to keep rising. Socioemotional skills are gaining importance and becoming as relevant as cognitive skills for individuals’ success within the labor markets and life.
The skills content of occupations notably varies. Each occupation needs a different set of skills. Figure 13, extracted from (CAF (2015), shows the requirements of cognitive and socioemotional skills across 39 occupations in the main Latin American cities. Each bubble represents an occupation. Its position indicates the relative demand of socioemotional and cognitive skills (they are standardized and centered at zero). The size of the bubble indicates the occupation’s relative size within total employment. The figure serves to deliver two important messages. First, there is a great variance in the requirement of skills across occupations. Second, there is a positive correlation between cognitive and socioemotional skills. Most jobs require both skills, few job require a disproportionate balance of one type of skills over the other.
23% 3% 20% 3% 21% 4% 0% 5% 10% 15% 20% 25%
Poorest quintile Richest quintile 2009 2013 2015
Source: Source: Demographic and Health Surveys (DHS)
Figure 11
The role of the training sector and the educational system can be highlighted here. The development of the relevant skills on the young population is a pending task. The good news is that recent research has shown that these skills are malleable, even beyond the early years. That is, it is never late to work on the development of those skills. The joint venture of the educational system (elementary, high school, vocational and university levels) and training programs will be required for this.
Vulnerable youth’s skills must be improved. However, this will not be a sufficient condition to find a job. An additional challenge for vulnerable youth is their limited access to labor markets networks. Their young condition means they do not have experience and, therefore, references. Their poor condition means they lack access to mentorship during the job search process. Thus, job placement programs and open information flows emerge as crucial instruments to cover part of the existing gaps. As highlighted above, working and studying are the main channels for human capital accumulation. Job placement programs help those with no work experience to find a job and open information platforms help those who lack skills to identify firm’s demands.
Regarding job placement programs, Red CIL PROEmpleo exists since 1996 in Perú. It is a public network that helps improve employability of vulnerable groups (poor youngsters, disabled individuals and elderlies). It works jointly with technical education centers, NGOs,
Latam: Cognitive and socioemotional skills' requirements by occupation, 2015 Source: CAF Socioemotional skills Co gnit ive s k ills Sales, services, individual care Office workers, administratives, operator
Professionals, managers, directors Technology, sciences and engineering professionals
municipalities, churches and institutes. After many years of operation, the network can show successful results: 23642 individuals found a job. They account for the 28% of the enrolled into the network and for the 68% of the offered jobs by firms.
Regarding access to information, “Ponte en Carrera” is an education and employment website for youngsters launched in 2015. It is a public-private initiative. The website presents information about degrees, universities and employability. Similar initiatives launched in Colombia and Chile have been successful and similar results are expected in Perú. The continuous challenge, however, is twofold. On the one hand, it is necessary to assure youngsters actually visit periodically the site. On the other, it is necessary to update the site with information that the targeted population can easily decode.
There is also a role for the demand side within the labor markets, the firms. As much as they identify their needs of qualified human capital, it becomes important to detailly specify the skills they need for the labor force they hire. If the signals about the demand for skills become clearer over time, the training markets and the educational systems will be more able to adapt and react to such demand.
For the information flows to happen it would also be good to count on a platform. In successful experiences across the globe, this has happened with the establishment of a national qualifications framework. Such framework provides a common ground for the dialogue among agents and facilitates coordination and information flows.
Last but certainly not least, if there is a key concept for the success of vulnerable youth’s employability, it is “coordination”. It is necessary to keep an active coordination among all relevant agents (training centers, job intermediators, firms, and the public sector), to early detect markets requirements, new trends, effective interventions and successful experiences. Knowledge diffusion strongly depends on the network connectedness. Here is the main challenge for youth employability.
References
Banco de Desarrollo de América Latina – CAF. (2016). Más habilidades para el trabajo y la vida: los
aportes de la familia, la escuela, el entorno y el mundo laboral
Cunha, F., and Heckman, J. (2007). “The Technology of Skill Formation”. American Economic
Review, 97(2).
De Hoyos, Rafael, Halsey Rogers y Anna Popova. (2015). Out of School and Out of Work: A
Diagnostic of Ninis in Latin America. Washington, D.C: World Bank. Informe previo para el
estudio “Ninis en América Latina.” https://openknowledge .worldbank.org/handle/10986/22349.
Hanushek, E. and Woessmann, L. (2008). "The Role of Cognitive Skills in Economic Development" Journal of Economic Literature, 46(3).
Heckman, J. and Stixrud, J. and Urzua, S. (2006). "The Effects Of Cognitive and Noncognitive Abilities On Labor Market Outcomes and Social Behavior" Journal of Labor Economics, 24(3), 411-482.
Goldin, C. (2014). “An Grand Gender Convergence: Its Last Chapter”. American Economic
Review, 104(4).
Grupo de análisis para el Desarrollo – GRADE. (2005). Las diferencias de género en los mercados de
trabajo peruanos. Boletín n°8.
Narita, Renata, Montoya, María Dolores. (2016). Teenage motherhood, education, and labor market
outcomes of the mother: Evidence from Brazilian data
OECD. (2015). In It Together: Why Less Inequality Benefits All. Paris: OECD Publishing.
Sachs, Jeffrey. (2005). The end of poverty. How we can make it happen in our lifetime. New York, USA: Penguin Press
World Bank Group. (2015). Ninis en América Latina. 20 millones de jóvenes en busca de oportunidades Open Knowledge Repository.
World Bank Group. (2010). Strengthening Skills and Employability in Peru. World Bank Report N°61699
Scientific Coordinator : Xavier Oudin ([email protected]) Project Manager : Delia Visan ([email protected])
Find more on www.nopoor.eu Visit us on Facebook, Twitter and LinkedIn