1
Félix Chénier1,2*, Jean-Philippe Pelland-Leblanc3, Antoine Parrinello1, Etienne Marquis1,2, Denis Rancourt3 1Université du Québec à Montréal, Montreal, Canada
2Centre for Interdisciplinary Research in Rehabilitation of Greater Montreal, Montreal, Canada 3Université de Sherbrooke, Sherbrooke, Canada
*Corresponding author: Félix Chénier, PhD
Professor, UQAM, Department of physical activity science
+1-514-987-3000 ext. 5553
This is the authors’ copy of a manuscript published in Medical Engineering and Physics: https://doi.org/10.1016/j.medengphy.2020.11.008
Abstract
In wheelchair racing, measuring pushrim kinetics such as propulsion forces and moments is paramount for improving performance and preventing injuries. However, there is currently no instrumented racing wheel that records 3D pushrim kinetics wirelessly and at a high sample rate, which is necessary for accurately analyzing wheelchair racing biomechanics. In this work, we present an instrumented wheel that measures 3D kinetics at 2500 Hz. Bidirectional wireless communication is used to interface the wheel through a smart phone. The wheel was tested with a world-class racing athlete who propelled at maximal acceleration and maximal speed on a training roller. During acceleration, the peak total force increased continuously from 186 N to 484 N while the peak tangential force was constant at 171 N ± 15 N. At higher speeds, a counterproductive tangential force was measured during the first 15% and the last 25% of the push phase, peaking at -78 N. This wheel may be of great value for both coaches and athletes to help with planning and validating training programs and adaptations to the wheelchair such as positioning. This wheel also has very high potential for further research on wheelchair racing biomechanics and on preventing shoulder pathologies associated with this sport.
Keywords: Kinetics, Instrumented wheel, Wheelchair Racing, Sensors, Paralympic Sport
A high sample rate, wireless
instrumented wheel for measuring 3D
pushrim kinetics or a racing wheelchair
2
Introduction
Wheelchair racing is a popular adaptive sport that was first studied in the late 1980s, mainly to understand how better kinematics could lead to improved performance [1,2]. Since then, wheelchair racing has undergone drastic changes, with the wheelchair’s design finally taking on its current elongated, three-wheeled shape by the end of the 1990s. Due to major differences in both geometry and speed, wheelchair racing is a unique task that is biomechanically very different from propelling a standard wheelchair. Biomechanical analysis, especially measuring pushrim kinetics, is paramount for improving performance and preventing injuries [3]. For example, performance is related to the amplitude, direction and duration of the pushrim force. Wheelchair racing is also known to cause shoulder overuse injuries [4,5]. Minimizing shoulder moments may be beneficial for wheelchair racers, those moments being correlated with the risk of shoulder pathologies in wheelchair users [6].
Previous studies have calculated shoulder moments during standard wheelchair propulsion using either inverse dynamics [7–10] or musculoskeletal modelling [11–13] but this has not yet been done in wheelchair racing. In fact, these calculations require 3D pushrim kinetics data obtained from instrumented wheels. However, the most prevalent instrumented wheelchair wheels (SmartWheel, OutFront LCC; Optipush, Max Mobility LCC) are only suitable for standard wheelchair propulsion. Yet, kinetics data from racing wheelchairs is vital for determining the musculoskeletal biomechanics underlying performance and athletes’ shoulder pathologies.
Dedicated instrumented wheels are necessary for wheelchair racing for the following main reasons: (1) they usually have a larger diameter than standard wheelchair wheels; (2) their pushrims are smaller in diameter; (3) the duration of the push phase is much shorter, therefore requiring a high sampling rate; (4) force amplitudes and rates of rise are larger; and (5) the hand-wheel contact force area is not only limited to the pushrim, but also to the lateral face of the wheel near the pushrim [14,15].
Various attempts have been made to collect racing wheelchair kinetics data using instrumented wheel prototypes. Goosey-Tolfrey et al. [16] measured 2D hand contact forces using a custom-built instrumented racing wheel for six athletes who propelled at constant speeds of 4.70 m/s and 5.65 m/s on a roller. However, the instrumented wheel could not measure 3D kinetics, which is necessary for conducting inverse dynamics and musculoskeletal modelling. Limroongreungrat et al. [17] built a 3D instrumented racing wheel using a commercial 3D load cell. However, their wheel was tethered to a computer using a slip ring, which prevented kinetics data from being recorded in real-field conditions. In a preliminary work on rigid vs. soft gloves, Rice et al. [18] used a modified SmartWheel to measure the push kinematics of nine racers who propelled at maximal acceleration and three constant speeds of 5.36 m/s, 6.26 m/s and 7.60 m/s on a roller. Their wheel was, however, limited to a sampling frequency of 240 Hz and to our knowledge, no further details were later published on their work. Recently, Miyazaki et al. [19] presented a wireless instrumented pushrim to measure pushrim kinetics on a roller in a wind tunnel facility. That pushrim, tested with three racers who propelled at a constant speed of 5.56 m/s was, however, limited to 2D kinetics (tangential and radial forces).
The aim of our project was to design and build an instrumented racing wheel that addresses the technical limitations encountered with previous designs. The wheel prototype measures 3D forces exerted on the pushrim and the lateral wheel face. Its design is similar to a standard racing wheel in that it can be easily installed on the user's own wheelchair. The wheel is controlled and accessed wirelessly but it does not need
3
to be in the wireless range while acquiring data. Sampled data were recorded and analyzed with a world-class racing athlete for validation purposes.
Wheel design
Mechanical design
A cross-sectional view of the mechanical design of the instrumented wheel is shown in Fig. 1. A design similar to the wheel described in Limroongreungrat et al. [17] was chosen, using the same commercially available six-axis load cell (45E15A, JR3 Inc.). This sensor was proven to give high linearity and low error in racing kinetics measurements [17]. A thin, rigid, carbon fiber layered core cell disc was firmly affixed to the load cell connection; this disc mimicks the lateral face of a standard carbon racing wheel. The pushrim was firmly connected to this disc. Hence, the wheel can measure hand forces exerted either directly on the pushrim and/or anywhere on the disc surface.
Figure 1 Cross-sectional view of the instrumented wheel mechanical sub-assemblies
(a) (b)
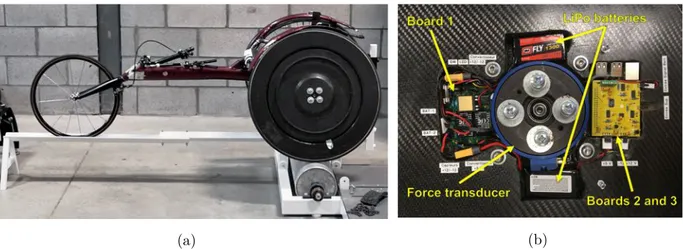
Figure 2 Pictures of the instrumented wheel: (a) installed on a racing wheelchair and training roller; (b)
4
No slip ring or wires were used for data transfer. This therefore required a thicker wheel design to accommodate for electronic circuit boards and batteries. A core cell and carbon construction was used to house these components, ensuring sufficient stiffness to prevent the wheel from contacting the wheelchair structure under the racer’s weight and push forces. A custom axle allowed the wheel bearing to be placed inside the load cell. This allowed the wheel to fit on a normal racing wheelchair without modifying the position of the pushrim relative to the user. The total weight of the wheel is 4.1 kg (for comparison, the weight of a standard disc-shaped wheel is about 1.3 kg). A picture of the instrumented wheel is shown in Fig. 2.
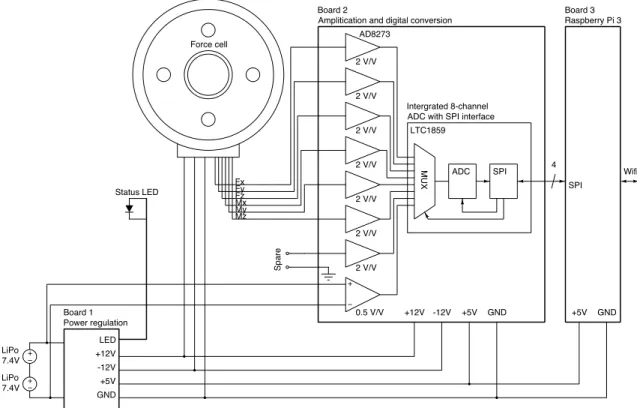
Electronics
Three electronic boards were used as shown in Fig. 3. Board 1 is a power regulation circuit that generates the required stable tension from two 7.4V LiPo batteries. To prevent low voltage, which could damage the batteries, a hardware comparator LED signals low-battery status by blinking for a few minutes, before turning off the electronics completely.
Board 2 is an amplification and digital conversion circuit. The amplification stage amplifies the six analog inputs with a very low gain error of 0.05% and a maximal distortion of 0.00025% (AD8273, Analog Devices). This stage also includes a differential amplifier to monitor the battery voltage via software. Amplifier outputs are routed to an 8-channel, 16-bit analog-to-digital converter (ADC) with a serial peripheral interface (SPI), which has a very low integral non-linearity of ±3 LSB (LTC1859, Linear Technology). Board 3 is an off-the-shelf Raspberry Pi 3 computer that is stacked under board 2. The Raspberry Pi 3 controls the ADC via SPI and communicates via Wi-Fi.
Figure 3 Instrumented wheel electronics +
MUX ADC SPI
ADC with SPI interface Amplitication and digital conversion
Intergrated 8-channel Raspberry Pi 3 SPI Wifi 4 Board 2 Board 3 Force cell Board 1 Power regulation + + LiPo 7.4V LiPo 7.4V +12V -12V +5V GND Spare Fx Fy Fz Mx My Mz 2 V/V 2 V/V 2 V/V 2 V/V 2 V/V 2 V/V 2 V/V 0.5 V/V +12V -12V +5V GND LTC1859 +5V GND LED Status LED AD8273
5
Firmware
The only programmable circuit is the Raspberry Pi 3 computer. The wheel uses a stock Raspbian distribution where all graphical applications and unused servers were removed to save solid state drive (SSD) space, CPU cycles and memory. The network interface automatically connects to a standard router when available. The wheel runs its own Apache web server, which allows interfacing via a web browser. Since the control interface is simple and adapts to the screen, data acquisitions can be started and reviewed with a portable device such as a smart phone. Once acquisition is started, data is continuously written onto the onboard SSD instead of being streamed, which allows the racer to leave the Wi-Fi range without losing data.
Both data acquisition and control interfacing are achieved using Python scripts. When recording, each ADC input is time-multiplexed at the maximal speed allowed by the ADC and SSD. After each complete pass of every input signal, the ADC values are appended to a tab-delimited text file. To account for the non-constant sampling rate due to the non-real-time Linux system used on the Raspberry Pi, a time stamp is also recorded with each sample. Based on different acquisitions, the time difference between two samples was found to be 398 μs ± 46 μs, which corresponds to an approximative sampling frequency of 2500 Hz. For comparison purposes, the sampling rate of the most prevalent instrumented wheel for standard wheelchairs (SmartWheel) is 240 Hz.
Calibration
The low gain error and high linearity of the analog components of board 2 allows voltage values to be converted into measured forces and moments using the certified calibration matrix of the force sensor, without requiring additional calibration. This has the advantage of accounting for channel crosstalk due to strain gauge alignment error, which is difficult to model without proper calibration equipment. Validation of the complete acquisition chain was conducted to detect scaling errors, by applying known forces on the pushrim in different positions and verifying the resulting forces and moments.
Calibration of the software battery indicator and evaluation of the maximal recording time was achieved by starting a long acquisition stream with new, freshly charged batteries with a capacity of 1300 mAh. The total recording time period was 1 hr 50 min.
Test experiment
A male, international level, class T54 Paralympic athlete was recruited for a single test experiment. This project was approved by the Ethics Committee of the Université du Québec à Montréal. After reading and signing the information and consent form, the instrumented wheel was affixed to the athlete’s own racing wheelchair on his dominant side. The wheelchair was mounted on a training roller (Revolution Sports, Clarenceville, Qc, Canada) as shown in Fig. 2. No additional inertia or resistance was added to the natural resistance of the wheelchair roller system. After warming up, the athlete was asked to accelerate as fast as possible from rest until maximal speed, and then attempt to maintain maximal speed for at least 15 seconds. The instrumented wheel recorded the pushrim kinetics during the entire testing period, including a five-second period of freewheeling immediately after the athlete stopped propelling. Since the frequency content of wheelchair racing kinetics is still unknown, no resampling or filtering was applied to the recorded data. The kinetics variables defined in Table 1 were measured during each push cycle. Peak values of 𝐹tot, 𝐹rad,
𝐹med and 𝐹tan were then calculated, along with the peak values of −𝐹tan to assess the expected
6
Push detection was based on a double threshold on 𝐹tot with push > 30 N and recovery < 10 N. To separate
the acceleration phase from the steady state phase, wheel speed was measured using reflective tape affixed to the training roller and filmed at 240 fps using a high-speed camera (iPhone SE, Apple). Wheel speed was calculated at each turn of the roller using 𝑣 =)* × -./
01 where 0.1 was the radius of the roller (m) and Δ𝑡 was
the time corresponding to one rotation of the roller (s). Steady state was defined as 10 consecutive pushes after the point in time when the racer reached 90% of his maximal speed.
The noise 𝜖 was calculated from the freewheeling (while no force was actually applied on the disc) and was characterized as the root-mean-square (RMS) values of the signals measured at the hub (𝜖2!, 𝜖2", 𝜖2#, 𝜖3!, 𝜖3", 𝜖3#) and of the signals calculated at the point of force application (𝜖2tot, 𝜖2rad, 𝜖2med, 𝜖2tan).
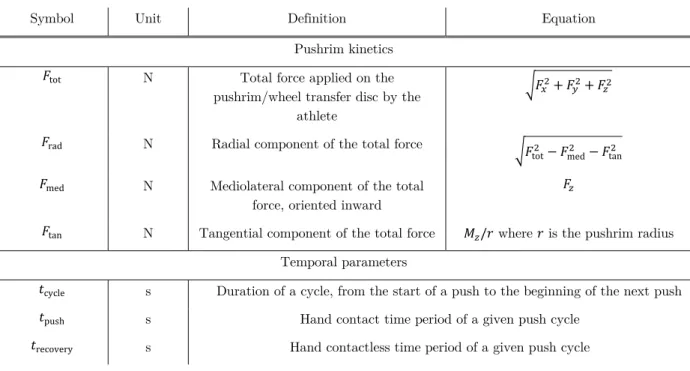
Table 1 Definition of the reported kinetics variables
Symbol Unit Definition Equation
Pushrim kinetics
𝐹tot N Total force applied on the
pushrim/wheel transfer disc by the athlete
"𝐹#$+ 𝐹%$+ 𝐹&$
𝐹rad N Radial component of the total force "𝐹
tot$ − 𝐹med$ − 𝐹tan$
𝐹med N Mediolateral component of the total
force, oriented inward
𝐹&
𝐹tan N Tangential component of the total force 𝑀&/𝑟 where 𝑟 is the pushrim radius
Temporal parameters
𝑡cycle s Duration of a cycle, from the start of a push to the beginning of the next push
𝑡push s Hand contact time period of a given push cycle
𝑡recovery s Hand contactless time period of a given push cycle
All data processing was performed using Python and SciPy (Anaconda Python 3.7). The raw, unprocessed kinetic data are openly available for further processing and interpretation [20].
Results
The athlete reached a maximum speed of 10.05 m/s. The acceleration phase corresponded to push cycles 1 to 16. Therefore, the steady state phase was evaluated from push cycles 17 to 27.
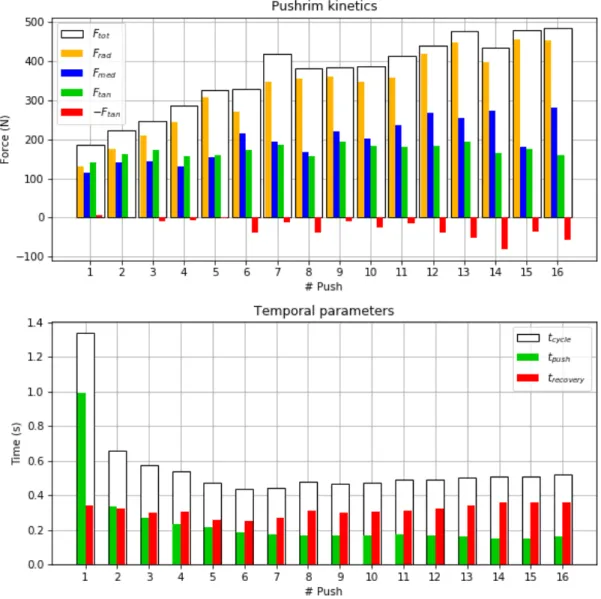
Figure 4 shows the kinetics and temporal parameters for the 16 push cycles of the acceleration phase. Push time decreased with speed from 1.00 s to 0.15 s, which was expected since higher speeds decrease the amount of time available for the hand to contact the pushrim. The recovery time was relatively constant at 0.32 s ± 0.03 s. The cycle time decreased with the push time (from 1.34 s to 0.52 s).
The peak total force 𝐹tot increased continuously from 186 N to 484 N. This increase in total force was not
accompanied by an increase in peak tangential force 𝐹tan, which remained fairly constant at 171 N ± 15 N.
7
and in peak medial force 𝐹med (from 115 N to 281 N). Increasing speed also increased the peak negative
tangential force −𝐹tan, from roughly 0 N to a maximal amplitude of 81 N during push cycle 14.
Figure 4 Pushrim kinetics and temporal parameters during acceleration from 0 m/s to 9.05 m/s
Steady state kinetics and temporal parameters are shown in Table 2. The peak tangential force (142 N) was only 27% of the peak total force (522 N). The push time was very short (0.14 s), which highlights the need for a high sampling rate to evaluate continuous pushrim kinetics during the push phase.
8
Table 2 Kinetics and temporal parameters, mean and standard deviation, at maximal speed (10.05 m/s)
Parameter Mean (SD) 𝐹tot peak (N) 522 (50) 𝐹rad peak (N) 491 (46) 𝐹med peak (N) 227 (46) 𝐹tan peak (N) 142 (16) −𝐹tan peak (N) -78 (21) 𝑡cycle (s) 0.53 (0.02) 𝑡push (s) 0.14 (0.01) 𝑡recovery (s) 0.39 (0.02)
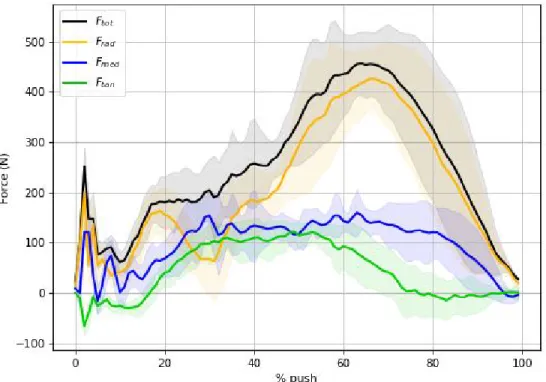
Figure 5 shows the pushrim kinetics at maximal speed, normalized between 0% and 100% of the push phase. Negative tangential forces were measured not only during the first 15% of the push phase, but also (albeit to a lesser extent) during the last 25% of the push phase. This highlights the importance of optimizing the transition phases of hand contact and release. The most mechanically efficient portion of the push was during 30% to 60% of the push phase, which corresponds to a plateau of maximal tangential force.
Figure 5 Pushrim kinetics profile during steady state propulsion at 10.05 m/s, with a push time of 0.14 s
9
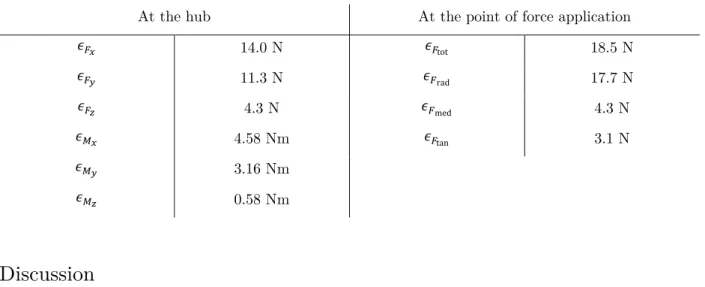
The measurement noise is provided in Table 3. The noisiest variable is 𝐹tot with an RMS error of 18.5 N,
and the least noisy variable is 𝐹tan with an RMS error of 3.1 N.
Table 3 Noise measurement (RMS)
At the hub At the point of force application
𝜖2! 14.0 N 𝜖2tot 18.5 N 𝜖2" 11.3 N 𝜖2rad 17.7 N 𝜖2# 4.3 N 𝜖2med 4.3 N 𝜖3! 4.58 Nm 𝜖2tan 3.1 N 𝜖3" 3.16 Nm 𝜖3# 0.58 Nm
Discussion
Figures 4 and 5 showcase the great potential of the presented instrumented wheel for performance enhancement. As mentioned in the Introduction, performance is affected by the amplitude, direction and duration of the exerted pushrim force. Since the instrumented wheel measures all these variables, it could be of great value for coaches and athletes to help plan and validate training programs, adaptations to the wheelchair or new athlete positioning.
This instrumented wheel also has high potential for research and assistance in injury prevention. Although it is still unclear which of the recommendations for standard wheelchair propulsion [21] are applicable to wheelchair racing, several factors related to musculoskeletal disorders could be monitored using the instrumented wheel, such as total force, rise time of total force and pushing cadence.
In wheelchair propulsion, particularly wheelchair racing, the relatively low mechanical efficiency of the exerted force, expressed as the ratio between 𝐹tan and 𝐹tot, is sometimes explained by the need for frictional
forces to drive the wheels, since the athletes affect the wheels with their gloves without grabbing the pushrims [16]. A certain amount of non-tangential force is thus required to keep the glove from slipping. However, since 𝐹tan did not increase with speed, the increase in 𝐹rad and 𝐹med may not be related to friction.
Instead, we believe these forces increased to maintain the impulse required to accelerate the upper body upward at the end of the push phase. This is consistent with the decreasing push time available to generate this impulse; this also coincides with Fig. 5 where at maximal velocity, the prevalent force 𝐹rad is maximal
towards the end of the push phase, approximately when the hand is at its lowest point. Miyazaki et al. [19] also observed this peak in 𝐹rad at the end of the push phase. This new hypothesis will need to be verified in
subsequent research using the instrumented wheel.
Rice et al. (2015) is the only other study that has measured kinetic and temporal parameters at maximal speed using a modified SmartWheel system. Our peak total force was much higher than theirs, with 𝐹tot of
522 N compared to 272 N. We believe these discrepancies can be explained by the differences between the athletes, but maybe also by the different mechanical designs of the wheels. With the SmartWheel, the forces can only be measured by the pushrim, and not by the wheel itself. Since the SmartWheel's instrumentation
10
housing is prominent and near the pushrim [22], it is possible that some forces may have directly transferred to the wheel without being measured.
Contrary to Goosey-Tolfrey et al. [16], Limroongreungrat et al. [17] and Miyazaki et al.’s [19] works where the athletes propelled at comfortable velocities of about 5 m/s, we chose to record propulsion at maximal acceleration and maximal speed (10 m/s) performed by a world-class athlete. This allowed us to determine the force range and minimal sampling frequency of future prototypes: we now know that an instrumented racing wheel must be able to measure, at the very minimum, 500 N in the wheel’s plane, 250 N perpendicular to the wheel’s plane, and have a sampling frequency that encompasses a very short push phase of 0.14 s. One limitation of our test experiment that is common in every other previous study, is the use of a training roller rather than recording on a real track. A training roller often has lower inertia than the user and wheelchair, which may have reduced the time required to reach maximal speed. Similarly, at high speed, air drag accounts for about half of the overall drag [23]; yet air drag is not simulated on a training roller. This could explain why Rice et al. [18] did not find differences in pushrim kinetics across three different speeds, and why our measured 𝐹tan of 142 N was similar to the 132 N to 158 N in Goosey-Tolfrey et al. [16],
102 N in Limroongreungrat et al. [17], and 131 N in Miyazaki et al. [19], with all of these studies also being performed on training rollers but at much slower speeds.
Since the instrumented wheel is heavier than a standard wheel by about 2.8 kg, it increases the inertia of the wheelchair and may slightly slow down the athlete during acceleration on track. However, in the current study, this added inertia compensated for the reduced inertia of the roller, which may even be beneficial. In any case, we do not believe the weight of the wheel had a major effect on the athlete’s propulsion. The prototype presented in this paper is unique since it is the first instrumented racing wheel that can measure 3D pushrim kinetics wirelessly without the need for any laboratory equipment other than a router and a smart phone. Notwithstanding this, some aspects will need to be improved with future prototypes.
Mechanical design: With this prototype, we decided to prioritize off-the-shelf components to allow rapid
prototyping, calibration and software development. However, these choices come with drawbacks. Using an off-the-shelf force sensor increases the thickness and weight of the wheel, compared to custom-built sensors. Using custom strain gauge sensors as explored by Miyazaki et al. [19] should be considered with future prototypes.
No components were included in the wheel to measure wheel rotation speed and angular position. Other instrumented wheels such as the SmartWheel use an optical encoder to obtain the angular position of the wheel, and then differentiate this position to obtain wheel velocity [24]. Knowing the wheel’s angle and speed is paramount for analyzing performance and measuring other important biomechanical parameters, such as the push angle. The wheel’s angle is also required to remove noise in the measured forces in the wheel’s plane (𝐹< and 𝐹=), which is caused by the weight of the pushrim disc that is always rotating relative
to the wheel [25]. In the current experiment, this noise was estimated at 11-14 N (RMS). Future prototypes should include instrumentation to measure wheel angle and speed, either in the form of an optical encoder or an inertial measurement unit (IMU).
Electronics: Since the off-the-shelf components used in this prototype (primarily the force sensor and
Raspberry Pi) are not designed to operate using batteries, their power consumption is not optimized. If similar components are to be used in subsequent prototypes, proper battery management should be considered so that the batteries can be quickly changed or charged. As a side impact of power consumption, early experiments enlightened the need for proper heat management, mostly for the Raspberry Pi, which,
11
being encased into the wheel, may become extremely hot when conducting longer data acquisitions. Other alternative devices such as FPGA/Arm development boards may be considered to better manage energy consumption.
Firmware: Opting for a Raspberry Pi allowed us to use a readily available operating system, Wi-Fi module
and web server. This saved considerable development work and therefore proved to be a good choice for our application. Furthermore, although data analysis was performed offline, this analysis was completely automatic and only used open source software (Python/SciPy/Matplotlib) that is readily available on the Raspberry Pi. This means that future firmware iterations may easily and automatically generate graphs such as Figures 4 and 5 and allow for immediate feedback to coaches and athletes.
Conclusion
In this work, we built an instrumented racing wheel to measure forces and moments exerted on both the pushrim and wheel face in three dimensions, wirelessly, at 2500 Hz. The wheel was used to analyze the kinetics and temporal parameters of a world-class racing athlete at maximal acceleration and maximal speed. Acceleration was characterized by a decreasing push time and increasing total, radial, medial and negative tangential forces. During the steady state phase, we measured a peak tangential force of 142 N compared to a peak total force of 522 N. We also measured negative tangential forces during the first 15% and last 25% of the push cycle.
This instrumented wheel has great potential for performance enhancement and could assist coaches and athletes in planning and validating training programs.
Conflicts of interest
There is no conflict of interest in this work.
Funding
This work was funded by the Natural Sciences and Engineering Research Council of Canada (NSERC), The Institut national du sport du Québec (INS) and Excellence Sportive Sherbrooke.
Ethical approval
Ethical Approval was obtained by the Ethics Committee of the Université du Québec à Montréal: Comité institutionnel d’éthique de la recherche avec des êtres humains (CIEREH), Certificate #2659_e_2018
Acknowledgments
The authors want to acknowledge Kim Lefebvre for her involvement in data acquisition.
References
[1] Sanderson DJ, Sommer III HJ. Kinematic features of wheelchair propulsion. J Biomech 1985;18:423– 429.
[2] Ridgway M, Pope C, Wilkerson J. A Kinematic Analysis of 800-Meter Wheelchair-Racing Techniques. Adapt Phys Act Q 1988;5:96–107. https://doi.org/10.1123/apaq.5.2.96.
12
[3] Morriën F, Taylor MJD, Hettinga FJ. Biomechanics in Paralympics: Implications for Performance. Int J Sports Physiol Perform 2016:1–34. https://doi.org/10.1123/ijspp.2016-0199.
[4] Roussot M. Upper limb injuries in athletes participating at the London 2012 Paralympic Games. PhD thesis. University of Cape Town, 2014.
[5] Taylor D, Williams T. Sports injuries in athletes with disabilities: wheelchair racing. Paraplegia 1995;33:296–299. https://doi.org/10.1038/sc.1995.67.
[6] Mercer JL, Boninger ML, Koontz A, Ren D, Dyson-Hudson T, Cooper R. Shoulder joint kinetics and pathology in manual wheelchair users. Clin Biomech 2006;21:781–789. https://doi.org/10.1016/j.clinbiomech.2006.04.010.
[7] Desroches G, Dumas R, Pradon D, Vaslin P, Lepoutre F-X, Chèze L. Upper limb joint dynamics during manual wheelchair propulsion. Clin Biomech 2010;25:299–306.
[8] Dumas R, Aissaoui R, De Guise JA. A 3D generic inverse dynamic method using wrench notation and quaternion algebra. Comput Meth Biomech Biomed Eng 2004;7:159–166.
[9] Gil-Agudo A, Del Ama-Espinosa A, Pérez-Rizo E, Pérez-Nombela S, Crespo-Ruiz B. Shoulder joint kinetics during wheelchair propulsion on a treadmill at two different speeds in spinal cord injury patients. Spinal Cord 2010;48:290–296. https://doi.org/10.1038/sc.2009.126.
[10] Munaretto JM, McNitt-Gray JL, Flashner H, Requejo PS. Simulated effect of reaction force redirection on the upper extremity mechanical demand imposed during manual wheelchair propulsion. Clin Biomech 2012;27:255–262.
[11] Bolsterlee B, Veeger DHEJ, Chadwick EK. Clinical applications of musculoskeletal modelling for the shoulder and upper limb. Med Biol Eng Comput 2013;51:953–963.
[12] Morrow MMB, Kaufman KR, An K-NN. Shoulder model validation and joint contact forces during wheelchair activities. J Biomech 2010;43:2487–2492. https://doi.org/10.1016/j.jbiomech.2010.05.026. [13] Rankin JW, Kwarciak AM, Richter WM, Neptune RR. The influence of wheelchair propulsion
technique on upper extremity muscle demand: A simulation study. Clin Biomech 2012;27:879–86. https://doi.org/10.1016/j.clinbiomech.2012.07.002.
[14] Cooper RA, De Luigi AJ. Adaptive Sports Technology and Biomechanics: Wheelchairs. PM&R 2014;6:S31–9. https://doi.org/10.1016/j.pmrj.2014.05.020.
[15] Vanlandewijck Y, Theisen D, Daly D. Wheelchair propulsion biomechanics: implications for wheelchair sports. Sports Med 2001;31:339–367. https://doi.org/10.2165/00007256-200131050-00005.
[16] Goosey-Tolfrey VL, Fowler NE, Campbell IG, Iwnicki SD. A kinetic analysis of trained wheelchair racers during two speeds of propulsion. Med Eng Phys 2001;23:259–266. https://doi.org/10.1016/S1350-4533(00)00084-9.
[17] Limroongreungrat W, Wang YT, Chang L-S, Geil MD, Johnson JT. An instrumented wheel system for measuring 3-D pushrim kinetics during racing wheelchair propulsion. Res Sports Med 2009;17:182– 194. https://doi.org/10.1080/15438620903120637.
[18] Rice I, Dysterheft J, Bleakney A, Cooper R. The Influence of Glove Type on Simulated Wheelchair Racing Propulsion: A Pilot Study. Int J Sports Med 2015;37:30–5. https://doi.org/10.1055/s-0035-1555926.
[19] Miyazaki Y, Iida K, Nakashima M, Maruyama T, Yamanobe K. Measurement of push-rim forces during racing wheelchair propulsion using a novel attachable force sensor system. Proc Inst Mech Eng Part P J Sports Eng Technol 2020:175433712090426. https://doi.org/10.1177/1754337120904260.
[20] Chénier F. Raw data from A wireless instrumented wheel for measuring 3D pushrim kinetics in wheelchair racing. Mendeley Data 2020;1. http://dx.doi.org/10.17632/mj2xfyprtt.1.
13
[21] Consortium for Spinal Cord Medicine. Preservation of upper limb function following spinal cord injury: a clinical practice guideline for health-care professionals. J Spinal Cord Med 2005;28:434–470. [22] Rice I. Recent Salient Literature Pertaining to the Use of Technology in Wheelchair Sports. Curr Phys
Med Rehabil Rep 2016;4:329–35. https://doi.org/10.1007/s40141-016-0141-6.
[23] Barbosa TM, Coelho E. Monitoring the biomechanics of a wheelchair sprinter racing the 100 m final at the 2016 Paralympic Games. Eur J Phys 2017;38:044001. https://doi.org/10.1088/1361-6404/aa6905. [24] Asato KT, Cooper RA, Robertson RN, Ster JF. SMART Wheels: development and testing of a system for measuring manual wheelchair propulsion dynamics. IEEE Trans Biomed Eng 1993;40:1320–1324. [25] Chénier F, Aissaoui R, Gauthier C, Gagnon DH. Wheelchair pushrim kinetics measurement: A method to cancel inaccuracies due to pushrim weight and wheel camber. Med Eng Phys 2017;40:75–86. https://doi.org/10.1016/j.medengphy.2016.12.002.