for the transition toward resilient communities
input 2016
9th international Conference
on innovation in urban
and Regional planning
e-agorà|e-aγορά
9th International Conference on Innovation in Urban and Regional Planning
e-agorà/e-ἀγορά for the transition toward resilient communities
Conference Proceedings Book
ISBN 978-88-9052-964-1Conference Proceedings from the INPUT2016 Conference in Turin (14th–15th September 2016)
Edited by Giovanni Colombo (ISMB Istituto Superiore Mario Boella), Patrizia Lombardi (DIST - Politecnico di Torino), Giulio Mondini (SiTI Higher Institute on Territorial Systems for Innovation)
Editorial coordination by Stefania Mauro Graphic design by Sara Oggero (ISMB) ISBN 978-88-9052-964-1
INPUT2016 SCIENTIFIC COMMITTEE Ivan Blecic, University of Cagliari Dino Borri, Polytechnic University of Bari Grazia Brunetta, Politecnico di Torino
Edoardo Calia, ISMB Istituto Superiore Mario Boella Domenico Camarda, Polytechnic University of Bari Michele Campagna, University of Cagliari Alessandra Casu, University of Sassari Arnaldo Cecchini, University of Sassari
Giovanni Colombo, ISMB Istituto Superiore Mario Boella Grazia Concilio, Polytechnic University of Milan Tanja Congiu, University of Sassari
Valerio Cutini, University of Pisa Andrea De Montis, University of Sassari Giovanna Fancello, Paris-Dauphine University Romano Fistola, University of Sannio Sabrina Lai, University of Cagliari
Giuseppe Las Casas, University of Basilicata Federica Leone, University of Cagliari
Sara Levi Sacerdotti, SiTI Higher Institute on Territorial Systems for Innovation
Patrizia Lombardi, Politecnico di Torino
Giampiero Lombardini, Università degli Studi di Genova Enrico Macii, Politecnico di Torino
Fabio Manfredini, Polytechnic University of Milan
Stefania Mauro, SiTI Higher Institute on Territorial Systems for Innovation
Giulio Mondini, SiTI Higher Institute on Territorial Systems for Innovation
Eugenio Morello, Polytechnic University of Milan Beniamino Murgante, University of Basilicata Silvie Occelli, IRES Piemonte
Andrea Pacifici, ISMB Istituto Superiore Mario Boella Rocco Papa, University of Naples “Federico II” Paola Pittaluga, University of Sassari Alessandro Plaisant, University of Sassari Giovanni Rabino, Polytechnic University of Milan Bernardino Romano, Università degli Studi dell'Aquila Marco Santangelo, Politecnico di Torino
Francesco Scorza, University of Basilicata
Matteo Tabasso, SiTI Higher Institute on Territorial Systems for Innovation
Valentina Talu, University of Sassari Andrea Trunfio, University of Sassari
Andrea Vesco, ISMB Istituto Superiore Mario Boella Angioletta Voghera, Politecnico di Torino
Corrado Zoppi, University of Cagliari INPUT2016 CONFERENCE COMMITTEE
Arnaldo Cecchini, University of Sassari Dino Borri, Polytechnic University of Bari Valerio Cutini, University of Pisa Alessandro Plaisant, University of Sassari Giovanni Rabino, Polytechnic University of Milan Giuseppe Las Casas, University of Basilicata Michele Campagna, University of Cagliari Andrea De Montis, University of Sassari Corrado Zoppi, University of Cagliari Romano Fistola, University of Sannio Rocco Papa, University of Naples “Federico II” Patrizia Lombardi, Politecnico di Torino
Giovanni Colombo, ISMB Istituto Superiore Mario Boella
Giulio Mondini, SiTI Higher Institute on Territorial Systems for Innovation
INPUT2016 ORGANISING COMMITTEE
Cristiana D'Alberto, ISMB Istituto Superiore Mario Boella
Maria Cristina Longo, SiTI Higher Institute on Territorial Systems for Innovation
Stefania Mauro, SiTI Higher Institute on Territorial Systems for Innovation
Luisa Montobbio, Politecnico di Torino Cinzia Pagano, Politecnico di Torino
3
Table of Content
INPUT 2016 is the ninth meeting with the name INPUT ... 10
Arnaldo CecchiniINPUT 2016 “e-agorà/e-ἀγορά for the transition toward resilient communities” 11
Giovanni ColomboSTeHeC - Smart Territories and Healthy Cities ... 12
The role of urban cyclability in promoting public health ... 13 Stefano Capolongo, Lorenzo Boati, Maddalena Buffoli, Marco Gola, Alessandra Oppio and Andrea RebecchiSocial inclusion and use of equipped public space for physical activity. Analysis and promotion prospects ... 19 Rossella Maspoli
Beyond geospatial visualisation: maps for health research ... 25 Enrico Cicalò
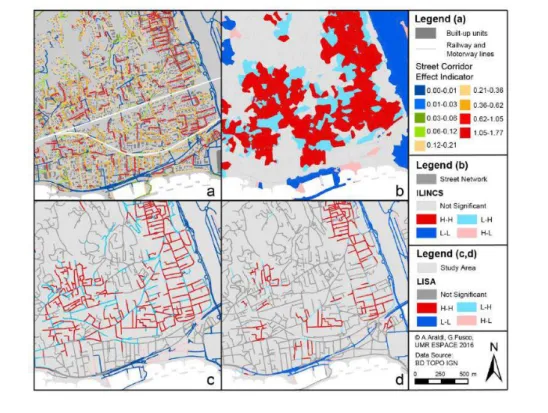
Urban Form from the Pedestrian Point of View: Spatial Patterns on a Street Network ... 32 Alessandro Araldi and Giovanni Fusco
3D Modelling from Urban Environment to Internal Management of Buildings ... 39 Maurizio Minchilli, Elena Carta, Barbora Slabeciusová and Loredana Tedeschi
Appropriate Technologies and Deprived Neighbourhoods: Making Technologies Work for
Inclusive Urban Development ... 46 Arnaldo Cecchini, Valentina Talu and Andrea Vesco
Planning, managing and empowering while pursuing change: integrating community map-making and geographic information technologies ... 52 Barbara Dovarch
Flexible Design to Territory Smart User-Centered ... 60 Cristiana Cellucci and Daniela Ladiana
Integrated Accessibility: a Macro-Requirement for the Healthy City ... 65 Filippo Angelucci and Michele Di Sivo
Environment – Cities – Users: a multidisciplinary approach for the quality of urban spaces ... 71 Angela Giovanna Leuzzi, Roberta Cocci Grifoni, Maria Federica Ottone and Enrico Prenna
Walk, See, Know: Modelling Landscape Accessibilities ... 77 Enrico Cicalò, Arnaldo Cecchini, Nada Beretic, Roberto Busonera, Dario Canu and Andrea Causin
Recording, management and returning of data for improving accessibility of public spaces by involving users ... 83 Ilaria Garofolo, Elisabeth Antonaglia and Barbara Chiarelli
Multilevel Infrastructures ... 89 Claudia Di Girolamo
The built environment as a determinant of the public health. An epidemiological survey of the walking behavior in Sardinia ... 93
4
Marco Dettori, Andrea Piana and Paolo CastigliaShaping urban pedestrian mobility involving users: the Labac case study ... 98 Barbara Chiarelli, Silvia Grion and Ilaria Garofolo
Spatial image of territories. The case study of Sardinia ... 102 Miriam Mastinu
An Empirical Study on Factors of Perceived Walkability ... 108 Ivan Blečić, Dario Canu, Arnaldo Cecchini, Tanja Congiu, Giovanna Fancello and Giuseppe Andrea Trunfio
GPS Traking and Surveys Analysis of Tourists' Spatio-Temporal Behaviour. The case of Alghero.
... 114
Ivan Blečić, Dario Canu , Arnaldo Cecchini, Tanja Congiu, Giovanna Fancello and Giuseppe Andrea TrunfioTriggers of urban innovation. The Case of Cavallerizza Reale in Turin ... 121 Roberta Guido
No more build, but regenerate and reuse
... 128
Cristiana Cellucci and Daniela LadianaA Reflection on Smart Governance in the new Metropolitan City of Cagliari ... 135 Chiara Garau, Ginevra Balletto and Paola Zamperlin
R&S.U.E Resilient & Safe Urban Environment ... 143 Ester Zazzero
Planning for S.M.A.R.T. (Specific, Measurable, Achievable, Resilient, Time-bound) development: a bottom up approach to lead knowledge-based tourism development in low density rural districts
... 151
Tanja Congiu, Maurizio Napolitano and Alessandro PlaisantUrban intersections effect on pedestrian accessibility ... 157 Ivan Blečić, Arnaldo Cecchini, Tanja Congiu, Dario Canu and Giovanna Fancello
Built environment and health inequalities: results from a European research project and
overview of methods for assessing health impacts in urban areas ... 164 Enrico Eynard, Giulia Melis and Matteo Tabasso
ESSP - Ecosystem Services and Spatial Planning ... 170
Graph Representations of Site and Species Relations in Ecological Complex Networks ... 171 Gianni Fenu and Pier Luigi PauConflictual issues concerning land uses related to ecosystem services under the provisions of the Habitats and Birds Directives ... 177 Federica Leone and Corrado Zoppi
Assessment: land use and capacities to provide ecosystem service. The case study of Tertenia .. 184 Maddalena Floris
The Natura 2000 Network in the context of the Metropolitan City of Cagliari: an example of Habitat Suitability Approach (part one) ... 190 Daniela Ruggeri and Ignazio Cannas
5
The Natura 2000 Network in the context of the Metropolitan City of Cagliari: an example of Habitat Suitability Approach (part two, continued from part one) ... 196 Ignazio Cannas and Daniela Ruggeri
Ecosystem services within the appropriate assessment of land-use plans: exploring a potential integration ... 202 Sabrina Lai
Courtyards, Climate regulation services and Nature-based solutions: a modelling approach to support urban regeneration of empty spaces ... 208 Raffaele Pelorosso, Federica Gobattonia, Francesca Calace and Antonio Leone
TSC - Towards the Smart City ... 213
A critical review of parameters within urban sustainability models: how much do soil and natural resources weight? ... 214 Floriana ZucaroThe building aspect ratio for an energy efficient green network design ... 220 Carmela Gargiulo and Andrea Tulisi
Energy efficiency measures for building and their impact on the grid in a Middle East case study
... 226
Paolo Lazzeroni, Sergio Olivero, Federico Stirano, Guido Zanzottera, Carlo Micono, Piercarlo Montaldo and Umberto Fabio CalìEnergy consumption in hospitals: towards a new benchmark ... 231 Romano Fistola and Marco Raimondo
Urban Environmental Quality and Sustainability: a proposal for an evaluation method of
Neighborhood Sustainable Assessment tools ... 238 Rocco Papa, Chiara Lombardi and Maria Rosa Tremiterra
DIPENDE – a tool for energy planning of building districts based on energy performance
certification data ... 245 Ezilda Costanzo, Bruno Baldissara and Marco Rao
Energy Efficiency and Participation: a double smart approach in LEO project ... 251 Cristina Marietta, Giulia Melis and Maurizio Fantino
Identify the sustainable level of local plans and urban sectors. Proposal for an operational
procedure ... 258 Giuseppe Mazzeo
Key Messages: a decision support system based on the integration between city and mobility . 264 Carmela Gargiulo and Maria Rosa Tremiterra
Accessibility and built environment surrounding metro stations: a GIS-based comparison of Naples line 1, Milan line 3 and London Jubilee line ... 269 Rocco Papaa, Gerardo Carpentieria and Gennaro Angiello
A GIS-based and socially participative procedure for the location of high vulnerability territorial functions ... 275 Romano Fistola and Rosa Anna La Rocca
6
Modelling and Assessing Pedestrian Isochrones around Public Transport Nodes: a
People-Centred Perspective towards Smartness ... 281 Silvia Rossetti, Michela Tiboni and David Vetturi
Households’ willingness to pay in good and bad economy. The case study of Naples ... 287 Carmela Gargiulo, Simona Panaro and Laura Russo
SMGI - Social Media Geographic Information and collaborative mapping: exploring
new trends in spatial analysis ... 294
Social Media Geographic Information Visual Analytics ... 295 Junia Borges, Ana Clara Moura, Priscila de Paula and Pedro CasagrandeBeyond social networks contents: how Social Media Geographic Information may support spatial planning analysis ... 300 Pierangelo Massa, Roberta Floris and Michele Campagna
Social Media Geographic Information for urban space analysis: the case of Expo Milano 2015 . 307 Raffaele Gallo, Michele Campagna, Pierangelo Massa and Giovanni Rabino
The use of SMGI in supporting tourism planning practices: an innovative approach for the
municipality of Cagliari ... 313 Roberta Floris, Pierangelo Massa and Michele Campagna
Real society in virtual space: a new platform to share responsibilities ... 319 Lucia Lupi, Alessio Antonini, Guido Boella and Eloheh Mason
Online tools for public engagement: case studies from Reykjavik ... 325 Iva Bojic, Giulia Marra and Vera Naydenova
Comparing Traditional Maps with Twitter-Derived Maps: Exploring Differences and Similarities
... 331
Stefano Pensa and Elena MasalaMapping the food system in Turin ... 337 Luca Davico, Marina Bravi, Egidio Dansero, Gabriele Garnero, Paola Guerreschi, Federico Listello, Giacomo Pettenati, Paolo Tamborrin and Alessia Toldo
Crowdmap applied to Geoturism: Case Study of Chapada Diamantina BA - Brazil ... 344 Pedro B. Casagrande , Nicole Rocha, Priscila Lisboa and Ana Clara Mourão Moura
MiraMap: an e-participation tool for Smart Peripheries ... 350 Francesca De Filippi, Cristina Coscia, Guido Boella, Alessio Antonini, Alessia Calafiore, Anna Cantini, Roberta Guido, Carlo Salaroglio, Luigi Sanasi and Claudio Schifanella
Production of spatial representations through collaborative mapping. An experiment ... 356 Angioletta Voghera, Rossella Crivello, Liliana Ardissono, Maurizio Lucenteforte, Adriano Savoca and Luigi La Riccia
UFePC - Urban Form and Perception of the City ... 362
THE FRIENDLY CITY [LA CIUDAD AMABLE]. Andalusian Public Space Programme Awareness raising, training and interventions regarding cities, public space and sustainable mobility ... 3637
Gaia RedaelliSpace Syntax applied to the city of Milan ... 370 Valerio Cutini, Denise Farese and Giovanni Rabino
Configurational Approaches to Urban Form: Empirical Test on the City of Nice (France) ... 376 Giovanni Fusco and Michele Tirico
Physical factors affecting the citizens’ security feeling in communal spaces (case study:
BandarAbbas city) ... 383 Ali Shahdadi and Marziyeh Rezanejad
Conurbations and resilience. When growth makes us fragile ... 389 Valerio Cutini
IMPC – ICT Models: Planning for inclusive Communities ... 395
Virtual Environments as a Technological Interface between Cultural Heritage and theSustainable Development of the City ... 396 Georgios Artopoulos
Visualisation Tools in Grasshopper+Rhino3D to Improve Multi-Criteria Analysis in Urban Policies – Case Study of Pampulha, Brazil ... 404 Ana Clara Mourão Moura, Suellen R. Ribeiro, Diogo C. Gualdalupe and Silvio R. Motta
Studies of Volumetric Potential in Pampulha, Brazil ... 411 Suellen R. Ribeiro and Ana Clara Mourão Moura
When the parametric modeling reveals a collapse in the future urban landscape: The case of Divinópolis – Minas Gerais/Brazil ... 418 Diogo de Castro Guadalupe, Bruno Amaral de Andrade and Ana Clara Mourão Moura
A Spatial Decision Support System for Industrial Re-Use ... 424 Alessia Movia and Maria Vittoria Santi
How knowledge subjectivity affects decision-making: a Geodesign case study for the Cagliari Metro Area ... 429 Elisabetta Anna Di Cesare, Roberta Floris and Michele Campagna
Knowledge Organization for Community Revitalization: An Ontological Approach in Taranto Industrial City ... 436 Rossella Stufano, Dino Borri, Domenico Camarda and Stefano Borgo
Integrating VGI system in a Participatory Design Framework ... 441 Alessia Calafiore, Junia Borges, Ana Clara Mourão Moura and Guido Boella
Evaluation of social benefits generated by urban regeneration: a stated preference approach 447 Marta Bottero and Giulio Mondini
URTL - Urban-Rural Transitional Landscapes ... 453
Urban-rural-natural gradient analysis using CORINE data: an application to the Italian regions of Friuli Venezia Giulia, Umbria, and Calabria ... 4548
Marco Vizzari, Sara Antognelli, Maurizia Sigura and Giuseppe ModicaLiveability services in transitional landscapes: a spatial-MCDA model for assessment and
mapping ... 461 Sara Antognelli and Marco Vizzari
Big data and environmental management: the perspectives of the Regional Environmental Information System of Sardinia, Italy ... 468 Andrea De Montis, Sabrina Lai, Nicoletta Sannio and Gianluca Cocco
Quantifying transport infrastructures and settlement fragmentation: strategic measures for rural landscape planning ... 474 Andrea De Montis, Antonio Ledda, Vittorio Serra and Mario Barra
Multi-temporal satellite imagery for soil sealing detection and urban growth mapping in the city of Ranchi (India) ... 480 Andrea Lessio, Vanina Fissore, Barbara Drusia and Enrico Borgogno-Mondino
Temporal variation of ecological network’s structure: some insights on the role of Natura 2000 sites ... 486 Giuseppe Modica, Luigi Laudaria, Andrea De Montis, Simone Caschili, Maurizio Mulas, Amedeo Ganciu, Leonarda Dessena and Carmelo Riccardo Fichera
Reducing land take and preserving land quality. A methodology for the application of the
Lombardy Regional Law ... 493 Raffaele Sigon and Giulio Senes
GIS advanced tools for urban growth reading and management for best practices in
town-planning ... 498 Enrico Borgogno-Mondino and Barbara Drusi
The bioremediation of polluted areas as an opportunity to improve ecosystem services ... 505 Lorenzo Boccia, Alessandra Capolupo, Elena Cervelli, Stefania Pindozzi, Marina Rigillo and Maria Nicolina Ripa Landscape Bionomics: A Comparison Between Two Rural-Suburban Landscapes from Brussels and Milan ... 512 Vittorio Ingegnoli, Ernesto Marcheggiani, Hubert Gulinck, Fredrik Larouge and Andrea Galli
Mapping Cilento: Visual analysis of geotagged Twitter data to study touristic flows in southern Italy ... 519 Ernesto Marcheggiani, Alvin Chuac, Loris Servillo and Andrew Vande Moere
Association between a spectral index and a landscape index for mapping and analysis of urban vegetation cover ... 526 Nicole A. da Rocha, Ítalo S. Sena, Bráulio M. Fonseca and Ana Clara Mourão Moura
MMSD - Methods and Models for Sustainable Development ... 532
Mobility Flow Estimates at Sub-Regional level: an Application to Piedmont ... 533 Simone Landini, Sylvie OccelliA parametric method to analyze and enhance the cultural heritage and its context ... 538 Roberto De Lotto, Veronica Gazzola, Cecilia Morelli di Popolo and Elisabetta Maria Venco
9
Akiko Kondo and Akio KondoA toolkit for sustainable development planning: the Val D’Agri case study ... 551 Giuseppe Las Casas and Francesco Scorza
Indicators of resilience for Strategic Environmental Assessement ... 557 Giampiero Lombardini
Scenarios’ evaluation of territorial transformation in the province of Belluno through the
application of the AHP methodology ... 563 Giovanni Campeol, Fabio De Felice, Nicola Masotto, Antonella Petrillo and Giuseppe Stellin
10
INPUT 2016 is the ninth meeting with the name “INPUT”
A biennial appointment that started in 1999 in Venice at the IUAV.We had two shifts in the conference, one in date: 2005 (Alghero) was followed by 2008 (Lecco), to avoid overlapping with the CUPUM conference (Computers in Urban Planning and Urban Mangament); and one in name: the acronym INPUT at the beginning stood for INformatica e Pianificazione Urbana e Territoriale and now it’s Innovazione e Pianificazione Urbana e Territoriale.
I have been one of the organizer of the first meeting and I’m very proud of the results the initial intuition has yielded through the organization of this long series of conferences.
In 9 conferences all across the country (Venezia, Isole Tremiti, Pisa, Alghero, Lecco, Potenza Cagliari, Napoli, and now Torino) hundreds of experts and users had the opportunity to share ideas, experiences, tools and projects; people from academic world (among them: urban planners, architects, engineers, computer scientists, sociologists), public administration, and industry (from small start-ups to big enterprises) have had the opportunity to explore and measure the relevance of the ICT for the new ways to think and practice planning and design. Now we have to face new challenges and maybe rethink the formula of the conference.
We know we were right because nowadays one of the most common sense and mainstream expression is “smart city” (personally I’m not fond of this expression, but it is a fact that this is an expression widely used); we know we have to change exactly for the same reason: we need to avoid the abuse of that expression that can lead to an overly technocratic approach often imbued with ideology; as usual we need to make use of the best available technologies, but having an idea of the purpose of planning, a shared vision of the future.
For this reason I am wondering if this occasion could be the moment for a step forward: from the birth of an Association, to the organisation of a seminar for young researchers and professionals (one year the biennial conference, the next year the seminar), to the opening of the conference to other disciplines (history, restoration, archaeology, …).
The Torino conference could be the right occasion for this shift of perspective: among its organisers, in addition to the Interuniversity Department of Regional and Urban Studies and Planning of the Politecnico di Torino and Università di Torino (DIST), there are two research institutes: Istituto Superiore on Territorial Systems for Innovation (SiTI) and Istituto Superiore Mario Boella on the Information and Communication Technologies (ISBM); so that research, education, applications and projects are all brought together through the experiences of the organizing institutions: a good viaticum for the future course of INPUT.
11
INPUT 2016 “e-agorà/e-ἀγορά for the transition toward resilient communities”
It is universally recognised that the Smart City perspective raises a wide spectrum of unexplored and interdependent problems and extends the horizon over which the City growth strategies are defined. Energy generation and consumption models, urban mobility schemes, service processes, goods production mechanisms, citizens’ behaviour and community habits are all aspects radically challenged by this perspective. These are sufficient circumstances to affirm that the smart and sustainable perspective of our cities is fully inscribed in the fundamental questions of our age. And it is exactly the character of these fundamental questions that makes Smart City an unrepeatable occasion for society to challenge on subjects of technical, economical, territorial and societal nature that need to be stimulated jointly if the essential aim of Smart City is really the good life for society. In this framework, it is fundamental that the technical discontinuities are responsive ahead of the unprecedented needs of a sustainable development and the financial system is flexible enough to support the new kinds of infrastructural solutions. The territorial and urban disciplines are singled out to elaborate innovative concepts enabling the completely renewed City processes to take place. The public administration systems must guarantee effective measures and incentives to facilitate the inevitable transformations. The societal bodies must play an essential role in increasing the level of consciousness and participation of the citizens in defining and verifying the suitability of the new social processes.All these aspects are covered in our Input Conference, where a wide spectrum of scientific thoughts and sensibilities are brought together with the aim of creating a common and challenging perspective: an intelligent, sustainable and inclusive City as a fundamental contribution to the environmental health and the social wellbeing.
12
13
The role of urban cyclability in promoting Public Health
Stefano Capolongoa, Lorenzo Boatia, Maddalena Buffolia, Marco Golaa, Alessandra Oppiob and
Andrea Rebecchia
a Department of Architecture, Built environment and Construction engineering (ABC) Politecnico
di Milano, Milano, Italy ([email protected], [email protected], [email protected], [email protected], [email protected])
b Dipartimento di Architettura e Studi Urbani (DAStU) Politecnico di Milano, Milano, Italy
Key-words: Cyclability; Evidence Based Public Health (EBPH); Health Promotion; Healthier Cities; Physical Activity.
Introduction
The state of a citizen’s health is influenced by three different factors: environmental, behavioural and genetic ones (Gebel et Al, 2005); architects and planners could significantly improve the first two issues. In recent years, it increased the awareness that urban plan design and initiatives can have positive and negative influences on the urban conditions in which people live and work (Capolongo, Battistella, Buffoli and Oppio, 2011). Air quality, equity, services, green areas and accessibility depend on the authority and planners' decisions. To create healthier cities, planners have to focus on the physical and social environment aspects to improve people's lifestyles. Cities are complex entities and urban health needs a multi-sector approach (Fehr, Capolongo, 2016).
Topics concerning the health status of citizens have always inspired and stimulated the technological innovation of processes on different levels: territorial and urban development projects as well as architectural and interior design (Signorelli, Capolongo, Buffoli, Capasso, Faggioli, Moscato, Oberti, Petronio, and D’Alessandro, 2016). A consolidation process of the role of architects and planners as promoters of public health is ongoing (Capolongo, Buffoli and Oppio, 2015). Even if urban residents have better health conditions than those in rural
settings, cities are cause of social inequity for reasons related to the social context. Changes in lifestyle and diet, together with reduced levels of outdoor Physical Activity (PA) in cities, all contribute to a rise in Non– Communicable Diseases (NCD’s), including obesity, diabetes, and cardiovascular disease. In this context, PA could be encouraged by particular attention to the design of paths and urban spaces. However, in Italy both urban and suburban districts are often characterized by the low quality of public space. Italian regulations are not sufficient to ensure high standards of urban quality of life and unfortunately the urban culture is not oriented towards urban health. This lack is directly reflected on the liveability of contemporary urban centres, that are often not really at human scale, do not promote healthy lifestyles and are characterized by unsustainable social and environmental impacts (Capolongo, Lemaire, Oppio, Buffoli and Roue Le Gall, 2016).
Designing open spaces and urban paths that encourage PA (cycling and safe walking paths, green areas, etc.) means to have direct and indirect effects on people’s health and environmental quality. These benefits have positive economic outcomes, which are too often underestimated by the Public Administration. For this reasons it’s important to start epidemiological
14
researches capable of creating awareness and orienting Governments towards more sustainable choices and quality. In Europe, referring to an higher urban quality, there are many initiatives that are trying to measuring and monitoring the sustainability level of local communities or the PA citizenship’s level through a different set of indicators (D’Alessandro, Buffoli, Capasso, Fara, Rebecchi, and Capolongo 2015). However, few of these measurements specifically study the relationship between urban design, lifestyle and health outcomes.Daily physical activity and health
PA is considered a key protective factor against many diseases: a sedentary lifestyle is in fact the fourth cause of death in the world, among those related to non-communicable chronic diseases, involving the majority of deaths worldwide (92% in Italy). The main diseases that could be reduced through increased PA are cardiovascular and respiratory diseases, obesity, diabetes and depression, bone, muscle and several other types of cancer (colon, breast, prostate, etc.).
The WHO estimates that more than 40% of the world population does not carry out sufficient PA, is suggested to be at least 150 minutes per week (30 minutes a day for five days) of moderate exercise for an adult. In Europe this sedentary lifestyle is more common in large cities. However, 50% of car travel in urban context are shorter than 5 km, which could be covered by a 15-20 minute cycling. Daily routes consisting in short trips: in the presence of walking trails or bike lanes, the citizenship would be more capable of reaching the amount of daily PA highly recommended to stay healthy. Moreover, an increased use of bicycles has beneficial effects not only on health but also could have a positive effect on the environment, pollution, traffic, road conditions, work and economy (Coppola, Ripamonti, Cereda, Gelmi, Pirrone and Rebecchi, 2016).
Physical inactivity is a significant public health problem in most Regions of the World. The promotion of active transport
(cycling and walking) for everyday PA is a win-win approach that needs to be disseminated and encouraged, especially in congested urban areas. In a time that is characterized by a greater emphasis on the quality of life, health protection and environmental sustainability should guide the great urban transformation and renewal projects towards strategies that encourage active transport. Nowadays, it should be unthinkable to design new suburbs or redevelop existing ones without planning safe and capillaries routes without paying attention to designing public urban spaces or green areas.
This has been recognized by a number of international policy frameworks, such as the Toronto Charter for Physical Activity launched in May 2010 as a global call for action or the Action Plan for implementation of the European Strategy for the Prevention and Control of Non-communicable Diseases 2012–2016, adopted by the WHO Regional Committee for Europe (WHO, 2011). The strategy identifies the promotion of active mobility as one of the supporting interventions endorsed by WHO Member States.
Physical Activity: measurements of positive effects
Transport is an essential part of our lives and a basis for providing access to goods and services. Different kinds of transport are associated with specific impacts on society, health, and the environment (Maltese, Mariotti and Oppio, 2011). Analysing and comparing these effects is an important key to create evidence-based policies and strategies. Economic appraisal is an established practice in transport planning (Laine, Kuvaja-Köllner, Pietilä, Koivuneva, Valtonen and Kankaanpää, 2014). However, techniques for assessing the value of the health benefits of cycling and walking are underutilized.
Several epidemiological studies quantify some of the many benefits of PA (Moran, Van Cauwenberg, Hercky-Linnewiel, Cerin, Deforche and Plaut 2014), but such studies are rarely applied to both cycling and
15
pedestrian pathways (Karusisi, Thomas, Meline, Brondeel and Chaix, 2014). For example, there are different and consolidated epidemiological studies reporting the Odds Ratio (OR) between activity and inactivity, but few case studies referring to changing individual habits influenced by the urban context were conducted.The literature shows us that active people (> = of 150 minutes of activity per week) are healthier than sedentary people (Kwarteng, Schulz, Mentz, Zenk and Opperman, 2014). Rather, PA has a continuous dose–response relationship with most health outcomes: every intensification of PA is associated with additional health benefits (WHO, 2010). This has also been shown by studies looking specifically at walking or cycling (Oja, 2011).
Starting from the existing research, the World Health Organization, Regional Office for Europe, has developed a tool to evaluate the health effects associated with the use of bicycle and pedestrian infrastructure. Named “Health economic assessment tools (HEAT) for walking and for cycling”, the software follows an approach based on evaluating the relative risk referring causes of mortality. The final output is a provisional estimation of deaths saved,
related economic saving. The Standard value of statistical life (VSL) derived from scientific literature published is a default value provided in HEAT by selecting a specific country.
Speaking about walking and cycling data, the effectiveness of economic evaluation is highly dependent on the validity and reliability of the data used. In order to draw up a survey capable of collecting relevant data to be analyzed using the HEAT tool, a specific questionnaire was created to be distributed to a representative sample of population, where the findings apply to the whole inhabitants of Zona 7 in the western part of Milan (population 180,000). The survey aims to learn about the habits and conduct of the population’s PA, in particular the use of bicycles and cycling paths in the urban area analysed. Referring to this specific context, the research’s objectives are two: first of all, enhance the research currently being developed to evaluate and measure the increase of PA in the urban environment related to an improvement of cycle lanes in urban design. Secondly, define positive effects in the short and long term related to the PA level due to time spent in urban cycling (before and after an hypotheses of the cycle lanes improvement).
Methodology
The research focuses on quantifying the increase of active of transport and then deducting the health gain in terms of reducing mortality rate.
Following this purpose, it was necessary to create a specific questionnaire: a literature review has allowed to analyze in detail and compare different tools to collect information about health, PA, amount of cycling and how this factors are linked to the environmental context. It has been drawn up an analytical comparison to identify the frequency of questions founded in several questionnaires: “International and Global Physical Activity Questionnaire”, (Mannocci, Di Thiene, Del Cimmuto, Masala, Boccia, De Vito and La Torre) “International Prevalence Study on Physical Activity” (Bull, Maslin and Armstrong, 2009) and “Questionario sui progressi delle aziende sanitarie per la salute in Italia” (Dettoni, Penasso, Suglia, 2009) (Buffoli M, Gola M, Rostagno M, Capolongo S, Nachiero D. 2014 ).
Compatibility and utility of identified questions have been compared with the HEAT Tool framework for a further evaluation of collected data. The result is a self administered survey made of 30 close-ended questions, formed by 3 different domains: 15 questions about personal information of the interviewed; 12 about their current and future level of PA; 3 about their opinions and advices about infrastructures, actions that could be made regarding cycling mobility and public spending.
16
The difference between the values coming from the last questions (actual use and hypothetical use) permits to evaluate the expected growth of cycling and to make consecutives evaluation about the benefits that comes from this improving of PA. The use of the software is aimed to determine in a short, medium and long term, how long a specific infrastructure project encourages daily use of bicycles. Through the use of the HEAT software, the final goal is to determine possible positive effects related to the potential construction of an extensive network of cycle paths in "Zona 7". Research is forecasting, comparing health gain in the face of an economic investment to improve the built environment.
Results and discussion
After 80 days of dissemination, 345 people answered to the survey: 2 part per thousand of the inhabitants of the Milanese area analysed (Zona 7). The current cycling rate is limited to 198 of 345 interviewed (57,4% of the sample) with an average time spent cycling from a single bike-user of 25,6 minutes/day for 143 days/year. If the infrastructure for cycling mobility will be implemented, integrated and improved in terms of street-scape qualities, forecasting data show a meaningful change: we would increase the number of cycling people to 248 of 345 interviewed (71,9% of the sample) and the cycling rate to 30,4 minutes/day for 196 days/year. The increased values are related both to the number of people that would use the bike (17,8% more), the average time (+19%) and the number of the days (+37%) in a year in which they would practice this kind of active transport.
Collected data have been analysed with HEAT software, that defines as health outcome an increase (+4%, from 7% to 11%) of protective benefit on the risk of mortality and morbidity, for cyclists compared to non-cyclists. The forecast calculation of the HEAT software, in terms of reducing of mortality rate, defines 13 deaths avoided every year and a rising of the protective benefit of the 50% for cyclist compared to non-cyclists.
Additional outcome to take into consideration consist in comparing the construction costs of a new bike path with the savings quantified in terms of reduced health care costs and deaths saved. Specifically for Milan Zona 7, it has been made a construction costs’ evaluation to complete the cycle path. It has been calculated the missing Kilometres necessary to make the existing networks more widespread. The comparison between the cost of cycle lines’ implementation and the annual healthcare cost saved, related to less dead caused by NCD’s, shows that since the year of track’s realization, the investments will be repaid. Note that in the following years, the cost of maintenance would be very low, compared to the durable savings for public healthcare spending. It should be noted that bike paths are only one of several urban health strategies to promote PA and the benefits are much more extensive and detailed than those estimated by the HEAT software. For these reasons, it can be used by local governments and planners as an operative instrument focused on the redevelopment of a simple neighbourhood and also as a vehicle of information aimed at making a district healthier.
Conclusions
The experience of the application of the HEAT tool is capable of showing policy makers, in a smart way, a cost-benefit analysis in face of an intervention to improve the built environment; implementing the walkability of an area, besides having a positive impact on the health of the population, leads to an increase in property values of the neighbourhood where it is applied. In the future, to increase the attractiveness of cities, professional skills as well as local authorities focusing on the most important determinants of health and sustainability must be involved in the
17
planning processes. Therefore, assessing the direct and indirect benefits of different urban-scale design choices on health is becoming a priority. To sensitize the Public Administration and really protect public health, this assessment should be quantitative and economic. Involving professionals not only related to the medical sphere but technicians such as urban planners and architects, able to design a urban form (Capolongo, Buffoli, Oppio and Petronio 2014) that physically promotes active transport, or moving daily by slow mobility has been considered crucial (Capolongo, Buffoli, Oppio and Rizzitiello 2013).
Surveys similar to the one that is being conducted for a part of the metropolitan area of the city of Milan could be applied to different situations, such as when planning a new pathways for cycling or walking, helping to evaluate the project for investments, or to quantify the reduced mortality from past and/or current levels of cycling or walking. It is ongoing the disclosure of the same questionnaire on the entire metropolitan area of Milan (nine areas in total). The common goal is to illustrate the economic consequences of a potential future change in the levels of the population’s PA influenced by the project.
It is important to note that the software only calculates health in terms of lower death rate, but the benefits of increased PA have much larger effects on health. Although, the use of active and sustainable mobility has lots of direct effects on the environment and the social aspect, and thus indirectly on health.
References
Buffoli, M., Gola, M., Rostagno, M., Capolongo, S., and Nachiero, D. “Making hospitals healthier: how to improve sustainability in healthcare facilities.” Ann Ig. 2014 Sep-Oct;26(5):418-25. Bull, F.C., Maslin, T.S., and Armstrong, T. “Global Physical Activity Questionnaire (GPAQ): Nine Country Reliability and Validity Study.” Journal of physical activity & health 2009; 6(6): 790-804. Capolongo, S., A. Battistella, M. Buffoli, and A. Oppio. “Healthy design for sustainable communities.” Ann Ig. 23(1) (Jan-Feb 2011): 43-53.
Capolongo, S., M. Buffoli, A. Oppio, and M. Petronio. “Sustainability and Hygiene of building: future perspectives.” Epidemiol Prev. 38, 6 (2014): 46-50.
Capolongo, S., M. Buffoli, A. Oppio, and S. Rizzitiello. “Measuring hygiene and health performance of buildings: a multidimensional approach.” Ann Ig. 25, 2 (Mar-Apr 2013):151-7.
Capolongo, S., M. Buffoli, and A. Oppio. “How to assess the effects of urban plans on environment and health.” Territorio 73 (2015):145-151.
Capolongo, S., Lemaire, N., Oppio, A., Buffoli, M., and Roue Le Gall, A. “Action planning for healthy cities: the role of multi-criteria analysis, developed in Italy and France, for assessing health performances in land-use plans and urban development projects.” Epidemiol Prev 2016; 40(3-4): 257-64. (in press)
Coppola, L., Ripamonti, E., Cereda, D., Gelmi, G., Pirrone, L., and Rebecchi, A. “2015-2018 Regional Prevention Plan of Lombardy (Northern Italy) and sedentary prevention: a cross-sectional strategy to develop evidence-based programmes.” Epidemiol Prev 2016; 40(3-4): 243-8. (in press)
D’Alessandro, D., M. Buffoli, L. Capasso, G.M. Fara, A. Rebecchi, and S. Capolongo. “Green areas and public health: improving wellbeing and physical activity in the urban context.” Epidemiol Prev. 39, 5 (2015): 8-13.
18
Dettoni, L., Penasso, M., and Suglia. A. “Una comunità in movimento. Repertorio di strumenti per analisi e interventi sul territorio.” Regione Piemonte, Assessorato alla Tutela della Salute e Sanità, 2009.
Fehr, R., and Capolongo, S. “Healing environment and urban health.” Epidemiol Prev 2016; 40(3-4): 151-2. (in press)
Gebel, K., et al. “Creating Healthy Environments: A review on the links between the physical environment, physical activity and health.” NSW Health Department and NSW Centre for Overweight and Obesity. Sydney. 2005
Karusisi, N., F. Thomas, J. Meline, R. Brondeel, and B. Chaix. “Environmental conditions around itineraries to destinations as correlates of walking for transportation among adults: The RECORD cohort study.” Plos One 9 (2014) e88929.
Kwarteng, J.L., A.J. Schulz, G.B Mentz, S.N. Zenk, and A.A. Opperman. “Associations between observed neighbourhood characteristics and physical activity: findings from a multiethnic urban community.” J Public Health (Oxf) 36, 3 (Sep 2014):358-67.
Laine, J., Kuvaja-Köllner, V., Pietilä, E., Koivuneva, M., Valtonen, H., and Kankaanpää, E. “Cost-effectiveness of population-level physical activity interventions: a systematic review.” Am J Health Promot 29, 2 (Nov-Dec 2014):71-80.
Maltese, I., I. Mariotti, and A. Oppio. “An ex-post assessment of sustainable mobility: the case of European neighbourhoods.” Territorio 59 (2011): 51-58.
Mannocci, A., Di Thiene, D., Del Cimmuto, A., Masala, D., Boccia, A., De Vito, E., and La Torre G. “International Physical Activity Questionnaire: validation and assessment in an Italian sample.” Italian Journal of public health 2010; 7 (4): 369-376.
Moran, M., J. Van Cauwenberg, R. Hercky-Linnewiel, E. Cerin, B. Deforche, and P. Plaut. “Understanding the relationships between the physical environment and physical activity in older adults: a systematic review of qualitative studies.” Int J Behav Nutr Phys Act 17, 11 (Jul 2014):79.
Oja, P. et al. “Health benefits of cycling: a systematic review.” Scand J Med Sci Sports 21 (2011):496–509.
Signorelli, C., Capolongo, S., Buffoli, M., Capasso, L., Faggioli, A., Moscato, U., Oberti, I., Petronio, M.G., and D’Alessandro, D. “Italian Society of Hypiene (SItI) recommendations for a healthy, safe and sustainable housing.” Epidemiol Prev 2016; 40(3-4): 265–270.
19
Social inclusion and use of equipped public space for physical activity.
Analysis and promotion prospects
Rossella Maspoli
Politecnico di Torino – Dipartimento di Architettura e Design DAD 1, Torino, Italy. Key- words: outdoor, urban spaces, fitness equipment, social inclusion, universal design.
Introduction
Physical inactivity is an important health risk factor that may be addressed at community level. In outdoor urban spaces and parks activity physical improves general wellbeing and plays an important role for reduction of chronic diseases.
Different health impact assessment methodologies have been applied with distinctive assumptions on key parameters, in Europe and United States.
The results of different methodological approaches have shown that the active transport and physical activity - in proximity and neighborhood areas - can provide substantial net health benefits, irrespective of geographical context.
Nevertheless, there are difficult in reconciling the approach for measuring community development activities in outdoor spaces with the outcomes and impacts of health, like the World Health Organization (WHO) has underlined too (Ison 2009).
On one side, physical activity can be done in a variety of ways, such as walking or cycling for transport, performing fitness exercises, participating in sports, playing in the park, working in the community garden, taking the stairs or embedding into daily routines. Therefore, it is difficult to define indicators that take into account not only the time spent, but also type and quality of activities, depending on different needs of health and adoption of different lifestyles.
On the other side, disability, age, gender, race and ethnicity may illuminate the issues related to health disparities and they have a
significant influence on likelihood of doing physical activity in outdoor spaces.
WHO Europe has outlined that disadvantaged populations are less likely to have easy access to the places that encourage an active lifestyle. Women and young people in minority groups are often excluded from mainstream sport and physical activity programmes, accessibility and integration are key to enabling people with different disabilities to enjoy enhanced levels of participation. When they choose to be active, they often face risks related to road security and perceived risk of crime (Edwards and Tsouros 2008).
Safe public neighborhood parks and outdoor spaces can reduce inequity in access and choices for physical activity, providing facilities and equipment for active living, such as fitness areas, playgrounds and multi-purpose sports fields.
Parks and sites in the healthy city must offer a physical and built environment that supports recreation, well-being, security, social interaction, easy mobility, sense of cultural identity and accessibility to the needs of all urban users and citizens.
Therefore, innovative neighborhood planning and design must respond to the different way of using the public space of coexisting communities for health, welfare and social exchange.
Community facilities can stimulate users to increase their levels of physical activity and social inclusion, doing so they require attention to the outreach and the public
20
space management, complementary to the planning and design in urban regeneration. In this view, the paper analyzes different propensity of urban communities to physical activity and identifies main factors and requirements in the design of outdoor public spaces, that can affect the increase of physical activity.The included trials have revealed the main factors of health risk prevention for diseases (Levine 2015, Woodcock et al. 2011), the social inequality in access to physical activity and environmental factors that inhibit the use of public space for walking and physical activity (Shephard et al. 2004, Van Holle et al. 2012, Christine et al. 2015, Gascon et al. 2016).
Methodology
The methodological approach is developed through the analysis of factors and indicators in the scientific literature and testing, from the local planning to the design.
Insufficient physical activity is the 4th leading risk factor for mortality (WHO 2012), current urban planning choices also impact on the public lifestyles.
In the long term, a higher percentage of the population achieving regular physical activity in outdoor spaces may lead to a lower level of chronic illness. Certain epidemiological studies have found that the lack of green space potentially causes cardiovascular mortality and poorer mental health (Gascon and others 2016).
Instead, long-term exposure to urban environments with greater resources to support physical activity is associated with a lower incidence of obesity and type 2 diabetes mellitus (T2DM) (Christine et al. 2015).
Generally, individuals who are insufficiently physically active have a 20% to 30% increased risk of all-cause mortality compared to those who engage in at least 30 min of moderate intensity physical activity most days of the week (Woodcock et al. 2011).
A transition in urban planning and design is needed to make systematic plans to improve the relation between urban activities and health.
Research concerns guidelines for developing the operational design of areas for outdoor physical activity, the scale of local planning - regarding the choice of the site to transform and equip - to the definition of key environmental and space requirements of the areas, the definition of the types of site accommodation, and equipment to be installed.
A few recent studies provide relevant methodological approach and significant information about the propensity factors on the location of the equipped areas at the neighborhood level.
The International Physical activity and Environment Network (IPEN) study - a cross-sectional research including 6822 adults aged 18–66 years from 14 cities in ten countries on five continents - suggests the importance of engaging urban planning, transportation, and parks sectors in efforts to reduce the health burden of the global physical inactivity, in relation to the similarity of findings across various cities (Sallis et al. 2016).
In reference to the study, indicators of walkability, public transport access, and park access are particularly interesting for identify the preferential terms of localization of sites and facilities for physical activity.
These indicators are meaningful to inform neighborhood policy, with the perspective of creating and maintaining Healthy Places (cycling, walking, doing gymnastics). The IPEN study has measured physical activity connecting to variables related to built environment and four of six environmental attributes are significantly and linearly related to increasing physical activity, in the models: net residential density (1000 dwellings/km²); intersection density (100 intersections/km²); proportion of retail combined and civic land area to total buffer area; public transport density (10 transport points/km²); number of parks contained or intersected by buffer (10 parks/km²); street network distance to nearest transport stop (1000 m).
21
The study has used comparable objective measures of built environments (geographic information systems) and physical activity (electronic accelerometers that recorded motion every minute).
The IPEN study results provide the first elements to perform an alternative assessment of the local planning systems.
On the level of selected project area, complex factors related to environmental, technical and perceptive quality of the site must be defined.
The WHO Europe physical activity planning guide detects some meaningful factors (Edwards and Tsouros 2008):
• wide range of accessible and attractive routes, accessible by foot or bicycle for efficient public transport;
• mixed-use, high-density communities with easy access to principal neighborhood destinations and recreation facilities;
• walkable, attractive neighborhood and trail connections between neighborhoods;
• integration of planning decisions related to the built environment concerning public health and physical activity;
• accessible facilities for physical activity;
• areas that are safe in terms of road security and crime;
• plan and services for special groups that enable active living for all ages and abilities; • strong involvement by a variety of stakeholders and citizens;
• social norms and expectations that support and encourage active living as a way of life in the city.
Safety and road security standards can be a unifying fundamental concern which impacts the whole community and can even bring it closer together rather than polarizing different user groups.
The case studies of Amsterdam and Copenhagen as walkable cities also feature these factors as the key catalyst that triggered the shift towards human-centric cities in the 1970s.
The analysis reported and others studies (Heath et al. 2006) (van Holle et al. 2012)
reveal that adults who lived in activity-friendly neighborhoods do more of physical activity per week (for example 68–89 min) than those in the least activity-friendly neighborhoods. The relation of built environments to physical activity is generally similar across advanced cities, where public parks provide places for recreational physical activity.
In short, the design principles can be apply across countries, but the performance standards are still being defined.
Results and discussion
Design quality of urban environments has the potential to contribute substantially to physical activity, user-centred design can provide solutions to modern healthcare requirements, the emerging factors are:
• Designing for and with all, viewing accessibility requirements in public space as an opportunity, rather than a constraint, for designers;
• Providing life-support and equipments which are adapted to user comfort and spatial and climatic conditions in outdoor spaces.
The main factors and requirements considered regard security, protection from climate and air pollutants, visibility and accessibility, attractiveness and image, presence of multi-functional
22
areas (equipment for children and adults, loisir areas), fitness equipment for different ability levels (children, adults, elderly, physically disabled).
According to WHO studies (Shephard et al. 2004) and the direct survey of parks users in the North of Turin, the main technical, environmental and social factors that influence the physically activity in outdoor spaces are outlined.
Requirement of Class: spaces and equipment security
• adequate exercises to physical capacities (not available for people with different abilities); • equipped areas for free fitness activities, individual or group: “no space of our own to do
the things we like to do” (especially young people);
• presence of integrated equipped areas for physical activity (equipment for children, seniors, adults);
Requirement of Class: social security and inclusion
• road security (especially older people and parents in relation to their children);
• visible and controllable localization of physical activity areas and fitness equipment stations;
• attention to personal safety and crime prevention (especially girls, women and parents of small children);
• attention to ageism (too old to be active), sexism (not appropriate for girls and women) and cultural and religious restrictions;
Requirement of Class: acoustic, lighting, hydrothermal comfort
• weather conditions control: mitigation extreme heat, cold and icy conditions (especially older people), shading, presence of trees, “heat island effect” mitigation, wind containment;
Requirement of Class: accessibility, usability, visitability • accessibility to sites for all;
• protection of being injured or have been injured (especially among seniors);
• contiguity with loose, pleasure and relax spaces (especially among seniors and mothers with small children);
Requirement of Class: reliability, management
• prevention against unattractive environment (litter, graffiti, vandalism); • cyclic and ordinary maintenance;
• site management and periodic control;
• organization of separate waste collection and transport to landfills; Requirement of Class: environmental load
• mitigation by air pollution and noise pollution related risk; • devices for the treatment and reuse of storm water.
• technical elements and soil characterization that avoid the water stagnation, the soaking, the formation of mold;
• presence of eco-recycled elements and materials.
Specifically, the use of a design for all and inclusive approach represents a crucial factor in the design of outdoor equipment: accessibility from multiple directions, multi-functionality of equipment (for example the use of certain equipment for both children and old people), clarity in the signaling, use of color with signal function, equipment for motor disabled (also accessible by children and adults with average abilities).
Another set of relevant factors for social inclusion concern the conditions for overcoming cultural and religious restrictions.
From direct observation emerges, for example, how fitness equipments which are in a pleasant place, with the possibility of positive social surveillance, in proximity to areas for children's games, as well as ease of use, are also used by Muslim women.
23
In addition, the proximity of safe fitness and children play stations – with visual and perceptive control of the zone - is essential to ensure activities carried out by parents with young children.
Conclusions
“The quality of a space will affect how well it is used” (CABE 2010).
More cities aspire to create more people-friendly places to encourage walking and physical activities by establishing new services and by designing suitable infrastructure safer and more comfortable. IPEN research and WHO guidelines have identified criteria for the location of equipped places for physical activity, into the local planning.
Quality improvement of health urban planning and design implies to experience a multidisciplinary methodological approach - epidemiological, morphological, technical performance, environmental, sensory-perceptive – and citizens participation. Experiences developed in the city of Turin (Barriera di Milano and San Salvario neighborhoods) and the comparison with multidisciplinary international research has allowed to outline first guidelines for the design of public spaces in the Health City.
Furthermore, the study aims to testing the potential of the social media and the planning from the bottom up, to check inclinations and profiles of open public space users for physical activity - examining the vigorous and moderate physical activity and the walking - in an urban suburb. On the example of the online "community map" of public space, the research intends to develop a "community map" of the health public space.
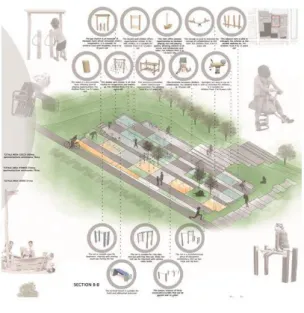
Fig. 1. Project scenario: physical activity areas for different abilities. Workshop Urban micro-landscapes.Tasting the Landscape (Politecnico di Torino DAD, AIAPP-IFLA 2016).
References
Commission for Architecture and the Built Environment (CABE) and the Asset Transfer Unit, 2010. Community-led spaces. A guide for local authorities and community groups London: Blackmore.
24
Christine, Paul J., Auchincloss, Amy H., Bertoni, Alain G., Carnethon, Mercedes R. , Sánchez, Brisa N., Moore, Kari, Adar, Sara D., Horwich, Tamara B., Watson, Karol E., 2015. Longitudinal Associations Between Neighborhood Physical and Social Environments and Incident Type 2 Diabetes Mellitus, JAMA Intern Med.; 175(8): 1311-1320.
Edwards, Peggy, Tsouros, Agis. D. 2008. A healty city is an active city: a physical activity planning guide, Copenhagen: World Health Organization Regional Office for Europe.
Gascon, M., Triguero-Mas, M., Martínez, D., Dadvand, P., Forns, J., Plasència, A., Nieuwenhuijsen, M.J., 2016. Green space and mortality: a systematic review and meta-analysis. Environ. Int. 2 (86), 60–67.
Heath G., Brownson R., Kruger J., et al., 2006. The effectiveness of urban design and land use and transport policies and practices to increase physical activity: a systematic review. J Phys Act Health; 3: S55–71.
Ison, Erica, 2009. The introduction of health impact assessment in the WHO European Healthy Cities Network, Oxford: Oxford University Press.
Levine, James A., 2015, Sick of sitting, Diabetologia, Volume 58, Issue 8, pp 1751–1758.
Sallis, James F., Cerin, Ester, Conway, Terry L., Adams, Marc A., Frank, Lawrence D., Pratt, Michael, Salvo, Deborah, Schipperijn, Jasper, Smith, Graham, Cain, Kelli L., Davey, Rachel, Kerr, Jacqueline, Poh-Chin, Lai, Mitáš, Josef, Reis, Rodrigo, Sarmiento, Olga L., Schofield, Grant, Troelsen, Jens, en Van Dyck, Delfi, De Bourdeaudhuij, Ilse, Owen, Neville, 2016. Physical activity in relation to urban environments in 14 cities worldwide: a cross-sectional study, the Lancet.com on April 8, 2016. Shephard R. et al.. 2004. Physical activity policy development: a synopsis of the WHO/CDC consultation, September 29 through October 2, 2002, Atlanta, Georgia. Public Health Reports, 119:346–351.
Van Holle V., Deforche B., van Cauwenberg J., et al.. 2012. Relationship between the physical environment and diff erent domains of physical activity in European adults: a systematic review. BMC Public Health; 12: 807.
Woodcock, J., Franco, O.H., Orsini, N., Roberts, I., 2011. Non-vigorous physical activity and all-cause mortality: systematic review and meta-analysis of cohort studies. Int. J. Epidemiol. 40 (1), 121–138.
World Health Organization (WHO), 2012. http://www.who.int/nmh/events/2012/ discussion_ paper3.pdf . Accessed April 27, 2016.
25
Beyond geospatial visualisation: maps for health research
Enrico CicalòDipartimento di Architettura, Design e Urbanistica. Università di Sassari, Alghero, Italia ([email protected])
Key-words: maps, data visualisation, GIS, graphic representation, health research.
Introduction
In this paper will be discussed the relationship between health research and geospatial visualization techniques and tools. Health data visualisation can be a effective tool to reveal new insights into the patterns of disease. Furthermore, the simultaneous visualisation of health data with environmental data obtained from different sources can further the understanding of environmental-health linkages and can generate new hypotheses to be tested in future research (Stensgaard et al 2009).
Disease mapping and environmental risk assessment using digital geospatial data resources are now established analytical tools in both human and veterinary public health (Bergquist, Rinaldi 2010; Richardson et al, 2013). Indeed, new subdisciplines aimed to visualise, describe and explain the spatial patterns of diseases are being developed in different research fields. In the last decade dedicated scientific journal have started to focus on this topics. Moreover, in 2002 started the publication of International Journal of Health Geographics and in 2006 Geospatial Health. An important aspect of heath research is the study of risk factors for diseases considered “environmental” diseases because a considerable fraction of their burden can be attributed to environmental factors (Listorti and Doumani 2001; Prüss-.stün, Corvalan 2007). Thus, distribution patterns are strongly associated with the spatially heterogeneous environment in which they are entranced (Woolhouse et al., 1997;
Brooker and Clements, 2009).
Geographical information systems (GIS), satellite-based remote sensing (RS), geographical positioning systems (GPS), spatial statistics and other computer-assisted applications made it possible to translate datasets into maps. The use of GIS in geospatial health have been firmly established as a useful tool for collating, exploring, visualizing and analysing health data in a graphic manner (Hendrickx et al. 2004, Cringoli et al. 2005, Yang et al. 2005; Rinaldi et al. 2006, Brooker, 2007).
26
Geospatial information for health research
Location is traditionally considered important for health. Hippocrate (460 to 377 BC) in his book ‘Airs, Waters and Places’ observed that certain diseases tend to occur in some places and not in others.
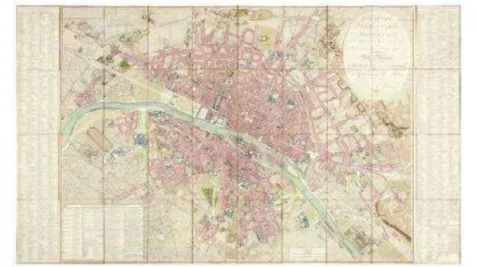
Spatial analysis using maps to associate geographic information with disease can be traced as far back as the 17th century. Examples of the use of maps for the visualisation in the field of health research are been highlighted (Bergquist, Rinaldi 2010; Utzinger, Jürg, et al.) including the world map of diseases produced by the German physician Finke in 1792 and the mapping of yellow fever occurrences in the harbour of New York in 1798, the map of the addresses of cholera victims that in 1854 shown the relationship with the location of water supplies in London’s Soho district. The GIS development started in this century, in the 1832, with the spatial analysis of mortality in Cholera epidemic in the city of Paris experimented by the French geographer Charles Picquet (Yasobant, Vora, Upadhyay 2016). Beginning from these experiments, mapping the phenomena linked to health became usual. The map of the distribution of hookworm in Texas, drawn at the beginning of Twentieth century was crucial to the elimination of hookworm disease in the United States, as well as worldwide risk mapping of malaria was a key feature to guide control approaches.
Fig. 1. Map of yellow fever occurrences in the harbour of New York, 1798.
In 1970 Dr Barnett Cline experimented the application of computer technology and advanced statistics, until then applied only for military and economic needs, for epidemiological investigations for epidemiological research and public health (Cline 2006). These technologies continue to develop thanks to more sophisticated and user-friendly instruments and software and to the accessibility to data and applications through the Internet.
27
Fig. 2. Map of mortality in Cholera epidemic in the city of Paris, 1832.
Fig. 3. Map of the addresses of cholera victims that in London’s Soho district, 1854.
Open source mapping tools
A virtual globe is essentially a web-based GIS tools used for the 3D visualisation of the Earth based on satellite imagery upon which spatial information can be represented. Users are able to add and to share their own data and to freely explore the virtual environment by zooming and changing their position. Virtual globe technology has provided a cheap and accessible method to communicate data both to non-specialists and among scientists (Butler 2006) and the number of publication that use this virtual globe as tool for visualising and processing data is constantly growing in all the research fields (Stensgaard et al 2009). The most used virtual globe is Google
28
Earth, primarily aimed at the general public, but also widely used for display and disseminate scientific data and research results. Creating Keyhole markup language (KML) files it is possible the visualisation of data in Google Earth™.
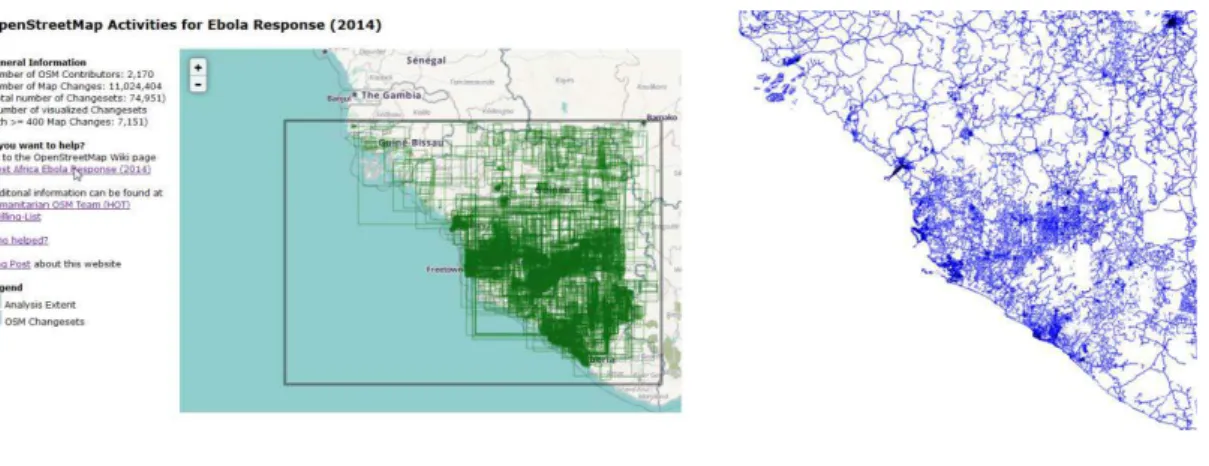
Individual citizens are contributing to the production and the gathering of geospatial data by the real-time interactive GPS/GIS functionality embedded in mobile phones. The accessibility to the data gathered by this type of participatory GIS, or volunteered geographic information, are expanding also the opportunities for mapping health data (Mooney et al. 2013). The Volunteered Geographic Information community (Goodchild 2007), is a global community, which collaborate to create a detailed base map, similarly with the Wikipedia model of information collection. Some of these, as OpenStreetMap has been analysed as source of heath data (Mooney et al. 2013). OpenStreetMap is a project with the mission of creating free maps. Contributors collect spatial data mainly from portable GPS devices and make this data freely. Furthermore dedicated tools, such as WHO’ s HealthMapper or CDC’ s EpiMap, have been developed to mapping disease distribution and community treatment information (Fòetcher-Lertey, Caprarelli 2016).
Fig. 4. A Google Earth™ visualisation of the information contained in a single KML (A.S. Stensgaard et al., op. cit).
Fig. 5 and 6. Visualization of all that mapping work West Africa’s Ebola outbreak by Humanitarian OpenStreetMap Team.