From Quality to Innovation:
Evidence from Two French Employer Surveys
Fabrice GALIA1
Sanja PEKOVIC2
January 2008
Proposal for the 1st DIME Scientific Conference "Knowledge in space and time:
Economic and policy implications of the Knowledge-based economy" BETA, University Louis Pasteur, Strasbourg, France, 7-8-9th April, 2008
Abstract.
In this article we investigate the relationship between quality system and innovation performance using the method of selective matching. We use two French microeconomic surveys, “Changement Organisationnel et Informatisation” (COI 1997) and “Enquête Communautaire sur l’Innovation” (CIS3 1998-2000). We highlight in a first hypothesis a positive relationship between quality (ISO 9000) and innovation but only for certain area of innovation performances, due we explain contradiction in the literature about their relationship. Furthermore, the second hypothesis indicates that innovation performance of firms with Top Quality Level is higher than that of Medium Quality Level firms for certain innovation activities. On the other side, we found that that there is low-impact difference on innovation performance between firms with Medium and Low quality levels. This induces that for great innovation performance improvement well established quality system is needed inside the firm.
JEL Code. L15, O31, Q55
Key-words. Quality, Innovation, ISO certification, Selective Matching
1
Burgundy School of Business (ESC Dijon), France - CEREN - Research Center on Enterprises - Management Department; Université Panthéon-Assas Paris II - ERMES-UMR 7181-CNRS. fgalia@escdijon.com
2 Corresponding author. Centre d'Etudes de l'Emploi and Université de Marne-la-Vallée (OEP), « Le Descartes I » 29, Promenade Michel Simon, 93166 Noisy -Le -Grand Cedex, Tel. 0033 (0)145926973, sanja.pekovic@mail.enpc.fr
1. INTRODUCTION
The development in technology over the last ten years has changed drastically the characteristics of business. A great increase of competition has appeared which has accelerated the globalisation of international companies, and also the changes of the quality requirement in the business. Furthermore, globalization means developing an integrated management process. Business competence is one of the most critical aspects of creating and sustaining competitiveness, which is a common goal for both quality and innovation. These working conditions demand constant extra effort of management and of all employees in the company, to improve the performance procedure, products variety and products quality.
Economic aspects of innovation have been one of the primary concerns focusing on different causes and effects on the innovation performance. Innovation is considered to be the new way of delivering quality to the customer both consistently and with economic viability in mind (Zairi, 1994). In many organizations the barriers to innovation are difficult to overcome without the additional dimension of quality standards. Quality in its human and technology dimensions helps creating an environment and a culture that supports innovation. Quality is doing things better; innovation is doing things differently. Both are needed.
A literature leads to the conclusion that there are conflicting arguments concerning the relationship between quality and innovation (Mahesh, 1993; Dean and Evans, 1994; Roffe, 1999; Slater and Narver, 1998; Wind and Mahajan, 1997). One group of arguments supports the positive relationship between quality and innovation, implying that organizations implementing quality are successful and increase their innovation performance. The opposite group of arguments claims that quality will hinder organizations from being innovative due to several inherent elements that are not congruent with the spirit of innovation.
This study tries to fill a gap in the literature relating the quality–innovation relationship. Essentially, there is a limited literature supported by theoretical concepts or by empirical evidence. The interest of this study is based on two hypotheses. First, to answer empirically the question “Is there positive correlation between quality and innovation”? The second hypothesis will highlight the assumption that different quality levels (already established in the firm) affect differently the improvement of innovation performance.
Using two French microeconomic surveys called the “Changement Organisationnel et Informatisation” (COI 1997) and the “Enquête Communautaire sur l’Innovation” (CIS3 1998-2000), we distinguish three types of firms that will present three levels of quality. It is important to mention that these two surveys are mandatory for all firms, however, there is negative correlation between the two questioned populations. So how, we investigate a sample of 1146 firms. The first category of firms is called firms with Top Quality Level includes firms that have ISO 9000 certification and their suppliers are certified and they have other system of certification or total quality. Further more in this group we include firms that are ISO certified and they have other system of certification or total quality. The third possibility for the group of Top Quality Level is that firms are certified and their suppliers are also certified, but they do not have other system of certification or total quality. This group presents the highest quality level on the hierarchy. The second position is called Medium Quality Level and it includes firms that are not ISO certified but they have other system of certification or total quality and their suppliers have ISO certification. In this category we include also firms that have only either ISO certification or other system of certification or total quality or their suppliers are ISO certified. The third position named Low Quality Level includes firms that are not ISO certified, do not have other system of certification or total quality and their suppliers also do not have ISO certification. This categorisation allows to empirically construct the different levels of quality (certified/non certified) to understand their effect on the improvement of innovation performance.
The novelty of this paper is that we will use several innovation variables that will permit us to cover majority of innovation area.
The findings, after using selective matching methodology, indicate that quality (ISO 9000) has positive effect on the majority of innovation area. Furthermore, the results after controlling for selection bias (through propensity score estimates) induce that innovation performance of firms with Top Quality Level is higher than that of Medium Quality Level firms for certain innovation performances. On the other side, we found that there are some differences between the impact of firms with Medium and Low Quality Level on innovation performances. The results propose that firms that are certified indirectly or thought other system of certification or total quality have low-impact on the innovation performances, this implies that only firms with well implemented quality system will greatly improve their innovation performances.
This paper is organized as follows. Section 2 defines the ISO 9000 certification and the innovation process. In Section 3, we develop the main issue of the paper, data and the methods used. Section four is devoted to conclusive remarks.
2. LITERATURE REVIEW
2.1. Brief description of ISO 9000 standard and innovation performance
Before discussing the literature review on the relationship between quality and innovation, it is necessary to clarify ISO 9000 certification and innovation performance.
The ISO 9000 standards were created to facilitate mutual understanding of quality management system requirements in national and international trade. ISO 9000 standards represent a benchmark for company management in its whole. They are not focused on the product/service quality, but on the related processes, enlarging their action to the entire network of interactions in which the firm is acting. According to its design, ISO 9000 only provides a framework without a need to change how the organization operates so as to “ensure that nothing important is left out and that everyone is clear about who is responsible for doing what, when, how, why and where”, but the certification only recommends the basic elements of a proper quality assurance system, without imposing the ways to apply them (ISO, 1998).
Establishing quality standards and documenting the company’s quality systems requires a considerable managerial time and effort. Nonetheless, the ISO 9000 certification is not a risk-free undertaking. The cost of certification can be very high (ranging from $10 000 to $300 000 per company (Anderson et al., 1999)). The time required for ISO implementation depends on many factors, including a firm's size and complexity, current level of work quality, extent of current documentation, and the degree of management commitment, but usually it takes between six to twelve months.
Benefits of ISO certification include: increased customer preference, improved company quality image and competitiveness in the market, compliance with customer requirements, streamlined procedures and documentation, increased awareness of preventive and corrective actions, and provision of foundation for TQM. The literature suggests that the most prominent reason for implementing the ISO 9000 certification is that customers prefer to buy from firms that are ISO certified (Rao et al., 1997). In addition, they identified that firms that have adopted the ISO certification also ask their suppliers to have this kind of certification.
The literature review defined innovation as “implementing new ideas that create value” which refers to the various types of innovation such as product development, the deployment of new process technologies, and management practices (Linder et al., 2003, OECD, 1996). Innovation is the key factor of competitiveness in firms and nations. Many studies have been devoted to the determinants of innovation and research and development (R&D). The most frequently examined factors are size and type of the firm, technological opportunities, degree of competition, and capacity of appropriation of the innovation benefit (Cohen, 1995; Encaoua et al., 2000; Kleinknecht and Mohnen, 2001). They identify clearly: factor conditions (human resources, basic research infrastructure, information infrastructure, and the supply of capital risk), supporting environment (competition, innovation incentives, presence of clusters, and local suppliers) and demand conditions (sophisticated customers, anticipated needs). However, the approach which studies the relationship between quality system and innovation performance has been marginalized. To understand the linkage between the innovation performance and the quality system, it is necessary to understand the various types of innovation and certain principles of quality management.
Daft (1978) proposed that innovation could be classified as technical and administrative innovation, it refers to innovations that are generated from the managing and alteration of an organization’s structural and administrative procedures (Daft, 1978; Damanpour and Evan 1990; Kimberly and Evanisko 1981; and Knight, 1967). Further more Knight (1967) and Utterback (1971) define the Process innovation as an improvements or introduction of new production process for products or services. Radical innovation brings about a non-routine but clear change to the very core on how activities are carried out while incremental innovation is usually part of routine changes that do not deviate much from present organizational activities (Dewar and Dutton, 1986 and Ettlie et al., 1984).
2.2. Quality system-innovation performance relationship
Quality system management can reinforce incremental innovation because incremental innovation fits best with an existing quality system that is designed to improve various evolutionary aspects of an organisation that are of an incremental nature (Ireland and Hitt, 1997). Milgrom and Roberts (1990) study the complementarities among a variety of decision variables, such as production, flexibility, innovation, quality, skills, training, incentive schemes and organizational decisions. We thus have mutual reinforcement between these practices or strategies, acting as a synergetic effect. Therefore, while quality can simplify or streamline a process, incremental innovation requires doing it slightly differently.
A review of the literature discussing the relationship between quality management and innovation performance suggests that there are conflicting arguments concerning the relationship between quality management and innovation (Prajogo and Sohal, 2001). Arguments that support a positive relationship between quality management and innovation suggest that companies embracing quality in their system and culture will provide a fertile environment for innovation (growth) because quality embodies principles that are congruent with innovation (Mahesh, 1993; Dean and Evans, 1994; Kanji, 1996; Tang, 1998; Roffe, 1999). The motivation of both performances, quality and innovation, is satisfaction of customer requirements with the need to make continuous improvements. They also point to the need for close contact between top level executives and persons developing new technologies. The philosophy of quality management is that employees will be more satisfied and productive if they can contribute their thoughts and ideas to the achievement of the company goals. In many ways quality can be seen as laying the foundation of a cultural environment that encourages innovation. As Zairi (1994) remarked, total quality management (TQM) has "given organisations the impetus and commitment required for establishing climates of never-ending innovation or innovativeness". Crépon et al. (1998) propose that innovation output depend among others on technology push indicators (ISO certification could be considered as a part of new technologies). The paper of Galia and Legros (2004) tend to confirm the existence of a virtuous circle which link innovation to profitability via training and quality.
In contrast to the above arguments, several authors reject the positive relationship between quality management and innovation for the reason that it possesses principles and practices that could hinder innovation. Certain researchers agree that a customer philosophy could easily lead organizations to focus only on incremental improvements in their current products and service activities rather than trying to create new solutions (Slater and Narver, 1998 and Wind and Mahajan, 1997). Consequently, this leads to the development of uncompetitive, already existed, products rather than the development of real innovation. In this way, such firms could fail to explore customers’ needs. Moreover, improvement requires regulatory standards and activities that are sufficiently routine to be well understood. Hence, control and stability is the core of the continuous improvement process (Jha et al., 1996). While standardization is necessary for conformance and error reduction, from the innovation point of view, it could result in rigidity (Glynn, 1996; Kanter, 1983). Flynn (1994) argues that the fast product innovation and quality cannot be simultaneously achieved. It is difficult to accept that a company can be successful with innovation if it cannot produce products that meet acceptable quality standards. This induces that in certain situations (when industry and market conditions are taken into consideration, Nowak, 1997) firms have to prioritize quality over innovation or vice versa.
3. EMPIRICAL ANALYSIS
3.1. The database
The research is based on two cross section French surveys from the “Changement Organisationnel et Informatisation” (the Organizational Changes and Computerization COI 1997) and the “Enquête communautaire sur l’innovation” (Community Innovation Survey CIS3 1998-2002). The COI survey was created by researchers and statisticians from the economic administration. This collaboration gathered together a great deal of knowledge, which has made it possible to put together the surveys of different companies and the survey concerning employees section (“labour force”). In this survey, we can find the manufacturing industry, the agro-food industry, branches of the services industry (i.e. accountancy), and branches of the commercial industry. This COI survey has been used by several researchers like Acemoglu et al. (2007) or Aubert et al. (2006). The CIS3 is a source targeting the
economic innovation, evaluation of its effects and advantages of innovation performance. The method and types of questions used in innovation surveys are described in the Olso Manual (OECD, 1996). CIS data have been used in over 60 recent academic articles, mainly in economics (for recent prominent contributions using CIS data; Cassiman and Veugelers, 2002; Mairesse and Mohnen, 2002).
3.2. Quality level and innovation areas definition
The relationship between firms will determine their quality level established inside the firm. Being certified is a positive signal concerning quality improvement (Terlaak and King, 2006), what influenced decision that certified firms present firms with Top Quality Level established inside firm. The focus on openness and interaction in studies of innovation suggest that the network of relationships between the firm and its external environment can play an important role in shaping performance. So how, dealing with a certified supplier while non-certified improves your signals concerning quality improvement (Diaye et al., 2007). We have here fairly weak relationship in terms of diffusion of quality improvement information, but still the firms in this case present firms with Medium Quality Level. Finally, we classified firms that do not have ISO certification in any case as firms with Low Quality Level.
We used two principal areas of innovation. A Product innovation presents introduction of new product (service) on the market or significant improvement of one product (service) that will meet customer demand. Under this category we will analyze new or improved product for the firm, turnover due to new or improved products, new or improved products on the market and share of new or improved products to the market. The approach we called a Process innovation combines the adoption of a process view of the business with the application of innovation to key processes. We distinguish three types of process innovation that represent our dependent variables: process innovation in general, technologically new process and new process without technological part. Furthermore we will create the third category, innovation activities, that include variables such as total innovation expenditure and number of innovation projects.
We want in this paper, to study the positive effect of the quality level on innovation performance: INNOi =
α
+β
iISOi+ε
1iwhere βi are slope coefficients to be estimated, and α and ε are the intercept and the error term, respectively. The model of firms’ innovation choice is stated as a discrete-choice model, with the variables indicating innovation (product innovation, process innovation or innovation activities), as the dependent variables INNOi.
Following the above we formulate the following hypotheses:
H1: Firms with well established quality system will improve their innovation performance.
Furthermore, we want to verify the claim that improvement of innovation performance varies on quality level that already exists inside the firm.
We want to provide an empirical answer to the question whether the position inside the quality hierarchy that suggest the quality level established inside the firm, is positively correlated with innovation performance level (ij). The i1, i2, i3, are respectively the innovation performance level of the firms with the Top Quality Level, the Medium Quality Level and the Low Quality Level.
From an empirical standpoint, we will either look at the ordering i1 > i2 > i3. As above “INNO” will be an innovation performance variable (product, process innovation and innovation activities). INNOi is therefore the innovation performance variable of firm i. INNOi writes: INNOi = Z1i + Z2i here Z1i is the innovation performance due to all other factors but the quality level inside the firm, and Z2i is the innovation performance level due to the quality level inside the firm.
Let: Z1i =
β
0 +β
1QUAL1i + …..+β
p QUAL pi +ε
1i where the QUAL 1 ,…., QUAL p are variables which explained Z1i andZ2i = i1χiqual1i + i2χiqual2i + i3χiqual3i + ε2i if we look at the ordering i1 > i2 > i3 .
Of course, the χiqual1i, χiqual2i , χiqual3i are the characteristic functions equal to 1 if firm i belongs to the corresponding category and 0 otherwise; and ε1i , ε2i are error terms.
We will estimate:
where εi are error term.
This model is equivalent respectively to:
INNOi =
α
0 +β
1 QUAL 1i + …..+β
p QUAL pi + i’2χ
qual2i + i’3χ
qual3i +ε
i. As a consequence testing i1 > i2 > i3 in the modelINNOi =
β
0 +β
1QUAL1i + …..+β
pQUALpi + i1χ
qual1i + i2χ
qual2i + i3qualχ
3i +ε
i is equivalent to test 0 > i’2 > i’3. The model estimation is presented in Appendix C.Consequently, we formulate the following hypothesis:
H2: Different levels of quality improve differently the innovation performance.
However the quality level inside the firm may not be random and may depend to the firms’ individual characteristics. Propensity score technology used in section 3.5. allow correcting the selection bias by matching firms according to their propensity score which is the estimated probability of receiving treatment (quality level inside the firm) given background characteristics. The results could be compared with OLS estimation (see Appendix C).
3.3.1. Propensity Score Estimates-estimation strategy
The results of Rosenbaum and Rubin (1983) help constructing a group of untreated firms, we may then be able to say something about the effect of different quality levels on, e.g., innovation performance. The untreated group could be for instance composed of firms that are similar to the treated firm, with respect to size, industry, human capital etc. These groups firms are formed by the propensity score matching estimator i.e. the estimated probability of receiving treatment given background covariates. To precise, in our case the treatment that firm receive presents quality level.
We will use a non parametric Kernel matching. This procedure was extensively studied by Heckman and his co-authors in a series of papers where the matching principle is extended through kernel or nearest neighbour techniques to provide a non parametric estimate of the treatment effect given the value of the propensity score (Heckman, Ichimura and Todd, 1997,
1998,). Moreover, since in order to estimate the treatment effect we have to construct for each treated firm a counterfactual from firms in the non treated population, we must have a set of non treated firms which have propensities scores close to the propensity score of the treated firm. In other words a counterfactual can only be constructed for the firms whose propensity score belongs to the intersection between the support of the propensity score distribution of the treated firms and the support of the propensity score distribution of the non treated firms. Consequently an important point in the estimation concerns the determination of the common support of the propensity score distributions.
The innovation performance variable was denoted INNO and that INNO is either the product innovation, process innovation or innovation activities. To test the existence of positive effect between quality and innovation, we will consider, as we said, being certified or being on certain quality level as the treatments and evaluate the effect of each treatment on INNO. Let us note T, a binary variable indicating if the firm received or not a treatment (quality) (T = 1 if the individual is treated, T = 0 if not). The efficiency of the treatment is measured through the resultINNO . Thus each firm will have two potential results: i INNO (if T = 0) and 0 INNO (if 1 T = 1). INNO and 0 INNO are never observed simultaneously, since an individual either is 1 treated, or untreated, but never both at the same time. In other words, only the true level of the firm, noted Y, is observed: Y =INNO T1 +INNO0(1−T).
Only the couple (Y, T) is observed for each firm. Rubin (1974) defines the average treatment effect as the difference between what would be the health of an individual if he was treated and what it would be if he was not, in our case it presents the difference of impact of firm that receive quality and what the impact would be if firm did not receive quality: C = INNO1 - INNO0. The average treatment effect is unobservable and individual, and consequently its
distribution is not identifiable. If property of independence is
respected(INNO INNO0, 1)⊥T , there would be no selection bias.
Thus three quantities are of interest to us: C=E [INNO1-INNO0] is the average treatment effect over the whole population; C1 = E [INNO1-INNO0 | T = 1] is the average treatment effect over treated firms and C0 = E [INNO1-INNO0 | T = 0] is the average treatment effect over non-treated firms. For each dependent variable, we will estimate the quantities C, C1 and C0. The first step in selecting comparable individuals, therefore, is to estimate a Probit model of choosing one of the Quality Level categories and derive the corresponding propensity score (PS). The intuition behind the PS matching is that individuals with the same probability of “treatment” can be paired for purpose of comparison. In our setting, it describes the likelihood
of choosing one of the Quality Level categories for every firm in the sample. In the next step, for example, ISO adopter firms are matched to Non ISO adopter firms based on their estimated probability of belonging to the treatment group, given by the distance metric PS = P(X) (Rosenbaum and Rubin, 1983). We apply nearest neighbour matching with replacement, where for each ISO adopter firms that one Non ISO adopter firm with the closest PS is selected.
3.3.2. Descriptive Statistics
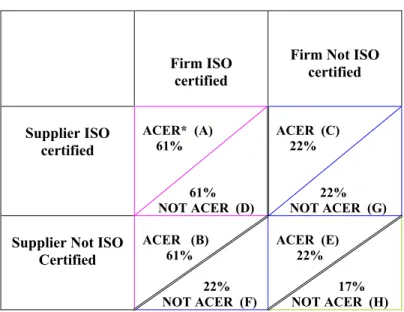
Tables 1 and 2 provide descriptive statistics for the three quality levels. The distribution of each firms’ Quality Level is presented in table 1.
Table 1. Distribution of three categories Quality levels
Firm ISO certified
Firm Not ISO certified Supplier ISO certified ACER* (A) 61% 61% NOT ACER (D) ACER (C) 22% 22% NOT ACER (G) Supplier Not ISO
Certified ACER (B) 61% 22% NOT ACER (F) ACER (E) 22% 17% NOT ACER (H)
Source: Survey COI merges to the CIS3, sample 1146 companies, not weighted by the number of employees. Parameter: manufacturing industries of more than 20 employees.
* Other system of certification or total quality
As we can see from the table 1 Top Quality level firms present categories A, B and D and they include 61% of total number of firms. Further more, Medium Quality Level firms are presented by C, E, F and G categories what include 22%. Low Quality level firms are presented by category H with 17% of firms.
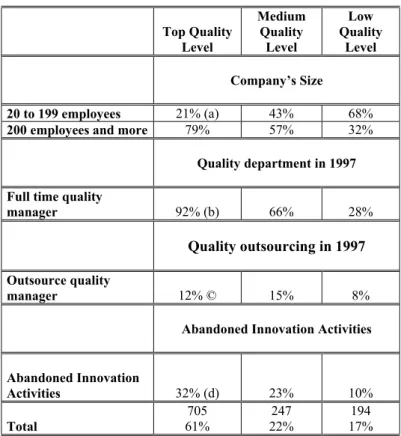
Table 2. Descriptive Statistics Top Quality Level Medium Quality Level Low Quality Level Company’s Size 20 to 199 employees 21% (a) 43% 68%
200 employees and more 79% 57% 32%
Quality department in 1997 Full time quality
manager 92% (b) 66% 28%
Quality outsourcing in 1997 Outsource quality
manager 12% © 15% 8%
Abandoned Innovation Activities
Abandoned Innovation Activities 32% (d) 23% 10% Total 705 61% 247 22% 194 17%
Source: Survey COI merges to the CIS3, sample 1146 companies, not weighted by the number of employees. Parameter: manufacturing industries of more than 20 employees.
Lecture: (a) 21% of firms with top quality level are companies that have from 20 to 49 employees (category-small company).
Lecture: (b) 92% of firms with top quality level are companies that have quality department.
Lecture: (c) 12% of firms with top quality level are companies that ask services of quality form external partners. Lecture: (d) 32% of firms with top quality level are companies that have abandoned certain innovation activities.
We can assume that the firm size influences positively its propensity to choose among the three types of quality levels. Furthermore, the quality department is dispersed in each category of quality levels, but still the percentage of concentration is positively related with quality level established inside the firm. On the other hand, there is small number of companies (in each quality level category) that use quality service from their external partners. Finally we offer descriptive statistics regarding Abandoned Innovation Activities. In our sample, the majority of companies that abandoned innovation activities seem to belong to category of Top Quality Level (32%). The results do not mean inevitably that companies under category Top Quality Level have the highest percentage of innovation failure, it could indicate that those firms are the most innovative.
3.4. Results
3.4.1. Determinants of the ISO adoption and Quality Levels
The important part of PS-estimates is defining the determinants of being ISO certified or being on certain level of quality (table 3). The first group of variables that we have used is firm’s size and sector of activity. We found the same results as in the literature relating the effect of firm’s size or sector of activity on the adoption of ISO certification (Anderson et al., 1999; Terlaak and King, 2006). Generally, the firm’s size mainly determines firm possibility (in sense of financial resources) to choose one of the categories of Quality Levels. We can note in Table 3 variables concerning the company’s size are positive and significant for the four logistic regressions. We have used 11 sectors of different activities and as a reference the sector of textile and mineral industries. As in the literature, we find out that the probability to be ISO certified in stronger in some industries like the electrical, metal, construction, mechanical equipment industries.
Concerning the features of the company’s strategy, we can see from Table 3 that for our four logistic regressions and for the two variables (cost reduction, new procedure), the coefficients, when they are significant, are positive. When cost reduction and new procedure are important or very important for the company’s strategy, they will increase the company’s probability of being quality certified. When comparing Medium Quality Level firms to Low Quality level firms, there is no variable that plays in the decision to belong to Medium Quality Level firms.
Concerning the external market’s constraints, one can remark that the variables “competitive pressure, uncertainty on the market and suppliers-conditioned” seems to play no role in determining the firm’s probability to be ISO certified or the firm’s quality position. Clients’ conditions have important impact on choosing between Top Quality Level firms and Low Quality Level firms or Medium Quality Level Firms and Low Quality level firms. If we look at the variable stockholders-conditioned the coefficients, when significant, are positive. This tells us that when stockholders’ condition is an important external constraint, firms will adopt quality systems.
Table 3. Determinants of choosing the ISO certification and Quality Levels
Source: Survey COI merges to the CIS3, sample of 732, 705, 247 and 194 companies, respectively. Parameter: manufacturing industries of more than 20 employees.
Notes: (*), (**) and (***) indicate parameter significance at the 10, 5 and 1 percent level respectively.
(H1) ISO Certified Firms
vs ISO Non Certified firms (ref)
(H2) Top Quality Level vs Medium Quality Level (ref) (H2) Top Quality Level vs Low Quality Level (ref) (H2) Medium Quality Level vs Low Quality Level (ref) Intercept -1.81*** -0.93** -3.11*** -1.78***
Size of the company Ref = 20 to 199 employees
200 employees and more 1.56*** 1.09*** 2.50*** 1.28***
Features of the company’s strategy Ref = Less Important and Not Important
Quality improvement -0.27 -0.34 -0.19 0.49
Cost reduction 0.56** 0.59* 0.51 0.22
New process 0.27* 0.30* 0.56* -0.02
External market's constraints
Competitive pressure-yes 0.07 0.11 0.22 0.21
Uncertainty on the market-yes -0.00 -0.04 0.39 0.06
Clients conditioned- yes 0.16 -0.01 0.74** 0.46*
Suppliers conditioned-yes -0.13 -0.05 -0.20 -0.13
Stockholders conditioned-yes 0.40** 0.26 0.68** 0.35
Sector of Activity Ref = textile and mineral industries
Industry of leather and wearing -1.92*** -1.14* -2.69*** -1.26**
Industry of edition, printing and
reproduction -1.90*** -1.01* -2.80*** -1.19**
Pharmaceutical industry,
manufacture of soap, perfumes and care products
-0.48 -0.79** 1.10* 1.43***
Industry of home equipment -0.08 -0.14 0.29 0.24
Car Industry 1.81*** 1.74*** 2.11*** 0.65
Naval construction , railroad materials/ Manufacture of electric and electronic equipment
1.51*** 1.01*** 2.93*** 1.31*
Manufacture of mechanical
equipment 1.31*** 0.92*** 1.98*** 1.10**
Manufacture of paper and wood/
chemistry, rubber and plastic 1.12*** 0.95*** 1.70*** 0.76**
Manufacture of metal transformation/
Manufacture of electric corposants
2.08*** 1.67*** 3.00*** 1.55***
Manufacture of carburant/
Electricity, gas and water supply 0.80** 0.98** 1.45** 0.32
3.5. Discussion of the PS- matching results
We will first introduce the PS-matching results and then compare these results with the naïve ones, revealing some selection effects. The findings provide empirical evidence that ISO 9000 certification significantly and positively contributes to innovation, in terms of products (New or improved products for the firm, Turnover due to new or improved products, New or improved products on the market and Share of new or improved products to the market), processes (Technologically new process) and innovation activities (Total innovation expenditure and Number if innovation projects). From these results we tend to conclude that ISO 9000 certification has positive impact on the innovation performance, but not on all area of innovation (table 4). Finally the comparison of the results of the naïve estimates with the results of the PS-matching provides empirical evidence of selection effects. Indeed in general, the figures of the naïve estimates are different (and higher) than those of the PS-matching. For example, in Table 4, the mean difference in terms of new or improved products for the firm innovation between ISO Adopters and Non Adopters is 0.27 (significant at 1%) while this difference is only 0.12 (significant at 1%).
Moreover the fact that principal actor (firm) are certified permits the firms with Top Quality Level to have the strongest impact on the innovation performance. Once more we have to precise that this is true only for certain area of innovation. From the Tables 5a and 5b we can see that impact on the innovation of firms with Top Quality Level is greater than firms with Medium and Low Quality Level. Finally, the last Table 5c provides conclusion where there is some differences between the effects on the innovation of firms with Medium and Low Quality Level including areas of new or improved products of the firm, new or improved products on the market, total innovation expenditure and number of innovation projects. We can conclude that even Medium Quality Level firms do not have well established quality system, their signal trough other certification or indirect signal could arrive to impact positively innovation performance.
Table 4. PS-matching estimates-Impact of Quality on Innovation Performance (H1) (a)
Global Treated Non-treated Difference of Mean Effect on Product
(ISO Certified Firms vs ISO Non Certified Firms)
New or improved products for the firm
012** 0.11** 0.12*** 0.27***
Turnover due to new or improved products
0.03*** 0.03*** 0.02** 0.05***
New or improved products on
the market 0.11** 0.10*** 0.12** 0.21
Share of new or improved
products to the market 0.03*** 0.03** 0.03** 0.03
Effect on Processes (ISO Certified Firms vs ISO Non Certified Firms)
New or improved processes for the firm
0.06 0.05 0.05 0.19***
Technologically new process 0.08** 0.07** 0.09** 0.15***
New process without technological part
-0.01 -0.02 -0.01 0.05***
Effect on Innovation Activities
(ISO Certified Firms vs ISO Non Certified Firms)
Total innovation expenditure 0.27** 0.32** 0.18 0.39***
Number of innovation
projects 0.09** 0.08* 0.10** 0.25***
Source: Survey COI merges to the CIS3, sample 1146 companies. Parameter: manufacturing industries of more than 20 employees.
The regression integrates 11 indexes of industries that correspond to NAF 36 (reference: textile and mineral industries). Notes: (*), (**) and (***) indicate parameter significance at the 10, 5 and 1 percent level respectively.
Table 5a. PS-matching estimates-The difference between impact of Top and Medium Quality Level on Innovation performance (H2) (a)
Global Treated Non-treated Difference of Mean Effect on Product
(Top Quality Level vs Medium Quality Level)
New or improved products for the firm
0.09* 0.9* 0.07 0.17***
Turnover due to new or improved products
0.03*** 0.04*** 0.03** 0.04***
New or improved products on
the market 0.08** 0.09** 0.07* 0.15***
Share of new or improved
products to the market 0.03*** 0.03*** 0.03*** 0.03***
Effect on Processes
(Top Quality Level vs Medium Quality Level)
New or improved processes for the firm
0.08* 0.07 0.09** 0.14***
Technologically new process 0.12** 0.11** 0.13*** 0.21***
New process without technological part
-0.00 0.00 -0.00 0.04
Effect on Innovation Activities (Top Quality Level vs Medium Quality Level)
Total innovation expenditure
0.23** 0.25** 0.20* 0.20*
Number of innovation projects 0.05 0.5 0.05 0.13***
Source: Survey COI merges to the CIS3, sample 1146 companies. Parameter: manufacturing industries of more than 20 employees.
The regression integrates 11 indexes of industries that correspond to NAF 36 (reference: textile and mineral industries). Notes: (*), (**) and (***) indicate parameter significance at the 10, 5 and 1 percent level respectively.
Table 5b. PS-matching estimates-The difference between impact of Top and Low Quality Level on Innovation performance (H2) (a)
Global Treated Non-treated Difference of Mean Effect on Product
(Top Quality Level vs Low Quality Level)
New or improved products for the firm
0.22*** 0.22*** 0.21*** 0.41***
Turnover due to new or improved products
0.02 0.02 0.03 0.06**
New or improved products on
the market 0.16** 0.17** 0.12** 0.31***
Share of new or improved
products to the market 0.03** 0.03** 0.03** 0.04**
Effect on Processes
(Top Quality Level vs Low Quality Level)
New or improved processes for the firm
0.09 0.11 0.05 0.24**
Technologically new process 0.06 0.08 0.04 0.24
New process without technological part
-0.02 -0.02 -0.03 0.09
Effect on Innovation Activities (Top Quality Level vs Low Quality Level)
Total innovation expenditure
0.63*** 0.70*** 0.45** 0.65***
Number of innovation projects 0.15** 0.15** 0.15** 0.37***
Source: Survey COI merges to the CIS3, sample 1146 companies. Parameter: manufacturing industries of more than 20 employees.
The regression integrates 11 indexes of industries that correspond to NAF 36 (reference: textile and mineral industries). Notes: (*), (**) and (***) indicate parameter significance at the 10, 5 and 1 percent level respectively.
Table 5c. PS-matching estimates- The difference between impact Medium and Low Quality Level on Innovation performance (H2) (a)
Global Treated Non-treated Difference of Mean Effect on Product
(Medium Quality Level vs Low Quality Level)
New or improved products for the firm
0.18*** 0.19*** 0.18*** 0.24***
Turnover due to new or improved products
0.02 0.02 0.02 0.02**
New or improved products
on the market 0.11** 0.10** 0.11** 0.16***
Share of new or improved
products to the market 0.01 0.01 0.01 0.01**
Effect on process
(Medium Quality Level vs Low Quality Level)
New or improved processes for the firm
0.02 0.02 0.02 0.10**
Technologically new process -0.01 -0.02 -0.00 0.03
New process without technological part
-0.02 -0.01 -0.01 0.04
Effect on Innovation Activities (Medium Quality Level vs Low Quality Level)
Total innovation
expenditure 0.26** 0.31** 0.21* 0.45***
Number of innovation projects
0.16** 0.16** 0.15** 0.24***
Source: Survey COI merges to the CIS3, sample 1146 companies. Parameter: manufacturing industries of more than 20 employees.
The regression integrates 11 indexes of industries that correspond to NAF 36 (reference: textile and mineral industries). Notes: (*), (**) and (***) indicate parameter significance at the 10, 5 and 1 percent level respectively.
4. CONCLUSION
This paper permits to map out a more comprehensive relationship between quality and innovation. The objective of this paper was to use the selective matching methods to estimate the causal effects of quality management system on innovation performance. This paper gives us an answer on existing contradiction in the literature concerning the relationship between quality management system and innovation performance. The evidence was found to be consistent with the first hypothesis stating that there is a positive and significant relation between quality system and innovation performance. However, it seems that there are certain fields of innovation where quality system has no significant effect.
In response to second hypothesis, the findings indicate a positive and significant relationship between quality levels and innovation performance for certain areas of innovation, particularly between Top and Medium level and Top and Low level. On the other hand there are low-level difference between Medium and Low quality level and their effect on innovation. More precisely, Medium Quality Level firms have possibility to impact innovation in certain areas thought other certification or indirectly thought ISO certification (via suppliers). Further more, interesting business strategy for firms belonging to Low Quality Level is to avoid costly process to reach Top Quality Level, they could only switch one position on the hierarchy, becoming Medium Quality Level they have possibility to improve their innovation performance.
Still, firms that want to pursue a high innovation performance must have the capability to manage quality requirements, in other words, quality management system is a prerequisite for innovation performance, and therefore other certification or indirect certification (thought suppliers) is not sufficient for improvement of the innovation performance.
The novelty of this article is that using different indicators of innovation, we better understand the complex relationship between quality and innovation performance.
References
Acemoglu, D., Aghion, P., Lelarge, C., Van Reenan, J. and Zilibotti, F., (2007) “Technology, Information and the Decentralization of the Firm”. Quarterly Journal of Economics (forthcoming).
Anderson, S.W., Daly, J.D. and Johnson, M.F., (1999) “Why firms seek ISO 9000 certification: Regulatory compliance or competitive advantage”? Production & Operations Management, Vol. 8, no 1, pp. 28-43.
Aubert, P., Caroli, E. and Roger, M., (2000) “New Technologies, Organisation and Age: firm-Level Evidence”. Economic Journal, Vol. 116, pp. 73-93.
Cassiman, B. and Veugelers, R., (2002) “Spillovers and R&D cooperation: some empirical evidence”. American Economic Review, Vol. 92, No. 4, pp. 1169–1184.
Cohen, W., (1995) “Empirical Studies of Innovative Activities”. In: Stoneman, P. (Ed.), Handbook of the Economics of Innovation and Technological Change. Blackwell, Oxford, pp. 182-264.
Crépon, B., Duguet, E. and Mairesse, J., (1998) “Research, Innovation and Productivity: an Econometric Analysis at the Firm Level”, NBER Working Paper, No. W6696.
Daft, R.L., (1978) “A Dual-Core Model of Organizational Innovation”. Academy of Management Journal, Vol. 21, no 2, pp. 193-210
Damanpour, F. and Evan, W.M., (1990) “The adoption of innovations over time: structural characteristics and performance of organizations”. Proceedings of the National Decision Science Institute Conference, San Diego.
Dean, J.W. and Evans, J.R., (1994) “Total Quality: Management, Organization and Strategy”. West Publishing, Minneapolis, MN.
Dewar, R. D. and Dutton, J. E., (1986) “The adoption of radical and incremental innovations: An
empirical analysis”. Management Science, Vol. 32, pp. 1422-1433.
Diaye, M-A., Ghabri, S., Greenan, N. and Pekovic, S., (2008) “ISO 9000 Norm as a Club Good: Network Effect Evidence from French Employer Survey”, mimeo CEE.
Encaoua, D., Hall, B., Laisney, F. and Mairesse, J., (2000) “The Economics and Econometrics of Innovation”. Kluwer, Boston.
Ettlie, J. E., Bridges, W. P. and O'Keefe, R. D., (1984) “Organization strategy and structural differences
for radical versus incremental innovation”. Management Science, Vol. 30, pp. 682-695.
Flynn, B. B., (1994) “The relationship between quality management practices, infrastructure and fast product innovation”. Benchmarking for Quality Management and Technology, Vol.
Galia, F. and Legros, D. (2004) “Research and Development, Innovation, Training, Quality and Profitability: Econometric Evidence from France”, Working Paper ERMES-CNRS No. 04-11.
Glynn, M.A., (1996) “Innovative genius: a framework for relating individual and organizational intelligences to innovation”. Academy of Management Review, Vol.21, pp. 1081–1111.
Heckman, J., Ichimura, H. and Todd, P., (1998) “Matching as an Econometric Evaluation Estimator”. Review of Economics Studies, Vol.65, pp.261-294.
Heckman, J., Ichimura H. and Todd P., (1997) “Matching as an Econometric Evaluation Estimator: Evidence from Evaluating a Job Training Programme”. Review of Economics Studies, Vol. 64, pp.605-654.
Ireland, R.D. and Hitt, M.A., (1997) “Performance Strategies for High-Growth Entrepreneurial Firms” in Frontiers of Entrepreneurship Research. Ed. Reynolds, P.D., Bygrave, W.D., Carter, N.M., Davidsson, P., Gartner, W.B.,. Mason, C.M., McDougall P.P., Wellesley, M.: Babson College, pp. 90-104.
ISO, (1998, 2001) ISO 9000-Selection and Use-ISO Technical Committee ISO/TC 176, International Standard Organisation.
Jha, S., Noori, H. and Michela, J.L., (1996) “The Dynamics of Continuous Improvement: Aligning Organisational Attributes and Activities for Quality and Productivity”. International Journal of Quality Science, Vol.1, no 1, pp.19-47.
Kanji, G.K., (1996) “Can total quality management help innovation”? Total Quality Management, Vol.7, no 1, pp.3-9.
Kanter, R.M., (1983) “The Change Master—Innovation and Entrepreneurship in The American Corporation”. Simon & Schuster, New York.
Kimberly, J.R. and Evanisko, M., (1981) “Organizational innovation: the influence of individual, organizational and contextual factors on hospital adoption of technological and administrative innovations”. Academy of Management Journal, Vol. 24, pp. 689–713.
Kleinknecht, A. and Mohnen, P., (2001) “Innovation and Firm Performance: Econometric Explorations of Survey Data”. Palgrave, Hampshire and New York.
Knight, K.E., (1967) “A descriptive model of intra-firm innovation process”. Journal of Management, Vol. 41, pp. 478–496.
Linder, J.C., Jarvanpaa, S. and Davenport, T., (2003) “Towards an Innovation Sourcing Strategy”. MIT Sloan Management Review, Vol. 44, pp. 4.
Mahesh, C., (1993) “Total quality management in management development”. Journal of Management Development, Vol. 12, no 7, pp. 19–31.
Mairesse, J. and Mohnen, P., (2002) “Accounting for innovation and measuring
innovativeness: an illustrative framework and an application”. American Economic Review, Vol. 92, no 2, pp. 226–231.
Milgrom, P. and Roberts, J., (1990) “The Economics of Modern Manufacturing: Technology, Strategy, and Organization”. American Economic Review, Vol. 80, no 3, pp. 511-528.
Nowak, A., (1997) “Strategic relationship between quality management and product innovation”. The Mid-Atlantic Journal of Business, Vol. 33, no 2, pp. 119-35.
OECD, (1996) “The Measurement of Scientific and Technological Activities” - Oslo Manual. Paris.
Rao, S., Ragu, T. S. and Solis, L. E. (1997) “Does ISO 9000 Have an Effect on Quality Management Practices? An International Empirical Study”. Total Quality Management, Vol. 8, no 6, pp. 335-346.
Roffe, I., (1999) “Innovation and creativity in organisations: a review of the implications for training and development”. Journal of European Industrial Training, Vol., pp. 224–237. Rosenbaum, P.R. and Rubin, D. (1983) “The Central Role of the Propensity Score in Observational Studies for Causal Effects”. Biometrika, Vol.1, pp 41-55.
Slater, S.F. and Narver, J.C., (1998) “Customer-Led and Market-Oriented: Let's Not Confuse the Two”. Strategic Management Journal, Vol.19, pp.1001-1006.
Tang, H.K., (1998) “An integrative model of innovation in organizations”. Technovation , Vol.18, no 5, pp. 297–309.
Terlaak, A. and King, A. (2006) “The effect of certification with ISO 9000 Quality Management Standard: A signalling Approach”. Journal of Economic Behaviour and Organization, Vol. 4, pp. 579-602.
Utterback, J.M., (1971) “The process of technological innovation within the firm”. Academy of Management Journal, Vol. 14, pp. 75–88.
Wind, J. and Mahajan, V., (1997) “Issues and Opportunities in New Product Development: An Introduction to the Special Issue”. Journal of Marketing Research, Vol. 34, pp.1-12
Zairi, M., (1994) “Innovation or Innovativeness, results of a benchmarking study”, TQM Magazine, Vol 5, no 3, pp. 10-16.
Appendix A.
Variables from the COI and CI data sets
1) VARIABLES FROM THE COI SURVEY
FEATURES OF THE COMPANY’S STRATEGY (control variables)
What is the importance of the following factors concerning the general strategy of your company? Not much important Quite important Important Very important Q11 Quality improvement 1 2 3 4 Q14 Cost reduction 1 2 3 4 Q15 New procedure 1 2 3 4
EXTERNAL MARKET’S CONSTRAINTS (control variables) Between 1994 and 1997, which constraints have influenced the choice of your company concerning… Q2XORG for organisation and Q2XINF for computerisation ...of the organization ...of the computerisation Yes No Yes No Q21 Competitive pressure 1 2 1 2
Q22 Uncertainty on the market 1 2 1 2
Q23 Clients conditioned 1 2 1 2
Q24 Suppliers conditioned 1 2 1 2
Q27 Stockholders conditioned 1 2 1 2
QUALITY DEPARTMENT AND EXTERNAL PARTNERS (descriptive statistics table 1) In 1997 Created since 1994 In 1997 Evolution since 1994 Does your company employ full time managers for
each of the following functions?
Does your company outsource managers for for
each of the following functions? Yes No Yes No Yes No + = -
Q35CA97 /Q35PR97 Quality 1 2 1 2 1 2 1 2 3
HAVING ISO CERTIFICATION IN 1994 AND 1997 (used for creation of variable for treatment) In 1997 Change in the % of employees
affected since 1994 Does your company use the following? Q4X97
for 97 and Q4XEV for evolution?
Yes No + = -
Q41 Certification ISO 9001, ISO 9002, 1 2 1 2 3
OTHER TYPES OF CERTIFICATION (descriptive statistics Table 1)
Yes No + = -
Other system of certification or
HAVING ISO CERTIFIED SUPPLIERS IN 1994 AND 1997 (used for creation of variable for treatment) In 1997 did your company ask certain suppliers
or subcontractors
Yes No
Q103 … to conform to ISO norms or to others quality norms? 1 2
2) VARIABLES FROM THE CIS3 SURVEY
Innovation is defined as major changes aimed at enhancing your competitive position, your performance, your know-how or your capabilities for future enhancements. These can be new or significantly improved goods, services or processes for making or providing them. It includes spending on innovation activities, for example on machinery and equipment, R&D, training, goods and service design or marketing.
1. Product innovation
Product innovation is a good or service which is either new or significantly improved with respect to its fundamental characteristics, technical specifications, incorporated software or other immaterial components, intended uses, or user friendliness.
The innovation should be new to your enterprise; it has not necessarily to be new to the market. It does not matter whether the innovation was developed by your enterprise or by another enterprise.
A product innovation is the market introduction of a new good or service or a significantly improved good or service with respect to its capabilities, such as quality, user friendliness, software or subsystems. The innovation must be new to your enterprise, but it does not need to be new to your market. It does not matter if the innovation was originally developed by your enterprise or by other enterprises. Changes of a solely aesthetically nature, and purely selling of innovations wholly produced and developed by other enterprises, shall not be included.
1.1 During the period 1998-2000, did your enterprise introduce onto the market any new or significantly improved products (goods or services) for your enterprise? INPDT
1.3 Please estimate how your turnover in 2000 was distributed between
- New or significantly improved products (goods or services) introduced during the period 1998–2000 % TURNIN
1.4 During the period 1998-2000, did your enterprise introduce new or significantly improved products (goods or services) not only new for your enterprise, but also new for your enterprise's market?
Yes _ =>Please estimate the contribution of these products in total turnover in 2000: % TURNMAR
2. Process innovation
Process innovation includes new and significantly improved production technology, new and significantly improved methods of supplying services and of delivering products. The outcome should be significant with respect to the level of output, quality of products (goods/services) or costs of production and distribution.
The innovation should be new to your enterprise; your enterprise has not necessarily to be the first to introduce this process. It does not matter whether the innovation was developed by your enterprise or by another enterprise. Purely organisational or managerial changes shall not be included.
2.1 During the period 1998-2000, has your enterprise introduced any new or significantly improved production processes including methods of supplying services and ways of delivering products?
2.3 Was it at least one of those processes:
a - technologically new or modified (with combination of new technologies). b - new (or modified) but without technological part .
3. Not yet completed or abandoned innovation activities
3.1 By the end of 2000, did your enterprise have any ongoing activities to develop or introduce new or significantly improved products (goods or services) or processes that were not yet completed, including any R&D activity?
4. Innovation activities in 2000
4.1 Did your enterprise engage in the following innovation activities in 2000? -Total innovation expenditure in 2000 RTOT
(in national currency units)
Appendix B. Mean of Innovation Table B. Mean of Innovation Performance
Source: Survey COI merges to the CIS3, sample 1146 companies.
Parameter: manufacturing industries of more than 20 employees.
The regression integrates 11 indexes of industries that correspond to NAF 36 (reference: textile and mineral industries).
ISO 9000 Certified Firms ISO 9000 Non Certified Firms Top Quality Level Medium Quality Level Low Quality Level New or improved products for the firm
0.68 0.41 0.69 0.52 0.28
Turnover due to new or improved products
0.11 0.06 0.11 0.07 0.05
New or improved
products on the market 0.46 0.25 0.47 0.32 0.16
Share of new or improved products to the market
0.06 0.03 0.06 0.03 0.02
New or improved processes for the firm
0.49 0.30 0.49 0.35 0.25
Technologically new process
0.33 0.18 0.40 0.19 0.16
New process without technological part 0.17 0.12 0.18 0.14 0.09 Total innovation expenditure 0.89 0.50 0.90 0.70 0.25 Number of innovation projects 0.62 0.37 0.62 0.49 0.25
Appendix C. OLS Results
We want to estimate using the OLS the models INNOi = α+ βiISOi+ ε1i
and INNOi = β0 + β1QUAL1i + …..+ βpQUALpi + i1χqual1i + i2χiqual2i + i3χqual3i + εi. Using first
model we will try the answers the question does quality have positive impact on the innovation performance. The second model will answer the second objective of our paper, does impact on innovation performance differ positively depending on quality level established in firm.
Independent variables that we will use for both OLS models are: ISO 9000 certification, the firm’s size, features of company’s strategy, external market constraints, similar experience, the sectors (11 sectors according to the so-called NAF 36).
The discussion starts with our first objective. The first results (table C1a) suggest that ISO 9000 certification has positive impact on all categories of product innovation. Furthermore, from the table C1b we observe that independent variable ISO 9000 is positive and significant only for technologically new process, but not for the other two variables. Finally, the results of innovation activities (table C1c) suggest that quality has positive impact for both categories of innovation activities.
We continue with our second model of OLS. In the category product innovation (table C2a) results are same for four dependant variables. The product innovations of Top Quality Level firms are better than those of the firms with Medium Quality Level which are higher than those of the firms with Low Quality Level. These findings suggest that having well-established quality system amplifies a positive effect on the innovation performance, however thanks to the other certification or network effect a non-certified firm dealing with non-certified suppliers (firms with Medium Quality Level) can improve their innovation performance.
The category the process innovation (table C2b) provides us interesting results. In the models new or improved process and technologically new process there are positive correlation between quality levels and innovation only for firms representing Top and Medium Quality levels.
The last category of innovation performance concerns innovation activities (table C2c), findings suggest that there is a positive correlation between the hierarchy of quality levels and the impact on innovation expenditure, it starts with firms with Top Quality Level, firms with Medium Quality Level and on the last position are firms with Low Quality Level. Moreover, Medium Quality Level firms have no impact on number of innovation projects.
However since these results do not take into account the selection effects it may be the case that they are biased.
Table C1a. Effect of Quality on the Product Innovation
Source: Survey COI merges to the CIS3, sample 1146 companies. Parameter: manufacturing industries of more than 20 employees.
The regression integrates 11 indexes of industries that correspond to NAF 36 (reference: textile and mineral industries). Notes: (*), (**) and (***) indicate parameter significance at the 10, 5 and 1 percent level respectively.
New or improved product for the firm
Turnover due to new or improved products New or improved product on the market Share of new or improved product on the market Intercept 0.24*** 0.03 0.19*** 0.02 ISO Certification Certified by ISO 9000 0.11*** 0.02** 0.09*** 0.02***
Size of the company Ref = 20 to 149 employees
200 employees and more 0.27*** 0.03*** 0.19*** 0.01
Features of the company’s strategy Ref = Less Important and Not Important
Quality improvement 0.06* -0.01 -0.06 -0.01
Cost reduction -0.01 0.01 0.01 0.00
New process 0.00 0.00 0.03 0.01
External market's constraints
Competitive pressure-yes 0.02 0.01 0.02 -0.00
Uncertainty on the
market-yes -0.00 0.01 -0.02 0.01*
Clients conditioned- yes -0.05* -0.02* -0.06* -0.02*
Suppliers conditioned-yes 0.02 0.00 0.00 0.01
Stockholders conditioned-yes -0.02 0.00 0.03 0.02**
Table C1b. Effect of Quality on the Innovation Processes
Source: Survey COI merges to the CIS3, sample 1146 companies. Parameter: manufacturing industries of more than 20 employees.
The regression integrates 11 indexes of industries that correspond to NAF 36 (reference: textile and mineral industries). Notes: (*), (**) and (***) indicate parameter significance at the 10, 5 and 1 percent level respectively.
New or improved process for the firm
Technologically new process
New process without technological part
Intercept -0.01 -0.04 0.06
ISO 9000 certification
Certified by ISO 9000 0.05 0.07** -0.02
Size of the company Ref = 20 to 149 employees
200 employees and more 0.21*** 0.15*** 0.08***
Features of the company’s strategy Ref = Less Important and Not Important
Quality improvement -0.03 -0.03 -0.03
Cost reduction 0.12** 0.08* 0.03
New process 0.06* 0.04 0.02
External market's constraints
Competitive pressure-yes -0.03 -0.04 -0.03
Uncertainty on the
market-yes 0.01 -0.02 0.01
Clients conditioned- yes -0.01 0.02 -0.02
Suppliers conditioned-yes 0.02 0.03 -0.01
Stockholders conditioned-yes -0.00 -0.03 0.07***
Table C1c. Effect of Quality on the Innovation Activities
Source: Survey COI merges to the CIS3, sample 1146 companies. Parameter: manufacturing industries of more than 20 employees.
The regression integrates 11 indexes of industries that correspond to NAF 36 (reference: textile and mineral industries). Notes: (*), (**) and (***) indicate parameter significance at the 10, 5 and 1 percent level respectively.
Logarithm of total Innovation Expenditure Number of innovation projects Intercept 0.18 0.23*** ISO 9000 certification Certified by ISO 9000 0.27*** 0.08**
Size of the company Ref = 20 to 149 employees
200 employees and more -0.04 0.25***
Features of the company’s strategy Ref = Less Important and Not Important
Quality improvement 0.07 0.01
Cost reduction -0.07 0.01
New process 0.15* 0.02
External market's constraints
Competitive pressure-yes -0.09 0.05
Uncertainty on the
market-yes 0.04 -0.05*
Clients conditioned- yes -0.06 -0.03
Suppliers conditioned-yes 0.11 -0.00
Stockholders conditioned-yes 0.03 0.01
Table C2a. Effect of Three Quality Levels on the Product Innovation
Source: Survey COI merges to the CIS3, sample 1146 companies. Parameter: manufacturing industries of more than 20 employees.
The regression integrates 11 indexes of industries that correspond to NAF 36 (reference: textile and mineral industries). Notes: (*), (**) and (***) indicate parameter significance at the 10, 5 and 1 percent level respectively.
New or improved product for the firm
Turnover due to new or improved products New or improved product on the market Share of new or improved product on the market Intercept 0.40*** 0.05* 0.32*** 0.05** Quality Level Ref = Top Quality Level
Medium Quality Level -0.09*** -0.02* -0.08*** -0.02***
Low Quality Level -0.19*** -0.20* -0.14*** -0.03***
Size of the company Ref = 20 to 149 employees
200 employees and more 0.25*** 0.03*** 0.18*** 0.01
Features of the company’s strategy Ref = Less Important and Not Important
Quality improvement 0.06 -0.01 -0.07* -0.01
Cost reduction -0.01 0.01 0.01 0.00
New process 0.00 0.00 0.03 0.00
External market's constraints
Competitive pressure-yes 0.02 0.01 0.03 -0.00
Uncertainty on the
market-yes -0.00 0.01 -0.02 0.01
Clients conditioned- yes -0.06* -0.02* -0.06* -0.01*
Suppliers conditioned-yes 0.02 0.00 0.00 0.01
Stockholders conditioned-yes -0.02 0.00 0.00 0.02**
Table C2b. Effect of Three Quality Levels on the Innovation Processes
Source: Survey COI merges to the CIS3, sample 1146 companies. Parameter: manufacturing industries of more than 20 employees.
The regression integrates 11 indexes of industries that correspond to NAF 36 (reference: textile and mineral industries). Notes: (*), (**) and (***) indicate parameter significance at the 10, 5 and 1 percent level respectively.
New or improved process for the firm
Technologically new process
New process without technological part
Intercept 0.04 0.04 0.04
ISO 9000 certification Ref = Top Quality Level
Medium Quality Level -0.07* -0.10*** 0.01
Low Quality Level -0.04 -0.05 0.03
Size of the company Ref = 20 to 149 employees
200 employees and more 0.22*** 0.16*** 0.08***
Features of the company’s strategy Ref = Less Important and Not Important
Quality improvement -0.03 -0.02 -0.03
Cost reduction 0.12** 0.08* 0.03
New process 0.06* 0.04 0.02
External market's constraints
Competitive pressure-yes -0.03 -0.04 -0.03
Uncertainty on the
market-yes 0.01 -0.02 0.01
Clients conditioned- yes -0.01 0.02 -0.02
Suppliers conditioned-yes 0.02 0.03 -0.01
Stockholders conditioned-yes -0.00 -0.03 0.07***
Table C2c. Effect of Three Quality Levels on the Innovation Activities
Source: Survey COI merges to the CIS3, sample 1146 companies. Parameter: manufacturing industries of more than 20 employees.
The regression integrates 11 indexes of industries that correspond to NAF 36 (reference: textile and mineral industries). Notes: (*), (**) and (***) indicate parameter significance at the 10, 5 and 1 percent level respectively.
Logarithm of total Innovation Expenditure Number of innovation projects Intercept 0.55* 0.33***
Quality Level Category Ref = Top Quality Level
Medium Quality Level -0.24* -0.04
Low Quality Level -0.42*** -0.12***
Size of the company Ref = 20 to 149 employees
200 employees and more 0.14 0.24***
Features of the company’s strategy Ref = Less Important and Not Important
Quality improvement 0.05 0.01
Cost reduction -0.08 0.01
New process 0.15* 0.02
External market's constraints
Competitive pressure-yes -0.09 0.05
Uncertainty on the
market-yes -0.05 -0.06*
Clients conditioned- yes -0.08 -0.04
Suppliers conditioned-yes 0.11 -0.00
Stockholders conditioned-yes 0.02 0.01