Japanese long-term care insurance :
equal services for equal needs?
Karine Ishii ∗†‡
Abstract
In April 2000, a new public long-term care insurance (LTCI) system was launched in Japan. By replacing a social welfare-nature program by a mandatory public insurance, the Japanese governe-ment aimed to provide “equal services for equal needs”. Now that LTCI has been in place for more than 10 years, it is legitimate to examine whether its access is garanteed to all. Using the third wave of Japanese Study of Aging and Retirement (JSTAR) conducted in 2011, this article analyses potential reasons of non-use of LTCI. The study highlights two reasons of non-use : cultural norms and low income. The results show that i) the presence of coliving daughters-in-law and daughters living in the same town reduces the probability of applying for LTCI certification and ii) elderly who have low income are less likely to take the steps in order to benefits from LTCI.
∗
PhD candidate under the supervision of Pierre Ralle and prof. J´erˆome Wittwer. Contact : [email protected]
†
PSL, Universit´e Paris-Dauphine, LEDa-LEGOS, DIAL UMR 225, F-75016 Paris, France.
1
Introduction
In April 2000, facing a rapidly aging population, the Japanese government implemented a man-datory public long-term care insurance (LTCI) with the aim of lessening the burden of care-giving on the family by spreading the responsibility for elderly care more evenly across society (Yong and Saito, 2012). The purpose of relieving caregivers is twofold. Firstly, informal caregiving may be a hurdle to labour participation. Hence, discharging family caregivers from the burden of care for the elderly should encourage participation on the labour market, especially among women (Shimizutani, Suzuki, and Noguchi, 2008). Secondly, family elderly care can be the cause of nursing fatigue for caregivers, which could affect caregivers’ health or even lead to elderly abuse (Yuhara, 2011). Transfering a part of the burden from the family to formal caregivers is also an attempt to increase the quality of elderly care and avoid family-caregivers’ burn-out. However, this policy is likely to relieve family caregivers only if the elderly in need access and use the LTCI services, regardless of the presence of potential caregivers or their financial situation.
Using the third wave of Japanese Study of Aging and Retirement (JSTAR) conducted in 2011, this article attempts to identify factors determining of the use and non-use of LTCI services.
Prior to the new scheme, publicly funded long-term care was provided by each municipality as part of the social welfare policy program. Although political efforts had been conducted since the 1980’s in order to expand services and provide care to all frail older persons, the definitions of eligibility, the types and the amount of services provided varied largely between localities (Tamiya, Noguchi, Nishi, Reich, Ikegami, Hashimoto, Shibuya, Kawachi, and Campbell, 2011). The social welfare-nature program was still confined to care receivers in lower income households and not necessarily available to those who could be cared for by the family (Shimizutani, Suzuki, and Noguchi, 2008; Campbell and Ikegami, 2000). The Japanese government tackled those inequalities and proposed the objective of “equal services for equal needs” by providing care based upon a system of mandatory contributions and uniform entitlements all over the country (Izuhara, 2003). Since April 2000, all insured people who are certified as needing care are entitled to receive care services regardless of the family structure or the level of income. However, potential barriers may still remain leading to non-take-up. Also, the shift from a scheme favouring lower income households to a mandatory insurance system with uniform entitlements may be less beneficial for low income population.
The phenomenon of non-take-up deserves serious attention from policy-makers for at least two reasons (Van Oorschot, 1998). First, it implies a fundamental injustice because of the inequality that exists between applicants and non-applicants in redeeming their rights. Second, it indicates ineffec-tiveness in the scheme. One of the objectives of the LTCI is to lessen the burden on family carers. Therefore, non-take-up caused by the existence of potential informal caregivers would be an indication
that the program does not fully reach its targets. A better understanding of this phenomenon and the role played by adult children is important for formulating revisions of LTCI which are scheduled regularly.
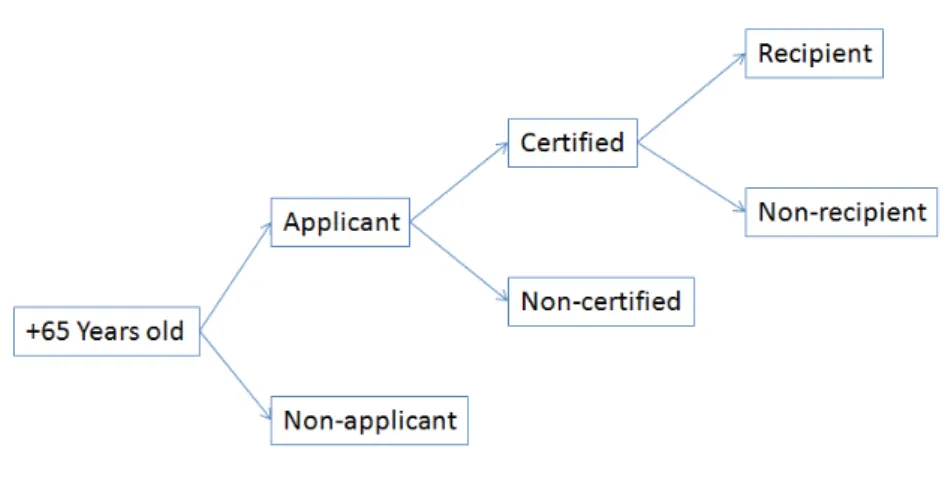
In LTCI, non-take-up can arise at two different stages in the process. As illustrated in figure 1, the procedure to access LTCI services can be split in two steps : the certification and the arrangement of the services. In order to use services provided by LTCI, a potential recipient has to apply for the as-sessment of his health status. In the case he is certified as needing care, he can rely on a care-manager to arrange services according to his needs and rights defined by the level of dependancy. Non-take-up can therefore arises before or after the certification. Some potential recipients do not apply for the certification (primary non-take-up) while some do not use any services or use very little services even though they are certified (secondary non-take-up).
Figure 1 – Procedure for LTCI
Source : author
Since the establishment of the LTCI in 2000, a growing literature has been working on publicly funded elderly care. Tamiya, Yamaoka, and Yano (2002) conducted a survey in May 2000 in order to analyze the type of services used by certified parents depending on the presence and kinship of family caregivers. Using a survey of 2 530 family caregivers conducted in 2006 in nine regions, Suzuki, Ogura, and Izumida (2008) examined how LTCI was affecting caregivers’ burden. They highlighted positive effects of using LTCI services on family caregivers. Hanaoka and Norton (2008) studied how children caregivers affect the use of formal care for their elderly parents, focusing on the differential effects for gender, marital status, and children’s opportunity costs. For their analysis, the authors used data from the 2001 wave of the Nihon University Japanese Longitudinal Study of Aging (NUJL-SOA).
Their results showed that gender appeared to have quantitatively different but qualitatively similar negative effect among unmarried children. Besides, the presence of less educated unmarried children had negative effects on the probability of having any formal long-term care while the presence of married daughters with a high opportunity cost had positive effects. These studies focus on the use of services at the second stage or without considering the different stages. To our knowledge, no article however has analyzed non-take-up at the first stage of the procedure of application.
This paper extends the previous literature by examining the reason of primary non-take-up in LTCI in Japan. Our approach is close to that of Hanaoka and Norton (2008), but they studied the use of LTCI services while this paper focus on primary take-up. Using binomial probit models, we attempt to analyse i) the role played by adult children according to different characteristics (living place, gender, marital status and level of education) and ii) whether the low income households are disadvantaged.
Our results highlight two reasons for primary non-take-up : cultural norms and low income. Firstly, the presence of traditional caregivers, that is to say daughters and daughters-in-law, tends to reduce the probability of applying for LTCI certification when they are living close enough to bring care. For the elderly coliving with a child, the presence of a daughter-in-law decreases the probability to ask for LTCI certification. Among children who do not live with the parents but who live in the same town, daughters also negatively affect parents take-up. Daughters-in-law who are living close but who are not coliving do not affect the decision to apply. Secondly, the elderly who do not pay any taxes nor social charges are less likely to apply for LTCI certification. Since only those who have very low revenues do not pay taxes nor charges, this result indicates that the LTCI program tend to exclude the lowest income population.
The remainder of this paper is organized as follows. Section 2 reviews the previous literature and describes the potential causes of non-take-up in LTCI. Section 3 and 4 present the data and the empirical specification. Finally section 5 presents the results and section 6 concludes.
2
Background
The question of interest is “what are the factors determining the use of LTCI’s services ?”. In the literature, most of the studies analyzing formal care utilization had examined the nature of the rela-tionship between informal and formal care, that is to say, whether they are complements or substitutes. Since the 1980’s, a great interest was carried on whether expanding publicly financed long-term care would increase the total care received by disabled persons or only increase public costs without such results (Christianson, 1988; Ettner, 1994; Pezzin, Kemper, and Reschovsky, 1996; Stabile, Laporte, and Coyte, 2006). More recently, a growing literature has been analyzing the opposite causality which is the role of infomal care on the use of formal care (Van Houtven and Norton, 2004; Bolin, Lindgren, and Lundborg, 2008; Bonsang, 2009).
As noticed by Bonsang (2009), theorical models related to these studies rely mainly on family-decisions and a health production function (Grossman, 1972; Van Houtven and Norton, 2004) or the ability by the elderly person to perform activities of daily living function (Stabile, Laporte, and Coyte, 2006). In these models, the use of formal care is a consequence of family-decision under budget and time constraints, but barriers such as non-financial procedure costs, lack of information or stigma are not explicitly included nor analyzed1. Yet, Izuhara (2003) suggested that the non-use of LTCI’s services may be the consequence of such barriers. It would be therefore relevant to analyse the non-use of formal care as a take-up problem relying on a basic cost/benefit framework as Moffitt (1983) model. The participation or not in a social program is a utility-maximazing decision : eligible people take up a program if the expected benefits exceed the costs which include non-financial costs.
Fontaine (2012) raised the issue in the french framework. His study aimed to analyse the impact on informal caregivers of receiving personalised autonomy allowance (allocation personnalis´e d’auto-nomie, or APA), a public support provided to finance professional services, by comparing recipient population and non-recipient population. In order to control observed heterogeneity between the two populations, Fontaine (2012) first identified the individual determinants of recourse to the APA and then used the matched sampling method. He found that having a great number of informal care re-sources available to disabled elderly people is associated with lower probability of recourse of the APA. The effect varied however according to the level of disability and the gender of children. The effect was significant only for slightly disabled elerdly people. Also, the number of daughters decreased the probability of receiving APA while the number of sons increased it2.
Generally, three causes are mentionned in the literature of non-take-up : process costs (out of po-cket costs, time required to become enrolled, complexity of the claiming process), stigma and ignorance
1. Stigma or cultural norms could be however included as a cost for not providing care or in family preference. 2. The effect was however not significant at 10%
or lack of infomation (Remler, Rachlin, and Glied, 2001; Currie, 2004). These inter-related factors can occur at three different levels : the client level, the administration level and the scheme or structure level (Van Oorschot, 1998). Non-take-up can be the direct result of specific behaviour of a client. Conceptually, it is assumed that eligible people take-up a program when the benefits exceed the costs but the perceived benefits and costs vary among the clients according to different factors (financial situation, family structure, health, knowledge of the program or their perception of cultural norms...). Besides, clients act within a specific administrative context which can strongly influence their know-ledge, perceptions and experiences. Using complex application forms, using a humiliating or degrading way of handling claims, combining the service with a fraud control function are all exemples of how take-up can be affected at the administration level. We can assume that the incentive for the adminis-trators to complexify the process increases under high financial constraints. Finally, the organization and context in which administrators and clients act are defined by the scheme or structure designed by the policy makers.
The adoption in Japan of the LTCI seems to have reduced several elements of non-take-up at different levels. Since April 2000 long-term care in Japan is no longer allocated by the state but has become a part of a contract based upon a system of mandatory contributions and uniform entit-lements (Izuhara, 2003). One of the aims of introducing the concept of contract was to remove the stigma attached to the traditional notion of means-tested social welfare. Moreover, by defining explicit and uniform entitlement for everyone, LTCI also considerably reduced administration-level barriers such as arbitrary bureaucratic decisions or complicated social and financial eligibility rules (Campbell and Ikegami, 2002). Finally, many efforts have been made by the Japanese governement to limit the complexity of the process faced by the applicants. The application form requires very little information and care-managers are provided to advise and help the applicants during the entire process.
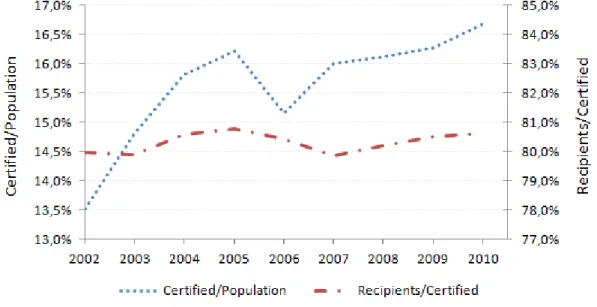
Figure 2 represents the evolution of the proportion of certified elderly aged over 65 (principal axis) and the proportion of recipients among the certified (secondary axis) between 2002 and 2010. It indicates that around 80% of the certified elderly actually use services from LTCI. In other words, 20% of the certified elderly, although entitled, are not recipients of LTCI services. This proportion is very stable since 2002. Besides, the proportion of certified elderly increased from 13,5% to more than 16,5% during the same period, showing that the program got better established over time3.
3. The temporary drop of the proportion of certified elderly coincide with the 2005 reform introduced in april 2006. After the system of evaluation had been modified in 2006, the number of seniors certified for the two lowest need levels increased disproportionately (Tsutsui and Muramatsu, 2007) while the number of the seniors certified for the highest levels decreased. This indicates that the assessment system has become more strict in 2006.
Figure 2 – Evolution of LTCI certified and recipients aged over 65 between 2002 and 2010
Data : stat.go.jp and mhlw.go.jp
Although through the design of LTCI a great importance is given to reduces the potential barriers, some may still remain leading to the non-take-up of some elderly in needs. This article analyses i) how the presence of adult children affects the probability of applying for LTCI certification and ii) whether having low income reduces the participation to LTCI program.
The presence of children can have two opposite effects and the net impact of the presence of adult children is theorically unknown. Firstly, adult children may have a positive impact on parents’ take-up by informing them. The lack of information regarding the process and eligibility of the scheme can be a barrier for the elderly access to the LTCI services. Izuhara (2003) pointed out concrete cases where elderly did not apply for the LTCI because of a lack of information. They knew about the LTCI but didn’t know how to apply for it or didn’t even know if they were eligible. The author highlighted the role played by adult children in reducing the lack of information : according to the 2002 household survey, older households who had frequent contacts with their children were more likely to use LTCI services. Secondly, the presence of an adult-child living close enough to bring care reduces the expected benefits a parent can get from the use of LTCI. It therefore affects negatively the probability of ap-plying for certification. The magnitude of the negative impact however depends on the characteristic of the potential caregivers, notably the gender and the level of education.
On one hand, daughters and daughters-in-law are culturaly expected to care for the elderly. In the old Civil Code of Meiji era (1868-1912) based on a system of single-child inheritance, primacy was given to the continuity of the household with successive generations of parents, eldest sons and their wives and children (Ogawa, Matsukura, et al., 2009). Under such a system, daughters-in-law of the eldest son would benefit when the husband inherited his parents’ property, but in return, were expected to care for the elderly (Long and Harris, 2000). The new Family code revised in 1948 de-fined equal inheritance for all children and thus, modified the legal responsibility of the eldest son. Gradually, it has become increasingly acceptable and even desirable for women to care for their own parents and not necessarily for their parents-in-law (Long and Harris, 2000). However, traditional culture may continue to influence daily life and individual perceptions (family perception, in-family relationship). For some, becoming the caregiver of the husband’s parents is still considered a matter of course (Campbell, Nishimura, et al., 2009). Besides, since the post-war period, the Japanese Go-vernment has relied on the informal role of families and has legally enforced women’s responsibility as primary caregivers (Makita, 2010). The children’s responsibility for taking care of their aged parents is stated in the new Civil Code of 1948 (Ogawa, Matsukura, et al., 2009) and the government maintained a social security system towards male breadwinners4. LTCI was developped in a completely opposite logic, but in presence of daughters-in-law or daughters, elderly and potential family caregivers may still feel reluctant to use services. On the other hand, the opportunity cost of bringing care depends on the education level. The more educated is a child, the higher would be his opportunity cost of caring for a parent. The parent may therefore expect to receive less care from highly educated children than from low educated ones. In other words, the negative impact of the presence of an adult-child as a potential caregive should be weaker for high educated children.
The level of income can affect LTCI take-up through several channels : user fees, the mechanism of collecting insurance premiums and complementary programs aiming to help elderly with low income or public assistance for the less well off (Seikatsu Hogo).
Firstly, to use services provided by LTCI, elderly are expected to participate up to 10% of the price. Although the process of evaluation does not require any financial cost, the anticipated cost may discourage low income elderly to apply. Secondly, although Japanese LTCI is mandatory and the contribution is almost always automatically collected from elderly’s pension (for those who are aged 65 and over)5, contributions are not deducted from small pensions. In such cases, the elderly
are required to pay monthly contributions to the municipality themselves. However, some fail to do
4. A married person who earn less than a certain amount (which is frequently revised) does not pay income tax but also benefits their spouse’s payroll and social security plans. This system discourage married women to commit themselves in full-times jobs (Ogawa and Ermisch, 1996).
5. LTCI covers also individuals aged between 40 and 65 if the needs arises from an ageing-related disease. However, this study focus on elderly aged 65 and more who are by far the main user of the Japanese LTCI.
so. The way municipalities deal with the non-payment of contribution vary according to the lenght of the non-payment but the access to certification and services is not blocked. Non-payers can still use services under specific conditions, which make the use of services more costly for the elderly. Although the non-payment of contribution does not block access to certification and LTCI services, elderly who have low income and who failed paying the premiums may exclude themselves from the LTCI program. Finally, several complementary programs are provided by the Japanese governement in order to bring further support to elderly who have low income. The elderly benefiting from the public assistance Seikatsu Hogo can for exemple use LTCI’s services without paying any contribution nor user fees, but complementary programs are not automatically provided and additional procedures are required. The elderly need to know about these programs and furthermore, the procedures for mean-tested programs are usually more complexe and are associated with stronger stigma.
3
Data
This paper uses the third wave of the Japanese Study of Aging and Retirement (JSTAR) conducted in 2001 by the Research Institute of Economy, Trade and Industry (RIETI), Hitotsubashi University, and the University of Tokyo. JSTAR is a multi-disciplinary micro database including more than 7100 individuals aged 50 and over. The first wave of data was collected in 2007 to individuals aged bet-ween 50 and 75 living in five municipalities (Takikawa, Sendai, Adachi, Kanazawa and Shirakawa). Every two years, the respondants are followed and the sample is increased. Additional individuals were surveyed from two municipalities (Tosu and Naha) in 2009 and from three municipalities (Chofu, Tondabayashi and Hiroshima) in 2011. Three waves are thus available and the database contains in total around 7 120 individuals and 12 990 observations. Interviewers conducted face-to-face interviews with respondents using computers (CAPI : computer-aided personal interview). Some additionnal in-formation was collected through a self completed questionnaire.
3.1 Sample
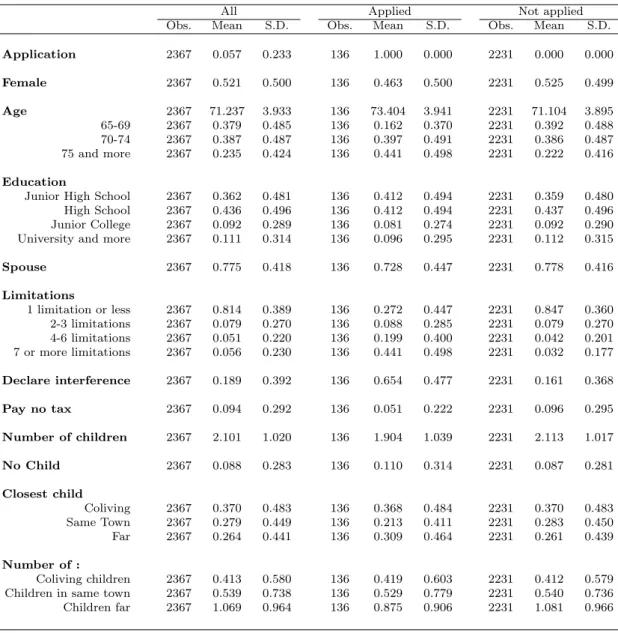
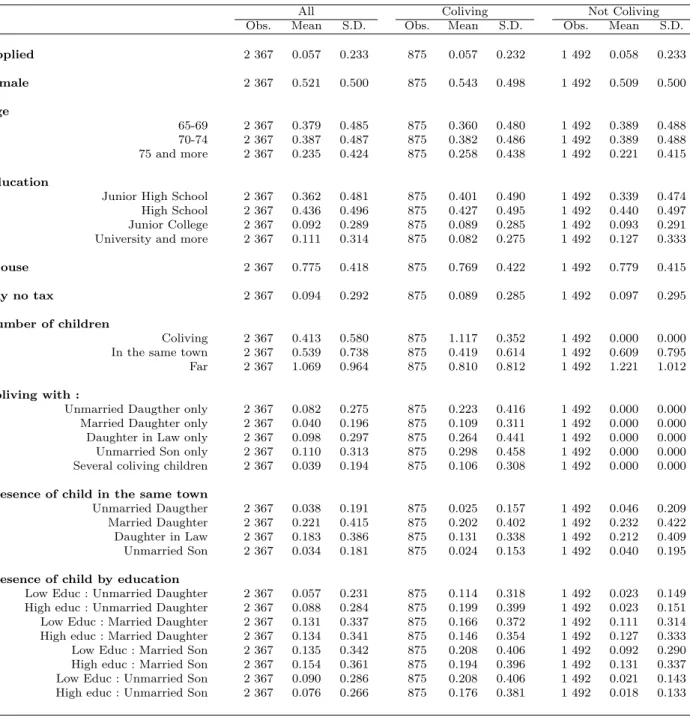
JSTAR focuses on individuals aged between 50 to 75 when interviewing a respondant for the first time. Therefore, the data set of 2011 contains respondants aged between 50 to 79. In this study, we consider the respondants as the elderly parents. Since LTCI is generally eligible for people aged 65 and over, this article performs the analysis on a sample restrained to these ages. We dropped observations with missing or unreliable values for the variables of interest. Moreover, respondants who still had studying children were also excluded. This left us with 2 367 observations aged between 50 to 79. Summary statistics of the main variables used in the model are presented in table 2 and table 3. In order to control the stability of the results, we also conducted some analysis on a sub-sample limited to individuals who declared at least one physical limitation. This sub-sample includes 660 observations (Summary statistics are presented in table 8 and table 9 in appendix).
3.2 Dependant variable
The dependant variable is a dummy variable indicating whether the respondant had ever applied for LTCI certification. This article focuses on identifying the factors that determine the decision to apply. Therefore, whether the applicant was certified as needing care or not is not of our interest. In our sample, 5.7% of the respondants declared having applied for the LTCI at least once. In comparison, the proportion of certified population aged between 65 and 79 in 2010 was about 6.9% according to the Japanese Minister of Health, Labour and Welfare6.
3.3 Explanatory variables
We expect the decision of applying to be mainly driven by the parent’s disability. Four variables regarding parent’s disabilities are analysed : i) the number of physical limitations the respondant declares among a list of ten daily activities such as walking 100 meters or raise hand above the shoul-ders7; ii) a dummy indicating whether the respondant declare having at least one limitation among three in-house instrumental activities of daily living (in-house IADL) (boiling water, making phone calls without help, taking medicine without help) ; iii) a dummy indicating whether the respondant declares having at least one limitation among two out-door instrumental activities of daily living (out-side iadl) (going out alone using public transportation such as buses and trains ; shopping for daily necessities ; iv) and finally a dummy indicating whether physical or mental condition had interfered with their daily life during the past year.
Figure 3 – Declared interference and limitations by age
Data : JSTAR 2011
Note : Almost 25% of the elderly aged 75 and over declare that their physical or mental condition had interfered with their daily life during the previous year ; more than 40% declared having at least one physical limitation.
20% of the respondants declared that their physcical or mental condition interfered with their daily life and 28% declared at least one physical limitation. These proportions increase with age (see figure 3). Besides, the proportion of elderly applying for LTCI increases with the number of physical limitations but remains low compared to the proportion of those who declare interference in daily
activities (see table 4). Less than 50% elderly who declare having more than 7 physical limitations had applied for LTCI certification while more than 60% declare that physical or mental conditions had interfer in their daily life.
Figure 4 – Declared interference and application by number of limitations
Data : JSTAR 2011
Note : Almost 25% of the elderly aged 75 and over declare that physical or mental condition had interfer with their daily life during the previous year ; more than 40% declare having at least one physical limitation.
Four characteristics of the children are analysed : living place, gender, marital status and level of education. We distinguish coliving children, children living in the same town and children living too far to bring daily care. Coliving children and children living in the same town are supposed to be living close enough to bring frequent or daily care, and therefore reduce parents’ expected benefits from LTCI. As for gender and marital status, we create four children groups following the exemple of Hanaoka and Norton (2008) : daughters-in-law (equivalent of married sons), unmarried daugthers, married daughters and unmarried sons. We expect traditional caregiver, especially daughters-in-law and daughters, to have a negative impact in applying for LTCI. Finally, children graduated from Ju-nior College, University and more are considered as highly educated while children gradutated High school or less are refered as low educated.
Variables indicating respondant’s level of income is also available in the Jstar data set. However due to the important number of missing obsersations, we decided to use the non-payment of taxes as a
proxy of low level of income. In the self-completed questionnaire, respondants were asked the question “In the past year, did you pay any income tax, resident tax, business tax, fixed-asset tax, automobile tax, inheritence tax, or social insurance premiums ?”. In Japan, LTC insurance premiums of elderly aged 65 and more are usually directly taken off their national pension except for those who receive small pensions. Those who do not receive any pension or who receive only small pensions are supposed to pay the monthly LTCI contribution (insurance premium) to the municipality by themselves but some do not. Therefore, elderly who do not pay taxes nor any contribution (social insurance premiums) by definition have low income.
Almost 9% declared not paying any taxes. This rate of non-payment seems to be quite important especially given that LTCI is mandatory. However, in a lot of cases taxes are automatically taken off and some may not realize that they are paying taxes. In both case, not paying or not beeing aware being paying, the probabibility of applying for LTCI services should diminish.
Finally, in all regressions, we control for gender, age (between 65-69, between 70-74, 75 and over), marital status and cities8.
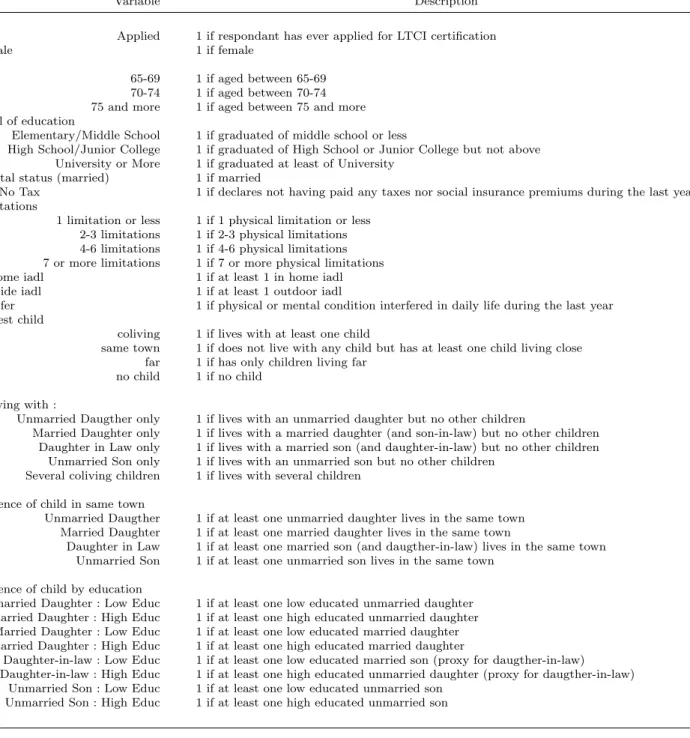
Table 1 – Variables of the sample
Variable Description
Applied 1 if respondant has ever applied for LTCI certification
Female 1 if female
Age
65-69 1 if aged between 65-69 70-74 1 if aged between 70-74 75 and more 1 if aged between 75 and more Level of education
Elementary/Middle School 1 if graduated of middle school or less
High School/Junior College 1 if graduated of High School or Junior College but not above University or More 1 if graduated at least of University
Marital status (married) 1 if married
Pay No Tax 1 if declares not having paid any taxes nor social insurance premiums during the last year Limitations
1 limitation or less 1 if 1 physical limitation or less 2-3 limitations 1 if 2-3 physical limitations 4-6 limitations 1 if 4-6 physical limitations 7 or more limitations 1 if 7 or more physical limitations In home iadl 1 if at least 1 in home iadl Outside iadl 1 if at least 1 outdoor iadl
Interfer 1 if physical or mental condition interfered in daily life during the last year Closest child
coliving 1 if lives with at least one child
same town 1 if does not live with any child but has at least one child living close far 1 if has only children living far
no child 1 if no child Coliving with :
Unmarried Daugther only 1 if lives with an unmarried daughter but no other children
Married Daughter only 1 if lives with a married daughter (and son-in-law) but no other children Daughter in Law only 1 if lives with a married son (and daughter-in-law) but no other children
Unmarried Son only 1 if lives with an unmarried son but no other children Several coliving children 1 if lives with several children
Presence of child in same town
Unmarried Daugther 1 if at least one unmarried daughter lives in the same town Married Daughter 1 if at least one married daughter lives in the same town
Daughter in Law 1 if at least one married son (and daugther-in-law) lives in the same town Unmarried Son 1 if at least one unmarried son lives in the same town
Presence of child by education
Unmarried Daughter : Low Educ 1 if at least one low educated unmarried daughter Unmarried Daughter : High Educ 1 if at least one high educated unmarried daughter
Married Daughter : Low Educ 1 if at least one low educated married daughter Married Daughter : High Educ 1 if at least one high educated married daughter
Daughter-in-law : Low Educ 1 if at least one low educated married son (proxy for daugther-in-law) Daughter-in-law : High Educ 1 if at least one high educated unmarried daughter (proxy for daugther-in-law)
Unmarried Son : Low Educ 1 if at least one low educated unmarried son Unmarried Son : High Educ 1 if at least one high educated unmarried son
Table 2 – Statistical descriptions according to application decision
All Applied Not applied
Obs. Mean S.D. Obs. Mean S.D. Obs. Mean S.D. Application 2367 0.057 0.233 136 1.000 0.000 2231 0.000 0.000 Female 2367 0.521 0.500 136 0.463 0.500 2231 0.525 0.499 Age 2367 71.237 3.933 136 73.404 3.941 2231 71.104 3.895 65-69 2367 0.379 0.485 136 0.162 0.370 2231 0.392 0.488 70-74 2367 0.387 0.487 136 0.397 0.491 2231 0.386 0.487 75 and more 2367 0.235 0.424 136 0.441 0.498 2231 0.222 0.416 Education
Junior High School 2367 0.362 0.481 136 0.412 0.494 2231 0.359 0.480 High School 2367 0.436 0.496 136 0.412 0.494 2231 0.437 0.496 Junior College 2367 0.092 0.289 136 0.081 0.274 2231 0.092 0.290 University and more 2367 0.111 0.314 136 0.096 0.295 2231 0.112 0.315
Spouse 2367 0.775 0.418 136 0.728 0.447 2231 0.778 0.416 Limitations 1 limitation or less 2367 0.814 0.389 136 0.272 0.447 2231 0.847 0.360 2-3 limitations 2367 0.079 0.270 136 0.088 0.285 2231 0.079 0.270 4-6 limitations 2367 0.051 0.220 136 0.199 0.400 2231 0.042 0.201 7 or more limitations 2367 0.056 0.230 136 0.441 0.498 2231 0.032 0.177 Declare interference 2367 0.189 0.392 136 0.654 0.477 2231 0.161 0.368 Pay no tax 2367 0.094 0.292 136 0.051 0.222 2231 0.096 0.295 Number of children 2367 2.101 1.020 136 1.904 1.039 2231 2.113 1.017 No Child 2367 0.088 0.283 136 0.110 0.314 2231 0.087 0.281 Closest child Coliving 2367 0.370 0.483 136 0.368 0.484 2231 0.370 0.483 Same Town 2367 0.279 0.449 136 0.213 0.411 2231 0.283 0.450 Far 2367 0.264 0.441 136 0.309 0.464 2231 0.261 0.439 Number of : Coliving children 2367 0.413 0.580 136 0.419 0.603 2231 0.412 0.579 Children in same town 2367 0.539 0.738 136 0.529 0.779 2231 0.540 0.736 Children far 2367 1.069 0.964 136 0.875 0.906 2231 1.081 0.966
Table 3 – Statistical descriptions according to residence
All Coliving Not Coliving
Obs. Mean S.D. Obs. Mean S.D. Obs. Mean S.D.
Applied 2 367 0.057 0.233 875 0.057 0.232 1 492 0.058 0.233 Female 2 367 0.521 0.500 875 0.543 0.498 1 492 0.509 0.500 Age 65-69 2 367 0.379 0.485 875 0.360 0.480 1 492 0.389 0.488 70-74 2 367 0.387 0.487 875 0.382 0.486 1 492 0.389 0.488 75 and more 2 367 0.235 0.424 875 0.258 0.438 1 492 0.221 0.415 Education
Junior High School 2 367 0.362 0.481 875 0.401 0.490 1 492 0.339 0.474 High School 2 367 0.436 0.496 875 0.427 0.495 1 492 0.440 0.497 Junior College 2 367 0.092 0.289 875 0.089 0.285 1 492 0.093 0.291 University and more 2 367 0.111 0.314 875 0.082 0.275 1 492 0.127 0.333
Spouse 2 367 0.775 0.418 875 0.769 0.422 1 492 0.779 0.415
Pay no tax 2 367 0.094 0.292 875 0.089 0.285 1 492 0.097 0.295
Number of children
Coliving 2 367 0.413 0.580 875 1.117 0.352 1 492 0.000 0.000 In the same town 2 367 0.539 0.738 875 0.419 0.614 1 492 0.609 0.795 Far 2 367 1.069 0.964 875 0.810 0.812 1 492 1.221 1.012 Coliving with :
Unmarried Daugther only 2 367 0.082 0.275 875 0.223 0.416 1 492 0.000 0.000 Married Daughter only 2 367 0.040 0.196 875 0.109 0.311 1 492 0.000 0.000 Daughter in Law only 2 367 0.098 0.297 875 0.264 0.441 1 492 0.000 0.000 Unmarried Son only 2 367 0.110 0.313 875 0.298 0.458 1 492 0.000 0.000 Several coliving children 2 367 0.039 0.194 875 0.106 0.308 1 492 0.000 0.000 Presence of child in the same town
Unmarried Daugther 2 367 0.038 0.191 875 0.025 0.157 1 492 0.046 0.209 Married Daughter 2 367 0.221 0.415 875 0.202 0.402 1 492 0.232 0.422 Daughter in Law 2 367 0.183 0.386 875 0.131 0.338 1 492 0.212 0.409 Unmarried Son 2 367 0.034 0.181 875 0.024 0.153 1 492 0.040 0.195 Presence of child by education
Low Educ : Unmarried Daughter 2 367 0.057 0.231 875 0.114 0.318 1 492 0.023 0.149 High educ : Unmarried Daughter 2 367 0.088 0.284 875 0.199 0.399 1 492 0.023 0.151 Low Educ : Married Daughter 2 367 0.131 0.337 875 0.166 0.372 1 492 0.111 0.314 High educ : Married Daughter 2 367 0.134 0.341 875 0.146 0.354 1 492 0.127 0.333 Low Educ : Married Son 2 367 0.135 0.342 875 0.208 0.406 1 492 0.092 0.290 High educ : Married Son 2 367 0.154 0.361 875 0.194 0.396 1 492 0.131 0.337 Low Educ : Unmarried Son 2 367 0.090 0.286 875 0.208 0.406 1 492 0.021 0.143 High educ : Unmarried Son 2 367 0.076 0.266 875 0.176 0.381 1 492 0.018 0.133
4
Empirical model
The empirical specifications of this article are close to the ones used by Hanaoka and Norton (2008). Parent’s decision of applying (Appi) is a function of a vector of the level of disability (Di), a
vector of potential informal carers characteristics (ICi), and a vector of other parent’s characteristics
(Xi). The subscript i represnets the individual. The basic model is described by a binary probit model
such that :
Appi =
( 1 if App∗i > 0 0 if App∗i ≤ 0
P r(Appi > 0|Di, Xi, ICi) = Φ(β0+ Diβd+ Xiβx+ ICiβic)
where Φ(·) represents the cumulative density function of the standard normal. βd, βx and βic are
the parameters to be estimated9. In order to assess the role of adult children, we use the number and the presence of children according to different characteristics (geographical, gender, level of education), regardless of whether or not they provide care. We first test the signs and significance of the coefficients of the children’s presence according to their living place. Secondly, we study whether the traditional norms still prevail comparing the coefficient according to the gender and marital status. We expect that the presence of daughter or daughter-in-law living close enough to bring care reduce the decision to apply for LTCI. Thirdly, children’s level of education are included as a proxy of the children’s opportunity cost. The negative effect of the presence of children on the expected benefits from the LTCI program should be weaker for highly educated children. Finally, the impact of having a low in-come is particularly examined through the coefficient associated to the variable of non-payment of tax.
5
Estimation results
Results are shown in table 4 to table 6. The first table focuses on children’s living place while table 5 concentrates on children’s gender and marital status. Finally table 6 analyses the impact of the children’s level of education.
Not surprisingly, the main determinants of the application is by far the health situation : number of limitation of physical limitations, the presence of iadl and to a lesser extent the declaration of being interfered by physical condition in daily life. In all estimations, having 4 to 6 limitations or 7 limita-tions or more increase the probability to apply for the certification and the coefficients are significative at 1% or 5%10 respectively. Nevertheless, adult children’s characteristics as well as the payment or not of the contribution seem also to affect the decision to apply for LTCI certification.
5.1 Children’s living place
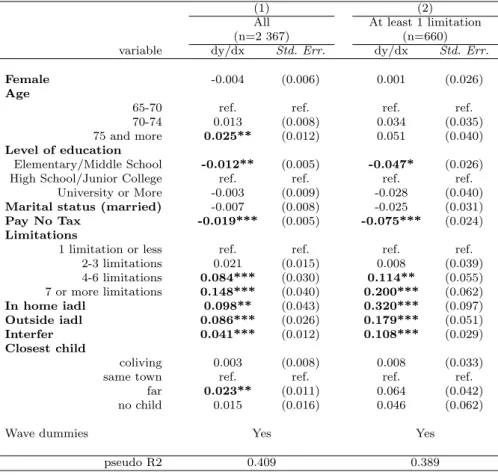
Table 4 reports the marginal effects where the dependant variable is the application to LTCI cer-tification. Model 1 proceeds the analysis on the full sample while model 2 executes the regression on indivuals who declare at least 1 physical limitation. The variables of interest are the geographically closest child.
The results show no significant difference between respondants’ with no children and those who have children coliving or living in the same town. Only respondants who declared to have only children living far appear to be more likely to apply for the certification, although the effect is small and the significancy of the coefficient is unstable. This result supports the assumption that children living far from the parent affect the parents’ decision by informing them when the parents have no family close enough to bring care.
5.2 Marital status and gender
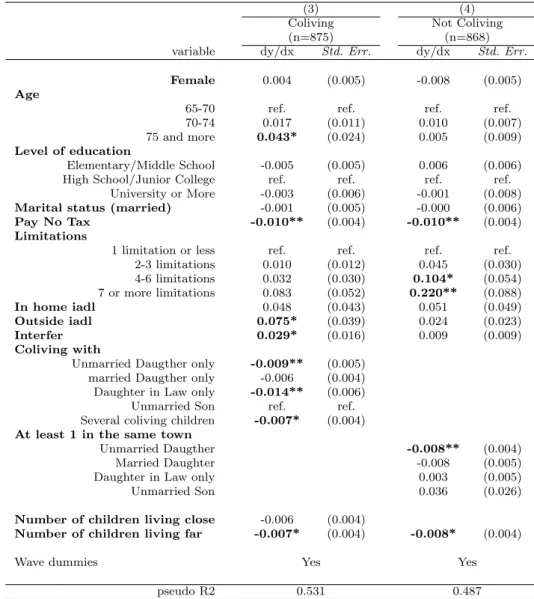
The objective of models 3 and 4 (table 5) is to analyse the effect of the potential informal carers on application to LTCI certification according to the gender and the marital status. We therefore focus on children coliving or living in the same town (living close enough to bring daily care) and exclude respondants who only have children living far.
10. Except in table 5 where the main determinants for coliving parents to apply appeared to be outside iadl and inteterference by physical condition in daily life.
The effect of children’s gender and marital status differs according to the living place. Among co-living children, daughters-in-law and unmarried daughters affect negatively the likelihood to apply for LTCI certification. The coefficients are both significant at the 10% level. Among children living in the same town, the presence of unmarried daugther reduces the probability of applying. The coefficient associated to the presence of married daughter is not significant but the coefficient is negative and very close to the one associated to the presence of unmarried daugthers. Daughters-in-law living in the same town, however have no negative impact. The coefficient is even positive.
Two reasons may explain the lack of negative effect of non-coliving daughters-in-law. Firstly, as discussed earlier (see section 2), in the Japanese tradition, it is especially expected that the wife of the eldest son live with the parents-in-law and take care of them. Non-coliving daughters-in-law are therefore less likely to be the elderst son’s spouse than coliving daughters-in-law, and as a consequence are less under traditional pressures. Secondly, we can also assume that children (especially eldest son) who live in the same town but not in the same residence of the parents are initially less sensitive to cultural norms.
The results support the assumption that traditional norms still remain : the presence of coliving daughters-in-law or daughters living close decrease the probability for the parent to apply for the cer-tification. The traditional potential caregivers are more reluctant to use formal care (or in the presence of traditional potential caregivers, parents are more reluctant to apply for formal care). However the negative effect of coliving daughters-in-law is not very stable. Beside, Hanaoka and Norton (2008) who worked on the use of LTCI services without distinguishing primary and secondary non-take-up didn’t find that daughters-in-law had a stronger negative effect than daughters. Therefore, although traditional norms still appear to play a role, the traditional pressure upon daughters-in-law does not seem to be as anchored as we could initially expect.
Surprisingly, the number of children living far away impact the probability of applying negatively when the sample is limited to those who have at least one child living close. In other words, having only children living far increases the probability of applying (models 1 and 2) while having children living far away reduces the probability of applying so long as other children live closer (models 3 and 4). One explanation could be that the children living close care the sight of children living far and feel more reluctant about the idea that the parents rely on formal care.
5.3 Children’s level of education
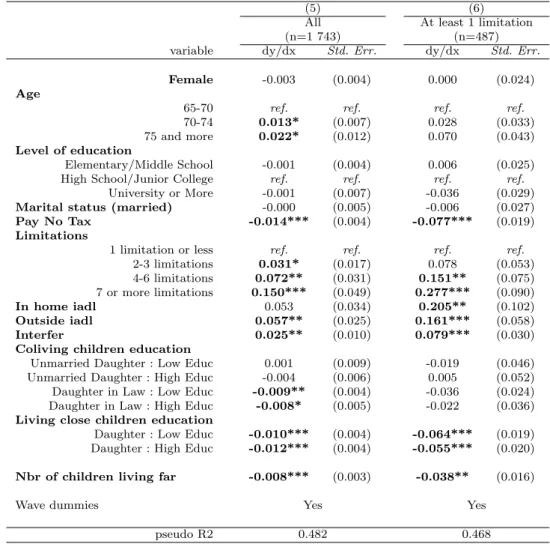
Finally models of the table 6 verify whether the children’s level of education matters. We focus on the level of education of the children who appears to affect the application of LTCI certification,
namely coliving unmarried daughters, coliving daughters-in-law and daughters living close. Married daughters and unmarried daughters living close were not distinguished since they seem to have the same impact on parent’s participation to LTCI11.
Coliving daughters-in-law and daughters living close affect the probability of applying for certifi-cation negatively while coliving unmarried daughters do not have any impact. The effect of coliving daughters-in-law is however only significant at the 10% level in one of the models. In order to check whether there are any differential effects between highly educated potential caregivers and the others, the coefficients were compared using a F-test, but equality could not be rejected for any of the daugh-ters. This result suggest that the opportunity cost of the traditional potential caregivers does not matter in the decision to apply for the certification or not.
Unlike our outcomes, Hanaoka found that the presence of children with a lower opportunity cost has greater and more significant substitution effects on formal long-term care than that of with higher opportunity costs. One of the possible explanations would be that the effect of children’s opportunity cost especially matters at the secondary take-up.
5.4 Non-payment of tax
The dummy indicating the non-payment of taxes or social charges was included in all models as a proxy of very low income. As discussed earlier, some social insurances are usually automatically deducted from the pension except for very low pensions. Hence, the respondants who do not pay any taxes nor charges have by definition low income. In every models, the coefficient related to the dummy was systematically negative and significant at 5% or 1%. This result indicates that very low income population is less likely to participate in the LTCI program.
Two reasons can be given to this result. Firstly, elderly who cannot afford paying taxes and social insurances cannot afford the copaiement and exclude themselves from the system although applying for the certification does not generate financial costs for the elderly . Secondly, they can be afraid of reprisals for not paying any social insurance. This observation is quite unfortunate since individuals who exclude themselves from the system at an early stage do no get access to an important amount of information. By applying for the certification and getting in touch with a care manager is also a way to get better information, in particular on additional programs targetting very low income households. However, since we used a proxy of very low income, we are not highlighting that the decision to apply for LTCI certification necessarily decreases as income gets lower. Since the application process
11. Although the coefficient of married daughters was not significant, the coefficient and the standard errors were still very close
does not generate costs, we actually tend to expect little impact of income on primary non-take-up. We tend to believe that this negative relation concerns only the households with the lowest income. Income should probably have a stronger impact on the volume of services purchased at the second stage.
Table 4 – Application to LTCI according to children’s living place (Probit model)
Model 5 proceeds the analysis on the full sample and model 6 executes the regression on indivuals who declare at least 1 physical limitation. The variables of interests are the closest child in the models.
(1) (2)
All At least 1 limitation
(n=2 367) (n=660)
variable dy/dx Std. Err. dy/dx Std. Err.
Female -0.004 (0.006) 0.001 (0.026)
Age
65-70 ref. ref. ref. ref.
70-74 0.013 (0.008) 0.034 (0.035)
75 and more 0.025** (0.012) 0.051 (0.040) Level of education
Elementary/Middle School -0.012** (0.005) -0.047* (0.026) High School/Junior College ref. ref. ref. ref.
University or More -0.003 (0.009) -0.028 (0.040) Marital status (married) -0.007 (0.008) -0.025 (0.031)
Pay No Tax -0.019*** (0.005) -0.075*** (0.024)
Limitations
1 limitation or less ref. ref. ref. ref. 2-3 limitations 0.021 (0.015) 0.008 (0.039) 4-6 limitations 0.084*** (0.030) 0.114** (0.055) 7 or more limitations 0.148*** (0.040) 0.200*** (0.062) In home iadl 0.098** (0.043) 0.320*** (0.097) Outside iadl 0.086*** (0.026) 0.179*** (0.051) Interfer 0.041*** (0.012) 0.108*** (0.029) Closest child coliving 0.003 (0.008) 0.008 (0.033)
same town ref. ref. ref. ref.
far 0.023** (0.011) 0.064 (0.042) no child 0.015 (0.016) 0.046 (0.062)
Wave dummies Yes Yes
pseudo R2 0.409 0.389
Data : JSTAR 2011
This table presents the marginal effects of binomial probit models.
Table 5 – Application to LTCI according to children’s gender and marital status - 2 (probit model)
In this table, the sample was splitted in two. One includes respondants coliving with at least one child (model 9) and the other includes those who are not coliving with any child (model 10). Model 9 distinguish 5 types of coliving arrangement with children : respondants coliving with only an unmarried daughter, respondants living with a married daughter (and consequently a son-in-law) but no other children, respondants living only with an unmarried son, respondants living with a married son (and therefore a daughter-in-law) but not other children, and finally respondants who are living with several children. These groups are mutually exclusives. The model 10 dinstiguish four groups of children. We estimates the effect of having at least one child from each group. Since a respondant can have children from several groups (a respondant can declare having a married daughter and a married son), these variables are not mutually exclusives.
(3) (4)
Coliving Not Coliving
(n=875) (n=868)
variable dy/dx Std. Err. dy/dx Std. Err. Female 0.004 (0.005) -0.008 (0.005) Age
65-70 ref. ref. ref. ref.
70-74 0.017 (0.011) 0.010 (0.007) 75 and more 0.043* (0.024) 0.005 (0.009) Level of education
Elementary/Middle School -0.005 (0.005) 0.006 (0.006) High School/Junior College ref. ref. ref. ref.
University or More -0.003 (0.006) -0.001 (0.008) Marital status (married) -0.001 (0.005) -0.000 (0.006)
Pay No Tax -0.010** (0.004) -0.010** (0.004)
Limitations
1 limitation or less ref. ref. ref. ref. 2-3 limitations 0.010 (0.012) 0.045 (0.030) 4-6 limitations 0.032 (0.030) 0.104* (0.054) 7 or more limitations 0.083 (0.052) 0.220** (0.088) In home iadl 0.048 (0.043) 0.051 (0.049) Outside iadl 0.075* (0.039) 0.024 (0.023) Interfer 0.029* (0.016) 0.009 (0.009) Coliving with
Unmarried Daugther only -0.009** (0.005) married Daugther only -0.006 (0.004) Daughter in Law only -0.014** (0.006) Unmarried Son ref. ref. Several coliving children -0.007* (0.004) At least 1 in the same town
Unmarried Daugther -0.008** (0.004)
Married Daughter -0.008 (0.005)
Daughter in Law only 0.003 (0.005)
Unmarried Son 0.036 (0.026)
Number of children living close -0.006 (0.004)
Number of children living far -0.007* (0.004) -0.008* (0.004)
Wave dummies Yes Yes
pseudo R2 0.531 0.487
Data : JSTAR 2011
This table presents the marginal effects of binomial probit models.
Table 6 – Application to LTCI according to education level
The aim of the following models is to verify whether the children’s level of education matters. We focuse on the coliving daughters, coliving daughters-in-law and daughters living close. Since the daughters-in-law’s level of education were not available in our data sets, the level of education of the married son of used instead as a proxy. The model differentiate two levels of education : low educated and highly educated. Low educated designate those who gratuated from High School or lower, highly educated includes respondants who went to Junior College, University or more. As in table 4, regressions were first proceeded on a global sample including individuals who have no physical limitation (model 11) and then on a smaller sample limited to individuals who have at least one physical limitation (model 12). The results show that having at least a low educated daughter or a high educated daughter, both reduce the parent’s probability to apply for the LTCI certification.
(5) (6)
All At least 1 limitation
(n=1 743) (n=487)
variable dy/dx Std. Err. dy/dx Std. Err.
Female -0.003 (0.004) 0.000 (0.024)
Age
65-70 ref. ref. ref. ref.
70-74 0.013* (0.007) 0.028 (0.033) 75 and more 0.022* (0.012) 0.070 (0.043) Level of education
Elementary/Middle School -0.001 (0.004) 0.006 (0.025) High School/Junior College ref. ref. ref. ref.
University or More -0.001 (0.007) -0.036 (0.029) Marital status (married) -0.000 (0.005) -0.006 (0.027)
Pay No Tax -0.014*** (0.004) -0.077*** (0.019)
Limitations
1 limitation or less ref. ref. ref. ref. 2-3 limitations 0.031* (0.017) 0.078 (0.053) 4-6 limitations 0.072** (0.031) 0.151** (0.075) 7 or more limitations 0.150*** (0.049) 0.277*** (0.090) In home iadl 0.053 (0.034) 0.205** (0.102) Outside iadl 0.057** (0.025) 0.161*** (0.058) Interfer 0.025** (0.010) 0.079*** (0.030)
Coliving children education
Unmarried Daughter : Low Educ 0.001 (0.009) -0.019 (0.046) Unmarried Daughter : High Educ -0.004 (0.006) 0.005 (0.052) Daughter in Law : Low Educ -0.009** (0.004) -0.036 (0.024) Daughter in Law : High Educ -0.008* (0.005) -0.022 (0.036) Living close children education
Daughter : Low Educ -0.010*** (0.004) -0.064*** (0.019) Daughter : High Educ -0.012*** (0.004) -0.055*** (0.020) Nbr of children living far -0.008*** (0.003) -0.038** (0.016)
Wave dummies Yes Yes
pseudo R2 0.482 0.468
Data : JSTAR 2011
This table presents the marginal effects of binomial probit models.
6
Conclusion
This article attempted to identify the determinants of primary non-take-up in LTCI established in Japan in April 2000. By replacing a social welfare-nature program to a mandatory insurance program, the Japanese governement targeted a shift from a program confined to care receivers in lower incomes households, to a program providing “equal services for equal needs”. To achieve this objective, the Japanese government had to face several challenges of which suppressing family criteria, overcoming cultural norms and removing the feeling of stigma.
Now that the LTCI has been settled for more than 10 years, it is legitimate to ask i) whether the LTCI program overcame the various challenges and ii) whether it created new problems such as neglecting the low income households. Focusing on the primary non-take-up, this article brings in some elements.
Non-take-up raises questions of efficiency and inequality. The initial objective of the LTCI was to alleviate the burden of informal carers and to improve the quality of elderly care. But since 2006 the governement has also progressively attempted to slow down the process of becoming dependant by providing services of prevention. In other words, the success of LTCI programs also relies on the possibility to quickly detect physical disabilities. Non-take-up among highly disabled elderly as well as among lightly disabled deserves serious attention. This article highlights two reasons of non-take-up : cultural norms and low income.
The presence of coliving daughter-in-law or daughter living in the same town (but not coliving) tend to reduce the probability of applying. Although the effect is not very stable for coliving daughters-in-law, this observation indicates that some expectations induced by cultural norms appear already at the first stage of the process. Besides, we found negative effects of having children living far when the elderly has at least a child living close or coliving, suggesting that potential caregivers living close enough may feel explicit or implicit pressure from siblings living far. To improve take-up rate, further public efforts should be maintained in order to overcome the reluctance perceived by some elderly and potential informal carers. For example, it is important to better communicate the benefits of formal care combined with informal care so that people do not consider using formal care as a sign of neglecting the elderly.
Besides,the Japanese government should pay a particular attention to households with very low income. Our study showed that elderly who declared that they were not paying any taxes were less likely to apply for LTCI certification. By definition, those who do not pay taxes nor contributions are the elderly who have very low income, otherwise LTCI contributions would be automatically taken off their pension. In other words, some elderly exclude themselves if they come from a low income
background.
It should be remembered that this study focuses only on the primary non-take-up. Further studies should extend the analysis by examining the reasons of non-use of services among elderly who are certified and the derterminants of the quantity of services used.
Finally, a few caveats are in order. First, the average age of the respondants is quite young : the average age of the sample is about 71 years old while the proportion of elderly facing physical disabilities increases sharply after 80 years old. The results should be confirmed with a sample including older individuals. Secondly, the level of revenue in this study was only roughtly taken into account. Collecting exact data regarding respondant’s income is always complicated. However, if JSTAR can access to information regarding respondant’s LTCI insurance (with the respondant’s agreement), it may be possible to get, not the level of income but the group of the contribution12. This variable would constitute a good proxy of the household income without having to ask detailed income.
A
Appendix
A.1 Evolution of LTCI certified elderly and recipient
Table 7 – Evolution of LTCI certified elderly and recipients aged over 65
Year 2002 2003 2004 2005 2006 2007 2008 2009 2010 Population 23 628 24 311 24 876 25 761 26 604 27 464 28 216 29 005 29 484 Certified 3 197 3 602 3 933 4 176 4 033 4 394 4 550 4 722 4 920 Recipients 2 556 2 877 3 169 3 373 3 244 3 509 3 649 3 801 3 966 Certified/Population 13,5% 14,8% 15,8% 16,2% 15,2% 16,0% 16,1% 16,3% 16,7% Recipients/Certified 80,0% 79,9% 80,6% 80,8% 80,4% 79,9% 80,2% 80,5% 80,6% (Thousands persons)
Data : stat.go.jp and mhlw.go.jp
A.2 List of physical disabilities in JSTAR 2011
– Walk 100 meters
– Sit in a chair for two hours continuously
– Get up from a chair after sitting continuously for a long time – Climb up several flights of stairs without using the handrail – Squat or kneel
– Raise your hands above your shoulders
– Push or pull a large object such as a living-room chair or sofa – Lift and carry an object weighting 5kg or more, such as a bag of rice
A.3 Summary statistics for population declaring at least one limiation
Table 8 – Statistical descriptions according to application decision (respondants with at least 1 limitation)
All Applied Not applied
Obs. Mean S.D. Obs. Mean S.D. Obs. Mean S.D.
Application 660 0.167 0.373 110 1.000 0.000 550 0.000 0.000 Female 660 0.595 0.491 110 0.491 0.502 550 0.616 0.487 Age 660 72.536 3.971 110 73.673 3.886 550 72.309 3.952 65-69 660 0.239 0.427 110 0.145 0.354 550 0.258 0.438 70-74 660 0.412 0.493 110 0.400 0.492 550 0.415 0.493 75 and more 660 0.348 0.477 110 0.455 0.500 550 0.327 0.470 Education
Junior High School 660 0.450 0.498 110 0.445 0.499 550 0.451 0.498 High School 660 0.383 0.487 110 0.382 0.488 550 0.384 0.487 Junior College 660 0.088 0.283 110 0.091 0.289 550 0.087 0.282 University and more 660 0.079 0.270 110 0.082 0.275 550 0.078 0.269
Spouse 660 0.729 0.445 110 0.718 0.452 550 0.731 0.444 Limitations 1 limitation or less 660 0.332 0.471 110 0.100 0.301 550 0.378 0.485 2-3 limitations 660 0.285 0.452 110 0.109 0.313 550 0.320 0.467 4-6 limitations 660 0.183 0.387 110 0.245 0.432 550 0.171 0.377 7 or more limitations 660 0.200 0.400 110 0.545 0.500 550 0.131 0.338 Declare interference 660 0.424 0.495 110 0.764 0.427 550 0.356 0.479 Pay no tax 660 0.136 0.343 110 0.064 0.245 550 0.151 0.358 Number of children 660 2.108 1.068 110 1.927 1.073 550 2.144 1.064 No Child 660 0.091 0.288 110 0.109 0.313 550 0.087 0.282 Closest child Coliving 660 0.379 0.485 110 0.382 0.488 550 0.378 0.485 Same Town 660 0.268 0.443 110 0.227 0.421 550 0.276 0.448 Far 660 0.262 0.440 110 0.282 0.452 550 0.258 0.438 Number of : Coliving children 660 0.429 0.603 110 0.436 0.614 550 0.427 0.601 Children in same town 660 0.555 0.778 110 0.573 0.807 550 0.551 0.773 Children far 660 1.039 0.971 110 0.836 0.914 550 1.080 0.977
Table 9 – Statistical descriptions according to residence (respondants with at least 1 limitation)
All Coliving Not Coliving
Obs. Mean S.D. Obs. Mean S.D. Obs. Mean S.D.
Applied 660 0.167 0.373 250 0.168 0.375 410 0.166 0.372 Female 660 0.595 0.491 250 0.600 0.491 410 0.593 0.492 Age 65-69 660 0.239 0.427 250 0.168 0.375 410 0.283 0.451 70-74 660 0.412 0.493 250 0.440 0.497 410 0.395 0.489 75 and more 660 0.348 0.477 250 0.392 0.489 410 0.322 0.468 Education
Junior High School 660 0.450 0.498 250 0.488 0.501 410 0.427 0.495 High School 660 0.383 0.487 250 0.356 0.480 410 0.400 0.490 Junior College 660 0.088 0.283 250 0.088 0.284 410 0.088 0.283 University and more 660 0.079 0.270 250 0.068 0.252 410 0.085 0.280
Spouse 660 0.729 0.445 250 0.736 0.442 410 0.724 0.447
Pay no tax 660 0.136 0.343 250 0.124 0.330 410 0.144 0.351
Number of children
Coliving 660 0.429 0.603 250 1.132 0.404 410 0.000 0.000 In the same town 660 0.555 0.778 250 0.428 0.638 410 0.632 0.844 Far 660 1.039 0.971 250 0.844 0.852 410 1.159 1.019 Coliving with :
Unmarried Daugther only 660 0.047 0.212 250 0.124 0.330 410 0.000 0.000 Married Daughter only 660 0.052 0.221 250 0.136 0.343 410 0.000 0.000 Daughter in Law only 660 0.123 0.328 250 0.324 0.469 410 0.000 0.000 Unmarried Son only 660 0.117 0.321 250 0.308 0.463 410 0.000 0.000 Several coliving children 660 0.041 0.198 250 0.108 0.311 410 0.000 0.000 Presence of child in the same town
Unmarried Daugther 660 0.033 0.180 250 0.020 0.140 410 0.041 0.200 Married Daughter 660 0.218 0.413 250 0.184 0.388 410 0.239 0.427 Daughter in Law 660 0.189 0.392 250 0.144 0.352 410 0.217 0.413 Unmarried Son 660 0.041 0.198 250 0.036 0.187 410 0.044 0.205 Presence of child by education
Low Educ : Unmarried Daughter 660 0.050 0.218 250 0.080 0.272 410 0.032 0.175 High educ : Unmarried Daughter 660 0.050 0.218 250 0.116 0.321 410 0.010 0.098 Low Educ : Married Daughter 660 0.152 0.359 250 0.184 0.388 410 0.132 0.339 High educ : Married Daughter 660 0.123 0.328 250 0.140 0.348 410 0.112 0.316 Low Educ : Married Son 660 0.176 0.381 250 0.288 0.454 410 0.107 0.310 High educ : Married Son 660 0.147 0.354 250 0.192 0.395 410 0.120 0.325 Low Educ : Unmarried Son 660 0.112 0.316 250 0.252 0.435 410 0.027 0.162 High educ : Unmarried Son 660 0.065 0.247 250 0.144 0.352 410 0.017 0.130
Bibliographie
Bolin, K., B. Lindgren,andP. Lundborg (2008) : “Informal and formal care among single-living elderly in Europe,” Health economics, 17(3), 393–409.
Bonsang, E. (2009) : “Does informal care from children to their elderly parents substitute for formal care in Europe ?,” Journal of health economics, 28(1), 143–154.
Campbell, J. C., and N. Ikegami (2000) : “Long-term care insurance comes to Japan,” Health Affairs, 19(3), 26–39.
(2002) : “Choices, policy logics and problems in the design of long–term care systems,” Social Policy & Administration, 36(7), 719–734.
Campbell, R., C. Nishimura, et al. (2009) : “Does it matter who cares ? A comparison of daughters versus daughters-in-law in Japanese elder care,” Social Science Japan Journal, 12(1), 1–21.
Christianson, J. B. (1988) : “The evaluation of the National Long Term Care Demonstration. 6. The effect of channeling on informal caregiving.,” Health Services Research, 23(1), 99.
Currie, J. (2004) : “The take up of social benefits,” Discussion paper, National Bureau of Economic Research.
Ettner, S. L. (1994) : “The effect of the medicaid home care benefit on long-term care choices of the elderly,” Economic Inquiry, 32(1), 103–127.
Fontaine, R. (2012) : “The effect of public subsidies for formal care on the care provision for disabled elderly people in france,” ´Economie publique/Public economics, (28-29), 271–304.
Grossman, M. (1972) : “On the concept of health capital and the demand for health,” The Journal of Political Economy, pp. 223–255.
Hanaoka, C.,andE. C. Norton (2008) : “Informal and formal care for elderly persons : How adult children’s characteristics affect the use of formal care in Japan,” Social Science & Medicine, 67(6), 1002–1008.
Izuhara, M. (2003) : “Social Inequality under a New Social Contract : Long-term Care in Japan,” Social Policy & Administration, 37(4), 395–410.
Long, S. O., and P. B. Harris (2000) : “Gender and elder care : social change and the role of the caregiver in Japan,” Social Science Japan Journal, 3(1), 21–36.
Moffitt, R. (1983) : “An economic model of welfare stigma,” The American Economic Review, pp. 1023–1035.
Ogawa, N.,andJ. F. Ermisch (1996) : “Family structure, home time demands, and the employment patterns of Japanese married women,” Journal of Labor Economics, pp. 677–702.
Ogawa, N., R. Matsukura, et al. (2009) : Rapid population aging and changing intergenerational transfers in Japan. Springer.
Pezzin, L. E., P. Kemper, and J. Reschovsky (1996) : “Does publicly provided home care sub-stitute for family care ? Experimental evidence with endogenous living arrangements,” Journal of Human Resources, pp. 650–676.
Pezzin, L. E., and B. S. Schone (1999) : “Intergenerational household formation, female labor supply and informal caregiving : A bargaining approach,” Journal of Human Resources, pp. 475– 503.
Remler, D. K., J. E. Rachlin,andS. A. Glied (2001) : “What can the take-up of other programs teach us about how to improve take-up of health insurance programs ?,” Discussion paper, National Bureau of Economic Research.
Shimizutani, S., W. Suzuki, and H. Noguchi (2008) : “The socialization of at-home elderly care and female labor market participation : Micro-level evidence from Japan,” Japan and the World Economy, 20(1), 82–96.
Stabile, M., A. Laporte, and P. C. Coyte (2006) : “Household responses to public home care programs,” Journal of health economics, 25(4), 674–701.
Suzuki, W., S. Ogura, and N. Izumida (2008) : “Burden of family care-givers and the rationing in the Long-Term Care Insurance benefits of Japan,” The Singapore Economic Review, 53(01), 121–144.
Tamiya, N., H. Noguchi, A. Nishi, M. R. Reich, N. Ikegami, H. Hashimoto, K. Shibuya, I. Kawachi,andJ. C. Campbell (2011) : “Population ageing and wellbeing : lessons from Japan’s long-term care insurance policy,” The Lancet, 378(9797), 1183–1192.
Tamiya, N., K. Yamaoka, and E. Yano (2002) : “Use of home health services covered by new public long-term care insurance in Japan : impact of the presence and kinship of family caregivers,” International Journal for Quality in Health Care, 14(4), 295–303.
Tsutsui, T., and N. Muramatsu (2007) : “Japan’s Universal Long-Term Care System Reform of 2005 : Containing Costs and Realizing a Vision,” Journal of the American Geriatrics Society, 55(9), 1458–1463.
Van Houtven, C. H., and E. C. Norton (2004) : “Informal care and health care use of older adults,” Journal of health economics, 23(6), 1159–1180.
Van Oorschot, W. J. (1998) : “Failing selectivity : On the extent and causes of non-take-up of social security benefits,” Empirical poverty research in a comparative perspective, pp. 101–132. Viitanen, T. K. (2007) : “Informal and Formal Care in Europe,” Discussion paper, Institute for the
Study of Labor (IZA).
Yong, V., andY. Saito (2012) : “National long-term care insurance policy in Japan a decade after implementation : some lessons for aging countries,” Ageing International, 37(3), 271–284.
Yuhara, E. (2011) : “Kaigo Satsujin no genjyo kara midaseru kaigoshien no kadai,” Nihon fukushi daigaku shakai fukushiron shuu, (125), 41–65.
Acknowledgement
JSTAR datasets, produced by the Research Institute of Economy, Trade and Industry (RIETI), Hitotsubashi University, and the University of Tokyo, are distributed by RIETI in Tokyo, Japan.